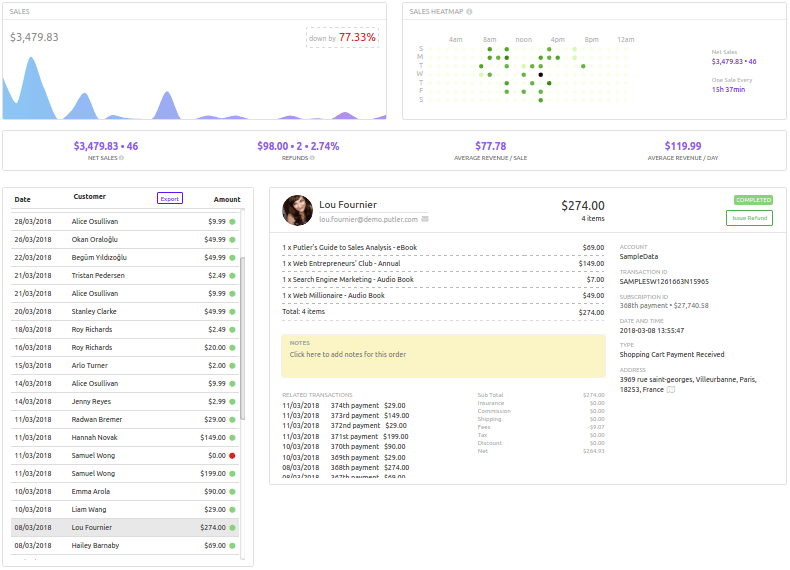
Down by % and Up by %
This is the percentage change in sales for the number of days for the selected date range compared to the same number of days in the corresponding previous date range.
Example – If you select date range as Jun 16 – Jun 30 (15 days), it will be compared with the same number of days in the corresponding previous date range, Jun 1 – Jun 15 (15 days).
Sales Heatmap
Indicates the best and worst day, the time you make sales for the selected date range. Darker the spots, more the sales.
Net Sales
Net sales are the amount of money you have earned for the selected date range after subtracting refunds, discounts from the gross sales amount for the same date range.
Here, the refunds considered would only be for the sales made in the currently selected date range. That means if the sales were made earlier than the selected date range but its refunds were processed in the currently selected date range, then those refunds won’t be subtracted. The “Refunds” calculation example below will make it more clear.
Refunds
The sum total of all the refunds processed in the selected date range; including the refunds processed for the sales made in the earlier period.
This is because the sales were made in the earlier period than the selected date range but refunds for those earlier period sales were processed in the currently selected date range.
Example–
Selected date range – June 1, 2018 – June 30, 2018
Total sales for June 2018 – $1000
Total sales for May 2018 – $850
Refunds for sales made in June 2018 and processed in June 2018 – $100.
Refunds for sales made in May 2018 but processed in June 2018 – $50.
Total refunds processed in June 2018 will be $100 + $50 = $150.
Net sales for June 2018 will be $1000 – $100 = $900; and not $850 (1000 – 100 – 50).
Net sales for May 2018 will be $850 – $50 = $800.
Average Revenue / Sale
The gross sales made during the selected date range divided by the total orders received in the same date range.
Average Revenue / Day
The net sales made during the selected date range divided by the total number of days in the same date range.
Transactions Quick-list
List of all transactions for the selected date range. Green & Red mark indicates sales & refunds respectively. You can also Export your transactions list as a CSV file.
Want these metrics for your business?
Also check out: Transactions Metrics, Products Metrics, Customer Metrics, Audience Metrics, Subscription Metrics, Time Machine Metrics, Insights, Home Metrics