Insights Dashboard
The Insights Dashboard provides comprehensive metrics to help businesses understand and optimize their performance during key periods. It consists of 2 reports:
- Holiday Insights Report
- Performance Comparison Report
By leveraging data on revenue, daily average sales, average revenue per user (ARPU), website visitors, and customer types, and identifying the best holidays for sales, businesses can make informed decisions to enhance their strategies, increase revenue, and improve overall customer satisfaction.
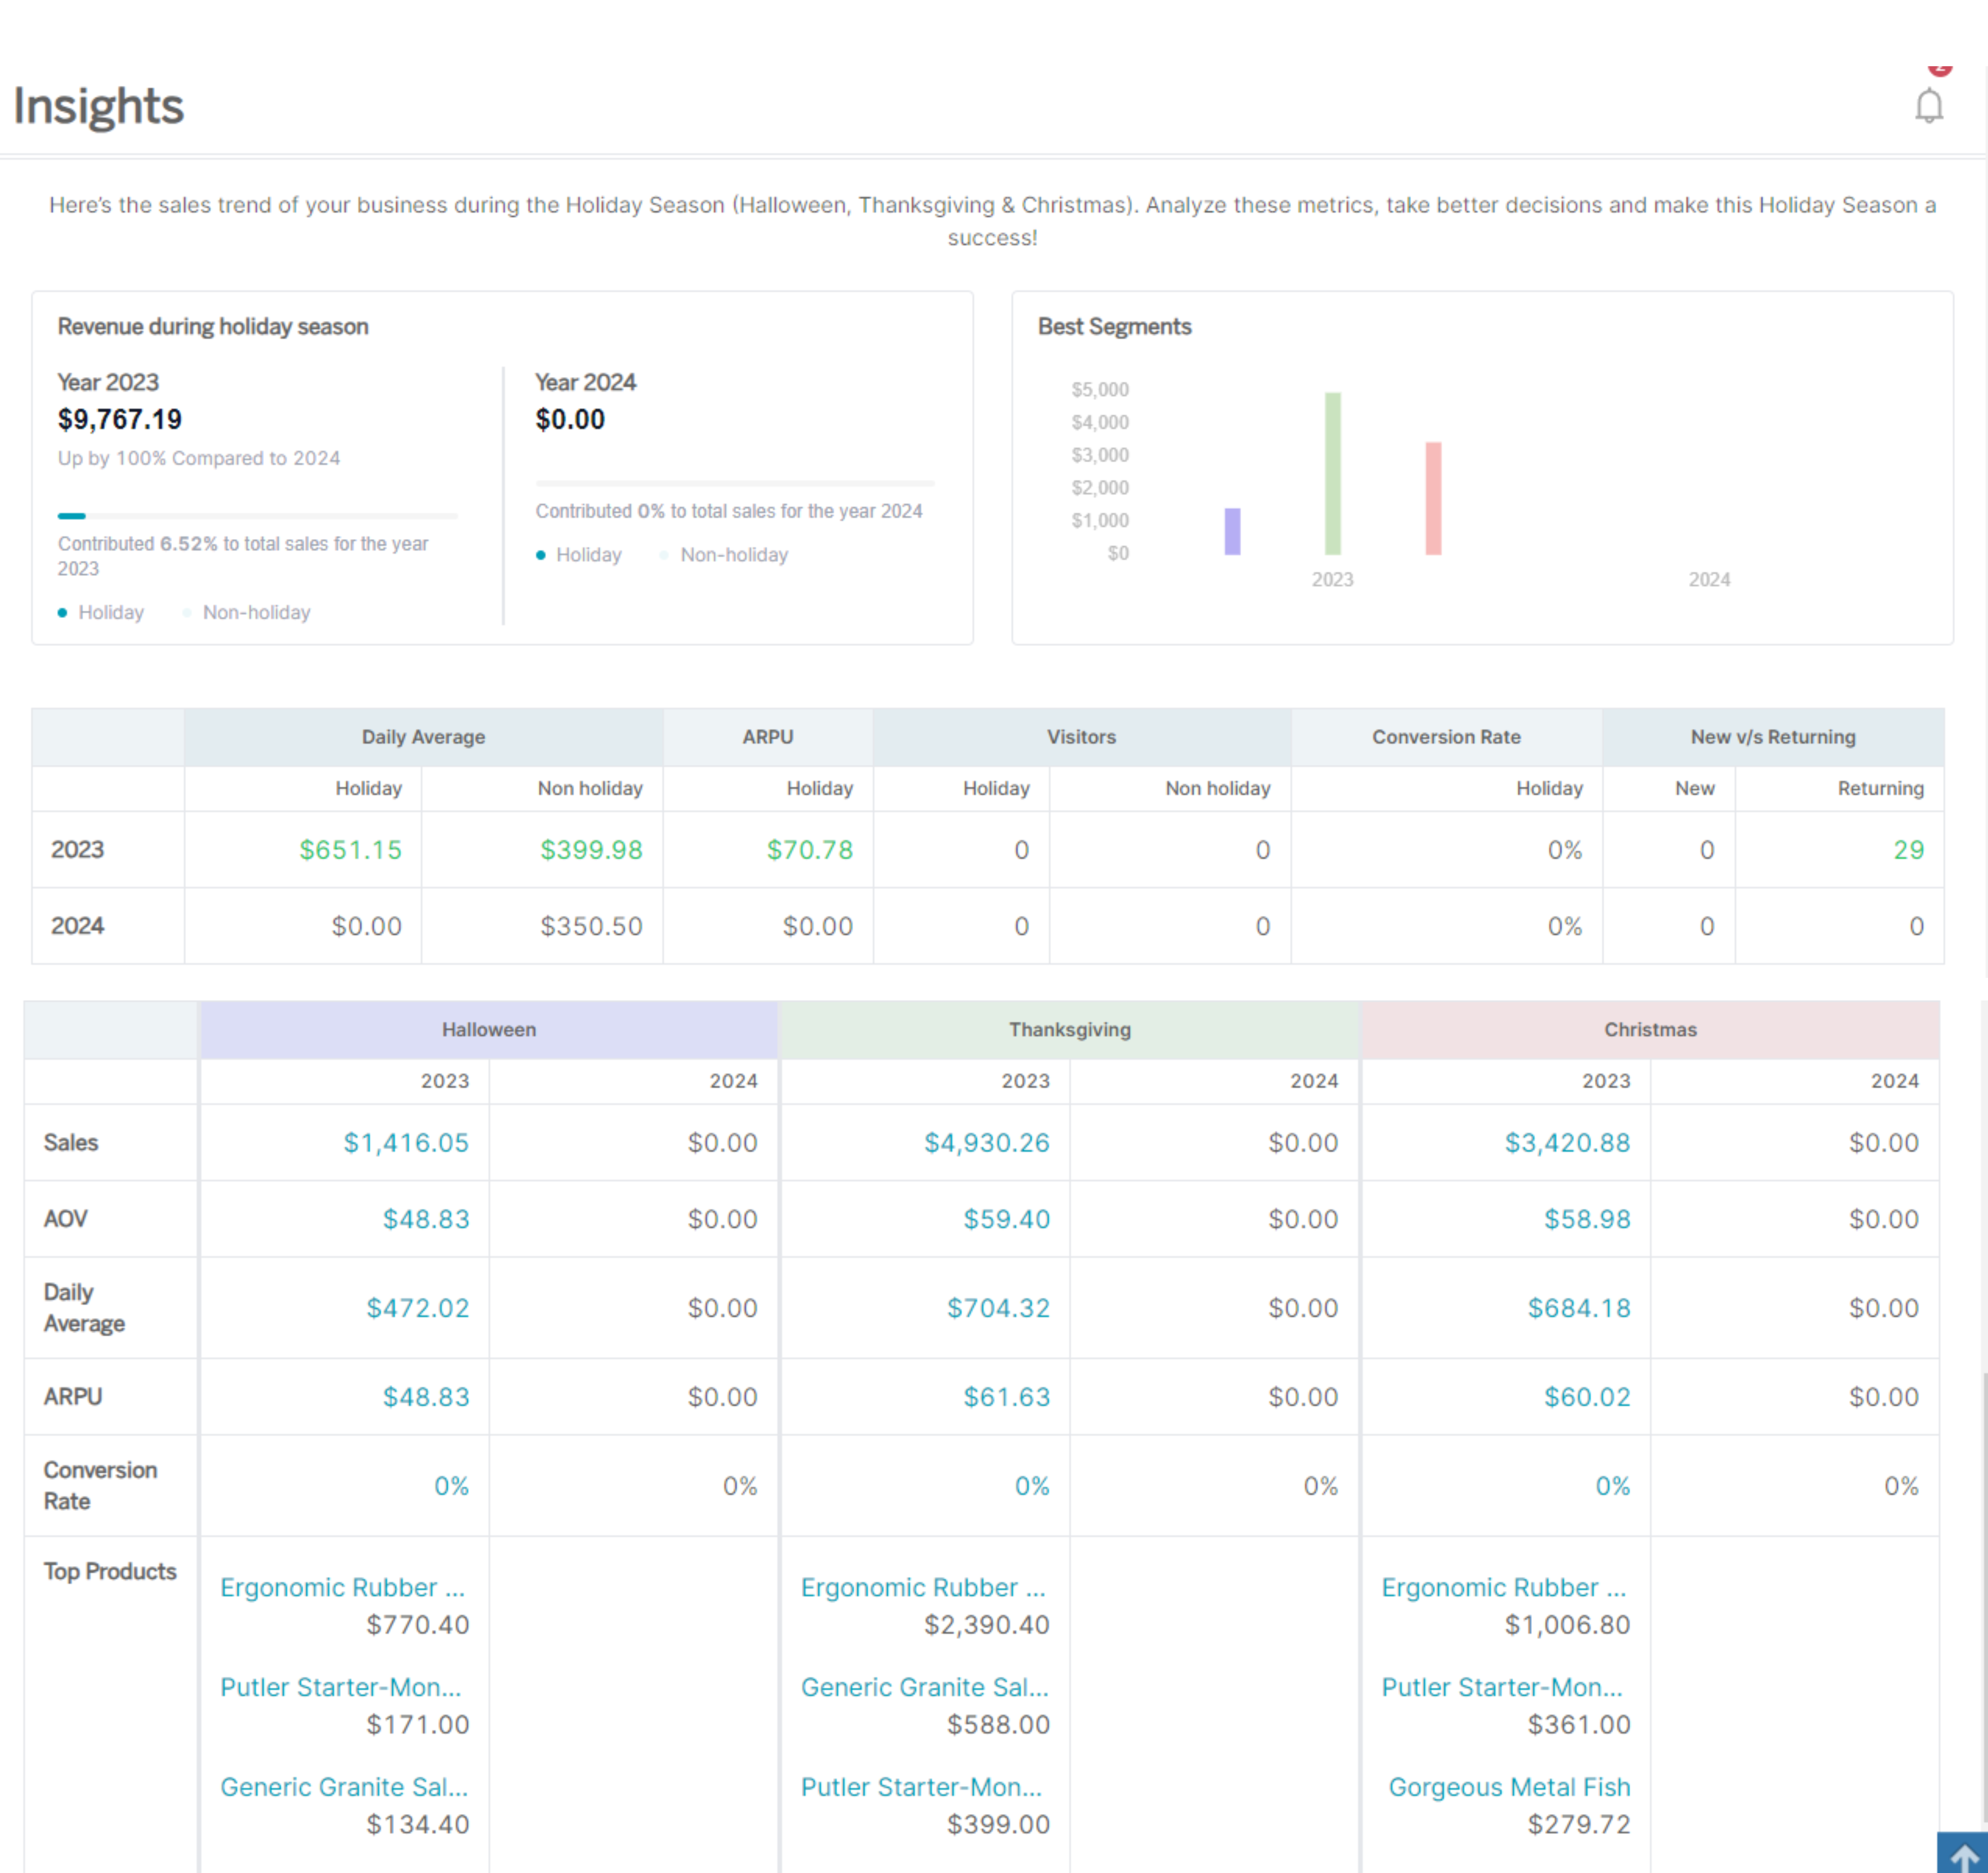
Holiday Season Insights Report
Revenue During Holiday Season
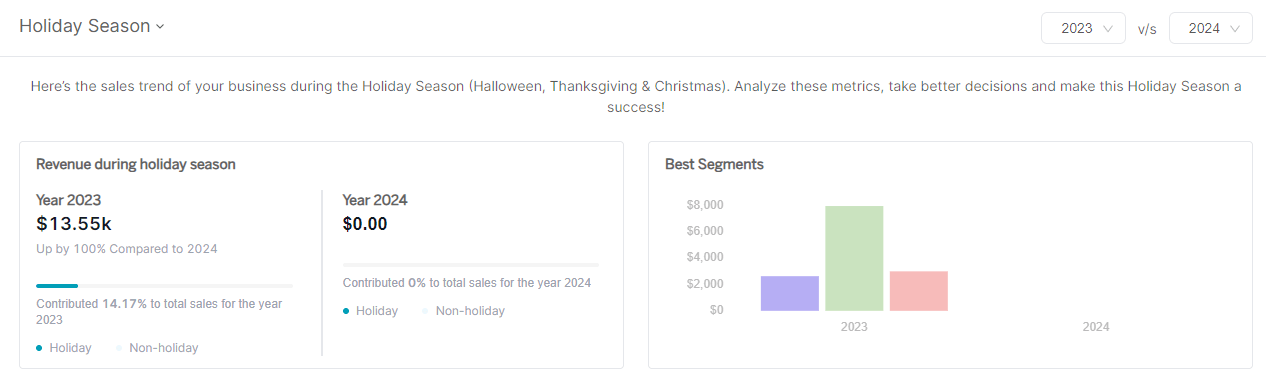
Revenue During Holiday Season refers to the sales generated during the holiday period. A 10% or 15% sales contribution to the annual total indicates a strong holiday performance, suggesting effective offers and marketing strategies.
In this report, you will come across two terms - Holiday and Non-Holiday
Holiday: Refers to specific days celebrating Halloween (3 days), Thanksgiving (7 days), and Christmas (5 days), totaling 15 days. Longer promotional offers are utilized during these periods to maximize sales. Metrics labeled as 'Holiday' represent data from these 15 days.
Non-Holiday: Non-Holiday metrics represent the performance data accumulated during all days that fall outside the defined 15-day Holiday period. These days include the periods not associated with Halloween (3 days), Thanksgiving (7 days), and Christmas (5 days).
How to use this metric?
Imagine you manage an online retail store. By analyzing holiday season revenue, you can identify which promotions and marketing strategies were most effective in the yesteryear BFCM and then use this information to plan the upcoming BFCM season or any other seasonal sale on your store.
Example
Last holiday season, your sales contributed 15% to your total annual revenue. This indicates that your Black Friday and Christmas promotions were highly successful, and you should consider repeating or refining these strategies for the upcoming year.
Benefits
- Performance Analysis: Understand the effectiveness of your holiday marketing campaigns and offers.
- Strategy Development: Use past performance to plan future holiday campaigns, ensuring they are even more successful.
- Revenue Optimization: Focus on strategies that maximize holiday sales, improving overall business performance.
Strategies to Boost Sales
- Analyze Successful Offers: Review the offers and plans that worked well in the past holiday season and devise similar or improved plans for this year.
- Web Analytics: Examine your web analytics to identify which pages performed better and which channels sent the most traffic to your website, allowing you to optimize your marketing efforts.
Daily Average
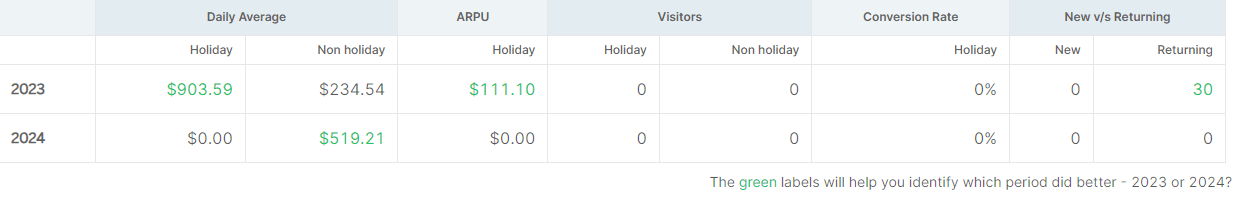
Daily Average refers to the average sales made per day during a specific period, such as the holiday season. A low daily average during the holiday season indicates that offers may not be convincing or that website traffic is insufficient. To know more click here.
How to use this metric?
Imagine you are running an online electronics store. By tracking your daily average sales during the holiday season, you can identify trends and make necessary adjustments to your marketing strategies to improve sales performance.
Example
Your daily average sales during the holiday season are lower than expected. By analyzing the data, you discover that your discounts on high-end products are not appealing enough to customers. You decide to offer bigger discounts and observe a subsequent increase in daily sales.
Benefits
- Performance Monitoring: Continuously monitor daily sales performance to quickly identify and address issues.
- Marketing Optimization: Adjust marketing strategies based on daily sales trends to maximize effectiveness.
- Revenue Growth: Increase overall revenue by implementing strategies to boost daily sales.
Strategies to Increase Daily Average
- Offer bigger discounts on high-end products.
- Run a reducing discount offer so that people buy early in the greed of getting more discounts.
ARPU (Average Revenue Per User)
ARPU measures the average revenue generated per user during a specific period. A low ARPU during the holiday season indicates that customers are purchasing more low-end plans or products, which can negatively impact overall revenue.
How to use this metric?
As a subscription-based service provider, you notice that your ARPU is lower during the holiday season. By analyzing this metric, you can identify opportunities to encourage customers to purchase higher-end plans or products.
Example
Your ARPU for the holiday season is low. You decide to bundle low-end products with high-end products at a discount, resulting in an increase in ARPU as more customers opt for the bundled offers.
Benefits
- Revenue Maximization: Increase overall revenue by encouraging higher-value purchases.
- Customer Segmentation: Identify and target high-value customers with premium offers.
- Product Positioning: Strategically position products to enhance perceived value and encourage upsells.
Strategies to Increase ARPU:
- Bundle your low-end products with high-end products and offer the bundle at a discount.
- Focus on the top 1-2% of your customers to attempt to sell your high-priced items.
Visitors
The number of visitors to your website during the holiday season compared to non-holiday periods provides insights into your marketing performance.
How to use this metric?
As a retail business owner, you track the number of visitors to your website during the holiday season to evaluate the effectiveness of your marketing campaigns and identify opportunities to increase traffic.
Example
You notice a significant drop in visitors during the holiday season compared to previous years. By improving your SEO strategy and collaborating with affiliates, you increase your website traffic and boost holiday sales.
Benefits
- Traffic Analysis: Understand visitor trends and optimize marketing strategies accordingly.
- Increased Visibility: Attract more visitors to your website, increasing the potential for sales.
- Enhanced Marketing: Develop targeted marketing campaigns to drive more traffic during key periods.
Strategies to Increase Traffic
- SEO: Identify your niche, select keywords, draft content, and promote it.
- Cross-promotion: Look out for affiliates to promote your products and gain more visibility.
New vs Returning Customers
The ratio of new to returning customers during the holiday season provides insights into customer acquisition and retention strategies.
How to use this metric?
As an e-commerce manager, you analyze the proportion of new and returning customers during the holiday season to tailor your marketing strategies for both segments.
Example
You find that returning customers make up a large portion of your holiday sales. To capitalize on this, you offer exclusive discounts to returning customers, while also providing welcome discounts to new users to encourage first-time purchases.
Benefits
- Customer Retention: Enhance customer loyalty by offering incentives to returning customers.
- Customer Acquisition: Attract new customers with special offers and promotions.
- Revenue Diversification: Balance revenue streams from both new and returning customers.
Strategies to Convert Customers
- Offer yearly plans at a discount, provide BONUSES, or offer lifetime membership to your existing customers.
- For new users, give a welcome discount to prevent them from abandoning the cart.
Best Holidays
The success of holiday sales can vary greatly depending on the business and the specific holiday. While Cyber Monday may be the most profitable period for some, others might see better results from Halloween or other holidays. Leveraging successful offers from one period and applying them to others can be an effective strategy.
How to use this metric?
- Revenue Boost: Implementing successful offers during other periods can help maintain or increase revenue throughout the year.
- Customer Retention: Extending offers and using urgency triggers can improve customer engagement and retention.
- Brand Visibility: Heavy promotion of extended offers can enhance brand visibility and attract new customers.
Benefits
- Maximized Revenue Potential: By repeating and extending successful offers, businesses can make the most out of proven strategies.
- Increased Sales Opportunities: Promoting offers with urgency can drive immediate sales and prevent missed opportunities.
- Consistent Customer Engagement: Engaging customers with well-timed offers helps maintain interest and loyalty throughout the year.
Strategies to Gain Revenue
- Repeat successful offers from one holiday period during another less profitable period.
- Extend offers for 2-3 days, promoting them heavily on social media and emails using scarcity and urgency triggers.
You can only analyze trends from past Holiday Seasons, not the current ones.
Holiday Season Comparison Report
The Holiday Season Comparison Report in Putler's Insights Dashboard is like a compass for business voyagers, guiding them through the vast sea of data to compare key performance metrics across various timeframes, products, and customer groups.
How to use this metric?
Compare performance across holiday periods like Cyber Monday, Halloween, etc. Identify which holiday is most profitable for your business. Analyze product or customer group performance over different seasons.
Example
Picture Maya, the boutique owner, sailing through the digital waves of e-commerce. Upon consulting Putler's Performance Comparison Report, she noticed a dip in sales revenue compared to the previous month.
With a curious spirit, she delves into the data, uncovering that her newly introduced jewelry line has outshone her traditional pottery collection.
Inspired by this revelation, Maya crafts a targeted marketing campaign, showcasing her unique jewelry to a broader audience.
Benefits
- Best Holiday Identification: Discover your top-performing holiday to focus efforts.
- Repeat Successful Offers: Reapply successful offers to low-performing periods.
- Extend Winning Offers: Extend promotions by 2-3 days using urgency and scarcity marketing strategies.
- Strategic Promotion: Boost sales through targeted social media and email campaigns during key periods.
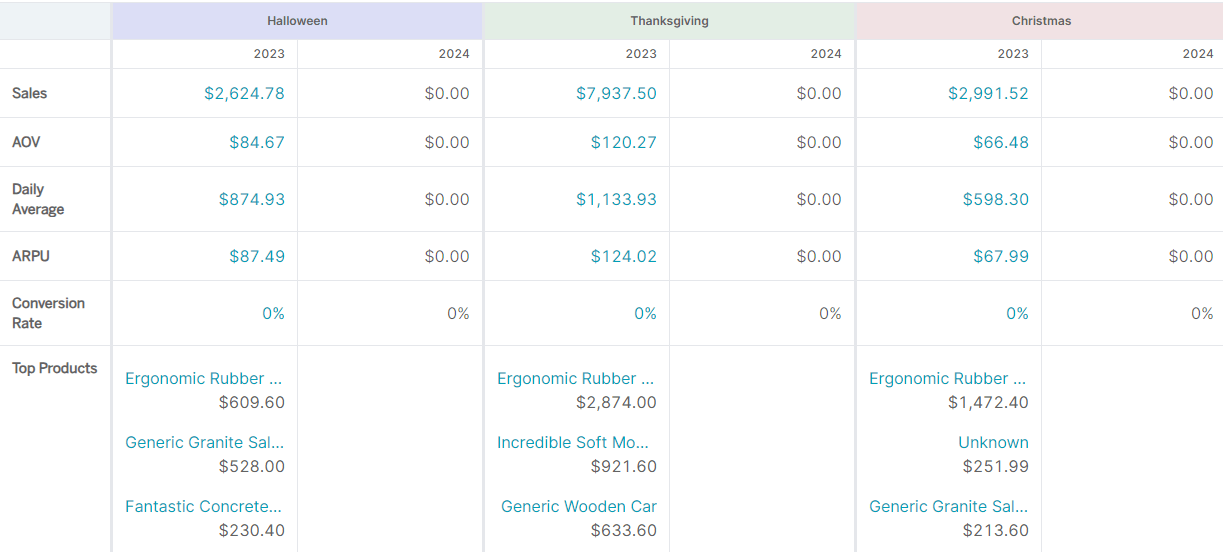
Sales
Putler’s Insights Dashboard provides a comprehensive overview of sales performance, tracking revenue generated over time, across different products, and customer segments.
How to use this metric?
Consider a boutique clothing store, 'Chic Threads'. The store manager, Sarah, utilizes Putler’s Insights Dashboard to monitor daily sales trends, identifying peak periods and slow days. With this information, she adjusts staffing levels and marketing efforts to maximize sales during high-traffic times.
Benefits
- Real-time Monitoring: Keeps track of sales performance in real-time, enabling proactive decision-making.
- Performance Evaluation: Helps evaluate the effectiveness of sales strategies and promotions.
- Revenue Optimization: Identifies opportunities to increase revenue and improve sales efficiency.
AOV (Average Order Value)
The AOV metric in Putler’s Insights Dashboard calculates the average value of orders placed by customers, providing insights into purchasing behavior and potential revenue growth.
How to use this metric?
Imagine an online electronics store, 'Gadget Haven'. The marketing team uses Putler to analyze AOV trends and discovers that customers who purchase high-end gadgets tend to buy additional accessories. Leveraging this insights, they launch targeted upselling campaigns to increase AOV.
Benefits
- Upselling Opportunities: Identifies opportunities to upsell additional products and accessories.
- Revenue Growth: Helps increase average order value, leading to higher revenue and profitability.
- Customer Insights: Provides valuable insights into customer purchasing behavior and preferences.
Daily Average
The Daily Average metric in Putler’s Insights Dashboard calculates the average daily sales revenue over a specified time period, enabling businesses to monitor sales trends and identify anomalies.
How to use this metric?
Consider a coffee shop, 'Bean Buzz'. The owner, Tom, uses Putler to track daily average sales revenue and notices a decline on weekdays. To boost weekday sales, he introduces special promotions and loyalty programs, resulting in increased foot traffic and revenue.
Benefits
- Sales Forecasting: Helps predict future sales trends and plan inventory accordingly.
- Anomaly Detection: Identifies deviations from expected sales patterns, enabling prompt action.
- Performance Benchmarking: Enables comparison of sales performance across different time periods and locations.
Top 3 Products
Putler’s Insights Dashboard highlights the top three best-selling products based on sales volume, providing visibility into product performance and popularity.
How to use this metric?
Imagine an online bookstore, 'Bookworm Haven'. The marketing team uses Putler to identify the top three bestselling books and promotes them prominently on the website homepage, leading to increased sales and customer engagement.
Benefits
- Product Performance Analysis: Provides insights into the best-selling products and customer preferences.
- Marketing Optimization: Helps prioritize marketing efforts and promotions for high-demand products.
- Inventory Management: Guides inventory decisions by highlighting products with high sales potential.
Conversion Rate
Putler’s Insights Dashboard tracks the Conversion Rate, which measures the percentage of website visitors who complete a desired action, such as making a purchase, signing up, or downloading content.
How to use this metric?
- Monitor Performance: Evaluate how effectively your website or campaigns drive visitors toward completing desired actions.
- Optimize Marketing: Identify which traffic sources or campaigns convert best, allowing better allocation of resources.
- Customer Behavior Insights: Analyze visitors behavior to tailor experiences that increase the likelihood of conversions.
Benefits
- Improved ROI: Increases the efficiency of marketing efforts by focusing on high-converting channels.
- Actionable Insights: Provides data to make informed decisions for enhancing user experience and conversion strategies.
- Goal Tracking: Helps in tracking the success of business goals related to sign-ups, sales, or downloads.
Got a minute? Watch this video to see how to Compare Holiday Season Performance in Putler.
Performance Comparison Report
Overview
The Performance Comparison Report provides a comprehensive view of your most critical business metrics on one page. It allows you to spot seasonal trends, compare performance across different teams or segments, and stay updated on your overall business health.
Set 1 & Set 2 Filters

Each section allows you to compare metrics across different time periods, teams, accounts, or segments.
- Period: Select the time frame for analysis (daily, weekly, monthly, or custom ranges).
- Teams: Choose specific teams for performance comparison.
- Segment: Filter by customer or product segments. Options include "All Segments" or specific ones. What can you compare using these filters?
Compare two teams
For this, you will first need to create teams. Once the teams are created, you can then compare the performance of the teams using the comparison performance report. You can segregate your data sources as teams or even segregate your stores within teams.
Example
1. Segregating data sources as teams: Compare how different data sources (like Stripe, PayPal, Amazon, etc) perform against each other.
Benefits
Compare which data source is performing better (where you get most revenue from, which data source is more preferred by your customers, etc)
2. Segregating stores as teams: Compare the performance of different stores or marketplaces (such as Etsy, WooCommerce, EDD, etc) within your business.
Benefits
- Track how different stores perform in terms of sales, customers, conversion rates, and overall revenue.
- Helps identify which store is performing better or which one needs improvements.
Compare the same store/data source over different time periods
This option allows users to see how a store or data source performed during different periods.
You can select the same store or data source and compare its metrics (e.g., revenue, orders, conversions) across different time periods (e.g., last month vs. this month or last year’s holiday season vs. this year’s).
Example
A store owner wants to know how their business performed during two consecutive holiday seasons. By comparing the data year-over-year, they can identify if certain campaigns or offers resulted in a higher conversion rate or sales.
Benefits
This comparison helps in identifying trends, growth, or declines over time, providing insights into the store's performance and helping in evaluating the impact of seasonal events or marketing campaigns.
Compare two segments
This feature focuses on analyzing performance across two distinct segments within the same timeframe.
Example
A business may want to compare the sales performance of returning customers vs. first-time buyers during a promotional period. By analyzing which group brought in more revenue or made larger purchases, they can adjust future marketing efforts to cater to their most valuable customer base.
Benefits
This comparison allows businesses to better understand which segments are driving more value, enabling more targeted marketing and product strategies.
Metrics Overview
The Performance Comparison Report provides a quick snapshot of all the key business metrics - Sales, Customers, Subscriptions, Visitors metrics in a single place.
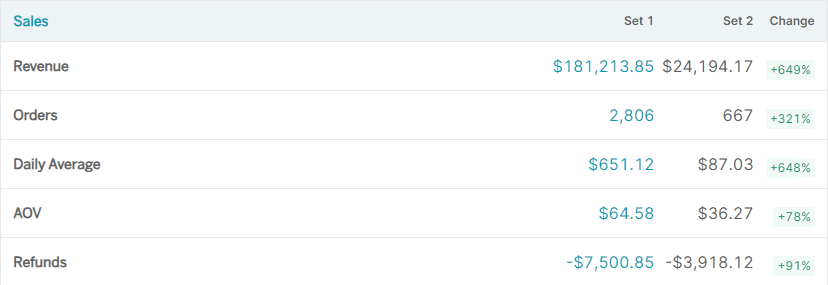
Sales Metrics
Customers Metrics

Subscriptions Metrics

Subscription metrics are not affected by filters
Visitors Metrics

Visitors metrics are not affected by filters
How to Use this Report?
- Compare Performance: Use Set 1 and Set 2 to compare key business metrics across different periods, teams, accounts, or customer segments.
- Identify Trends: Use the "Change (%)" column to spot increasing or decreasing trends in performance.
- Track Team and Customer Success: Analyze performance by team and segment to improve strategies for sales, customer acquisition, and retention.
- Monitor Subscription Metrics: Keep a close watch on your MRR, churn rate, and new vs. churned subscriptions to ensure subscription growth.
Benefits
- Unified View: Access crucial business metrics in one location to quickly grasp performance trends and make informed decisions.
- Seasonal Trend Analysis: Identify and analyze seasonal patterns to optimize strategies and anticipate market fluctuations.
- Team Performance Review: Evaluate team productivity and efficiency to ensure alignment with business goals and identify areas for improvement.
- Business Health Monitoring: Keep track of key performance indicators (KPIs) to monitor your business's overall health continuously.
This document provides an overview of the features and benefits of the Insights Dashboard in Putler. For more information or assistance, please refer to the Putler FAQ docs or contact our support team.