


Ecommerce customer analytics connects customer identities, purchases, refunds, products, and acquisition data so you can answer a specific question and choose an action. The goal is not to collect more customer metrics. It is to make one better decision, then check whether that decision worked.
A precise dashboard can still hide duplicate orders, split customer records, misplaced refunds, or unfair cohort comparisons. A better route is to identify the question, make a fair comparison, inspect the evidence, act, and re-check.
How should you use ecommerce customer analytics?
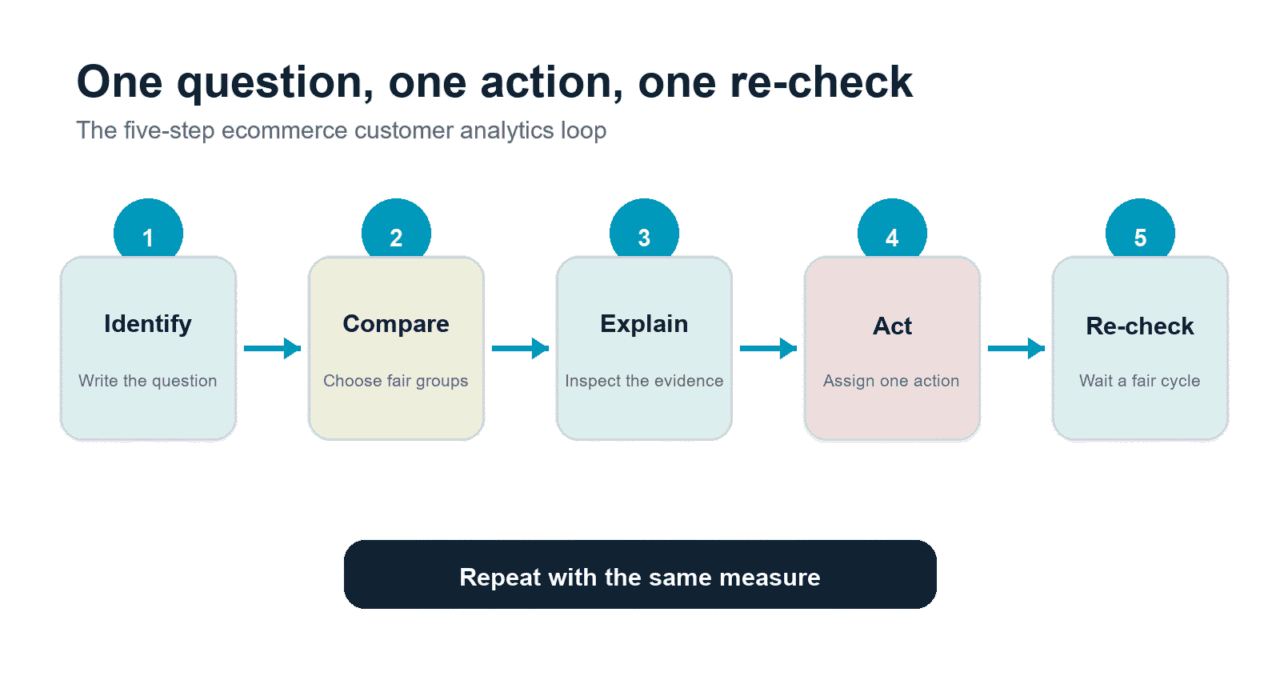
Ecommerce customer analytics works best as a five-step loop: identify the question, compare the right customers, explain the pattern, take one action, and re-check after a suitable purchase cycle.
Each step narrows the analysis until a metric becomes a decision rather than another number on a screen.
- Identify: Write the customer question and name the unit you need to study.
- Compare: Choose a segment, cohort, source, product, or period that creates a fair comparison.
- Explain: Inspect customer profiles, transactions, and relevant behavioral evidence.
- Act: Assign one action to one owner.
- Re-check: Review the same measure after customers have had enough time to respond.
One question keeps the work honest and prevents conflicting stories from the same data.
What is ecommerce customer analytics?
Ecommerce customer analytics is the analysis of customer-level data across purchases, products, refunds, acquisition sources, and interactions.
It helps a store understand who buys, how customer relationships change, which sources or products attract valuable buyers, and what action to take next.
Four common units answer different questions:
- A visitor browses a website or app.
- A customer is a person or account connected to one or more purchases.
- An order is a transaction.
- An item is a product or variation inside an order.
Mixing these units creates confident nonsense. Three items in one basket do not mean three purchases, and a returning visitor is not automatically a returning customer.
| Question | Primary source | Supporting source |
|---|---|---|
| How did a visitor reach and use the site? | Web analytics | Campaign platform |
| What was ordered and paid? | Store or payment system | Transaction analytics |
| What has one customer bought over time? | Unified customer profile | Support or CRM record |
| Why did a customer choose, leave, or complain? | Survey, interview, review, or support conversation | Behavioral and purchase history |
For the wider measurement landscape, see ecommerce analytics. This guide stays at the customer level.
Which analysis answers your customer question?
The best analysis depends on the decision you need to make. A profile explains one customer, a segment finds similar customers now, a cohort compares groups from a shared starting point, and acquisition or product analysis shows where valuable relationships began.
| Customer question | Best analysis | Evidence and likely action |
|---|---|---|
| Who is behind this pattern? | Individual profiles | Check order and refund history before contacting anyone. |
| Which customers need different treatment now? | Rule-based segments or RFM | Prioritize one group, inspect profiles, then choose a message or service action. |
| Are customers becoming more valuable over time? | Cohorts of the same age | Compare repeat purchase or value, then investigate one meaningful change. |
| Which first product creates repeat buyers? | First-product cohort | Compare second orders, then test onboarding or a relevant follow-up offer. |
| Which source brings customers who return? | Acquisition-source cohort | Compare like-aged customers, then adjust one campaign or landing path. |
| Who is overdue to buy again? | Purchase cycle plus recency | Find customers beyond the normal interval, then test a reminder or win-back. |
| Which high-revenue customers are truly valuable? | Revenue or LTV checked against refunds | Remove misleading gross spend before prioritizing service or retention. |
Several sources may help, but the analysis still needs one unit, comparison, and decision.
How do you make customer records trustworthy?
Ecommerce customer analytics is trustworthy only when identities, orders, dates, currencies, and refunds are consistent. Run these checks before ranking customers or segments.
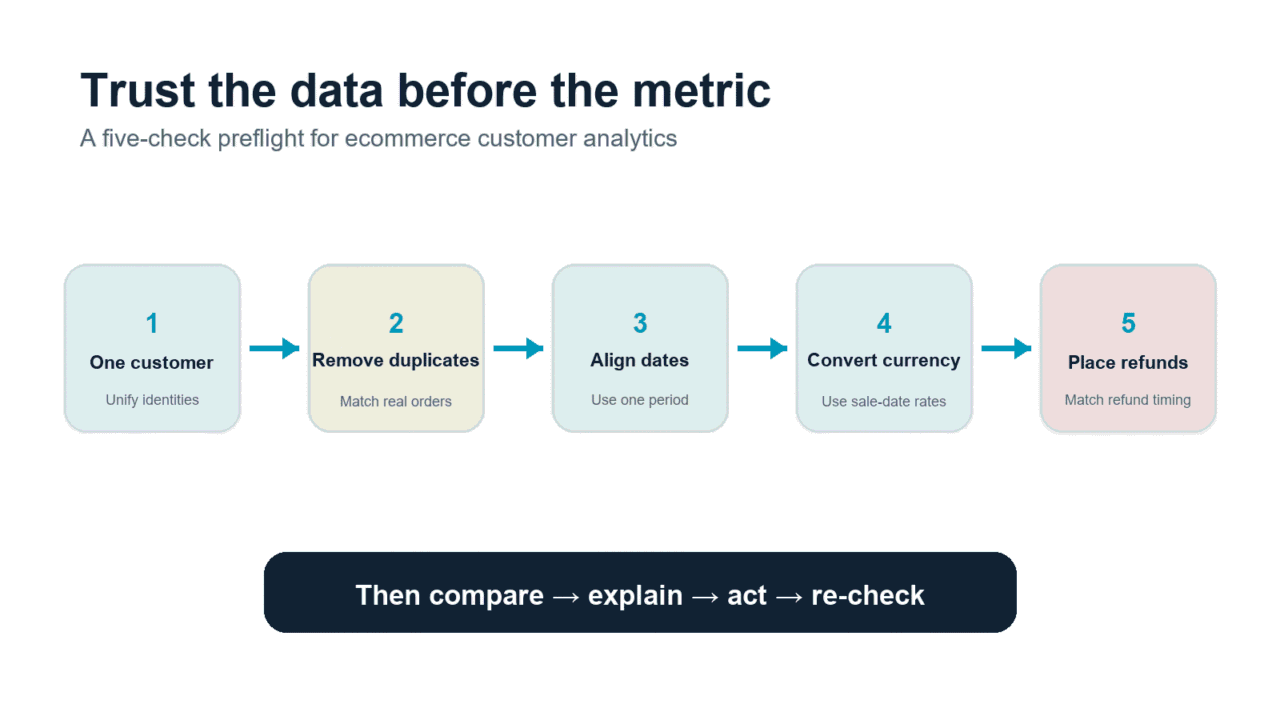
Confirm who counts as one customer
The same buyer may purchase through Stripe today and PayPal next month. If those transactions stay in separate records, purchase frequency and lifetime value fragment with them.
Putler publicly describes combining cross-gateway purchases into one profile. Do not infer undocumented rules for guest checkout, shared emails, ambiguous matches, or connector exceptions.
Remove duplicate orders
A store and its payment gateway can both record the same order. Adding two exports without reconciliation may count that sale twice.
Transaction deduplication checks whether two rows describe one payment. Customer merging checks whether separate purchases belong to one person. Putler describes automatic deduplication of matching store and gateway transactions.
Align dates, time zones, and currencies
A transaction near midnight can fall on different dates when two systems use different time zones. Currency conversion can create another small gap between gateway and analytics totals.
Putler documents 36 currencies and a fixer.io historical mid-market closing rate from the transaction date. Do not extend that rule to a later cross-currency refund without evidence.
Keep refunds attached to the right question
“How much did we refund this month?” and “How much did this month’s sales retain?” are different questions.
Putler’s Refunds metric includes refunds processed during the selected period, even when the original sale happened earlier. Net Sales subtracts refunds only for sales made inside the selected period.
Gross customer spend is not profit, and neither metric automatically includes contribution margin.
What are the four main ways to analyze ecommerce customers?
Profiles, segments, cohorts, and acquisition or product analysis solve different questions. Start with the narrowest useful method.
Use customer profiles to inspect one person’s evidence
A customer profile answers what one person bought, when they bought it, how much they spent, and what was refunded. It is the evidence behind a segment label.
Putler’s documented profile includes purchase history, products, timestamps, amounts, refunds, contact details, sales, orders, and items. Use that evidence to check a “VIP,” “at risk,” or “repeat” label.
One profile cannot prove a pattern. Spot-check several records, including outliers, before acting.
For profile fields and actions, see customer profiles.
Use segments and RFM to decide who needs attention
A customer segment groups people who share a useful condition. A rule-based segment might select customers in one country, buyers of one product, or people with more than three orders. RFM uses recency, frequency, and monetary value to prioritize customers by purchase behavior.
Spending alone can mislead. A high spender who bought once two years ago differs from someone who bought recently and often. RFM helps prioritize whom to inspect, but it cannot explain motivation or prove that a campaign caused the next order.
For the full model and segment detail, use RFM analysis.
Use cohorts to compare customers from the same starting point
A cohort groups customers around a shared event, such as first purchase month, first product, or acquisition source. Cohorts reveal how relationships develop after that common start.
Age matters. Customers acquired last month have had less time to place a second order than customers acquired six months ago. Comparing their lifetime value without adjusting for maturity makes the younger group look worse by design.
Compare like-aged cohorts. A stronger second-purchase rate may suggest better onboarding, a natural replenishment cycle, or a useful follow-up product. It does not prove which explanation is correct.
Use acquisition and product analysis to find where value begins
Storewide averages blend customers with different sources, first products, discounts, and purchase cycles. Splitting customer value by one starting dimension can show which relationships deserve more attention.
Compare time to second purchase by first product, repeat rate by source, or product affinity among returning customers. Keep cohort age consistent and check refunds.
Test one onboarding sequence, landing path, or relevant offer. Do not rebuild acquisition because one blended LTV number moved.
How do you read customer metrics without fooling yourself?
Customer metrics become misleading when definitions, denominators, or date ranges change between comparisons. State those rules before interpreting a percentage or trend. The six checks below prevent the most common mistakes.
What is the difference between new and returning customers?
A new customer makes their first-ever purchase within the selected date range. A returning customer purchased before that range and purchases again within it.
The date window changes the classification. If you select a range covering all available history, every first purchase sits inside that range, so the result may classify all customers as new.
What is the difference between one-time and repeat customers?
A one-time customer places one order in the selected range. A repeat customer places two or more orders in that range, regardless of purchases made before it.
These labels can overlap with new and returning status. A new customer who orders twice in the same month is new and repeat. A returning customer who places one order that month is returning and one-time.
Why are orders and items different?
An order is a transaction, while an item is a product unit inside that transaction. One order can contain several items, so item quantity cannot be used as purchase frequency.
Keep the distinction visible when analyzing bundles, product affinity, or high-volume buyers. Otherwise, one large basket can resemble several repeat purchases.
How should you compare LTV and revenue per customer?
Customer lifetime value estimates the value a customer may generate across the relationship. Revenue per customer describes revenue across the population and period used by the calculation.
Check cohort age, refunds, buyer type, and the formula before comparing LTV across sources or periods. A universal “good LTV” ignores differences in margins, prices, and repurchase cycles.
How should you compare repeat and retention rates?
A repeat or retention rate needs a stated denominator, time window, expected purchase cycle, and cohort age. Without those four details, two percentages may carry the same label while measuring different behavior.
Use one internal definition across like groups and time periods. A replenishable product and a durable product should not share a generic benchmark.
What can an RFM segment prove?
An RFM segment can show that customers differ by how recently, frequently, and heavily they purchased. It cannot prove why those differences exist or what caused a later change.
Treat the segment as a prioritization tool. Customer profiles, qualitative feedback, and a measured campaign or experiment supply the next layer of evidence.
How do duplicates, currencies, and refunds change one customer’s story?
The following hypothetical shows why customer-level analysis needs consistent identity, order, currency, and refund rules. Maria places four orders with a skincare store over five weeks. The store uses WooCommerce, Stripe, PayPal, and USD as its Putler base currency.
| Date | Transaction | USD reporting treatment |
|---|---|---|
| March 4 | €120 bundle in WooCommerce, paid through Stripe | The duplicate store and gateway records become one $129.60 sale at a hypothetical 1.08 transaction-date rate. |
| March 19 | $85 refill through PayPal | The order joins Maria’s existing customer profile. |
| April 2 | £60 serum through Stripe | The sale becomes $76.20 at a hypothetical 1.27 rate. Maria is returning in April. |
| April 8 | $50 gift set through PayPal | The order joins the same profile. |
| April 10 | Full $85 refund for the March 19 refill | April Refunds increases by $85, but April Net Sales does not fall because the original sale was in March. |
| April 15 | $20 partial refund on the April 8 gift set | April Refunds increases by $20, and April Net Sales falls by $20 because the sale was in April. |
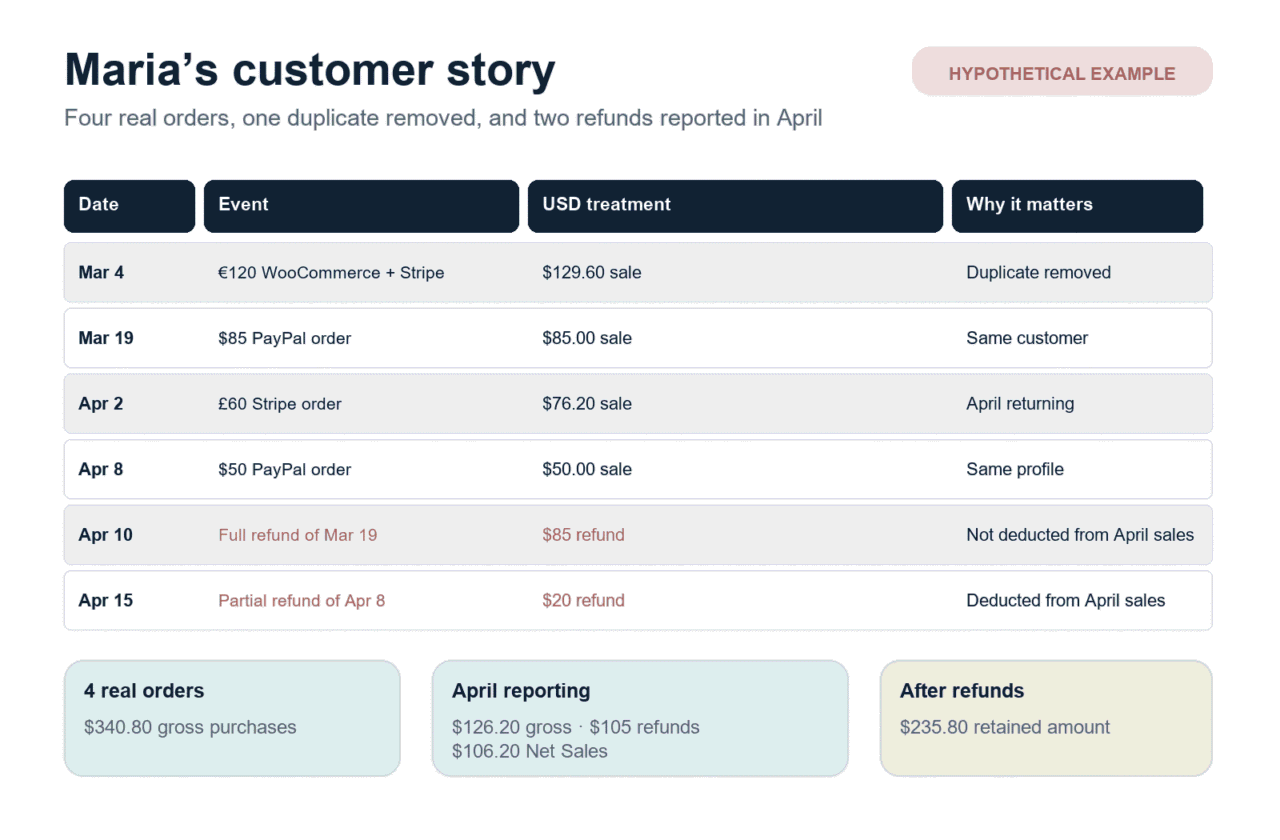
Maria’s April gross sales are $126.20 ($76.20 + $50). April Refunds are $105 ($85 + $20), but April Net Sales are $106.20 ($126.20 - $20). The $85 refund of the March sale belongs in April’s refund activity, not as a deduction from April-originated sales.
Across all four hypothetical orders, Maria has $340.80 in gross purchases, $105 refunded, and $235.80 retained. Her April classification is one returning customer.
A spreadsheet stitched from separate exports can tell a different story. Counting the WooCommerce and Stripe rows separately creates five orders and $470.40 in gross purchases, about 38% too high.
Keeping Stripe and PayPal customer lists separate turns Maria into two customers. Subtracting every refund processed in April from April sales produces $21.20 instead of $106.20.
The exchange rates are illustrative. Both refunds stay in USD because the public documentation does not establish a cross-currency refund rate.
How can you use Putler for ecommerce customer analytics?
Putler illustrates the framework when purchases span stores and payment sources. The four views below move from a broad signal to a checked customer list and action.
Check the customer health summary
Start with the metric tied to your question. The Customers Dashboard documents new, returning, refunded, LTV, revenue/customer, acquisition, and customer-breakdown views.
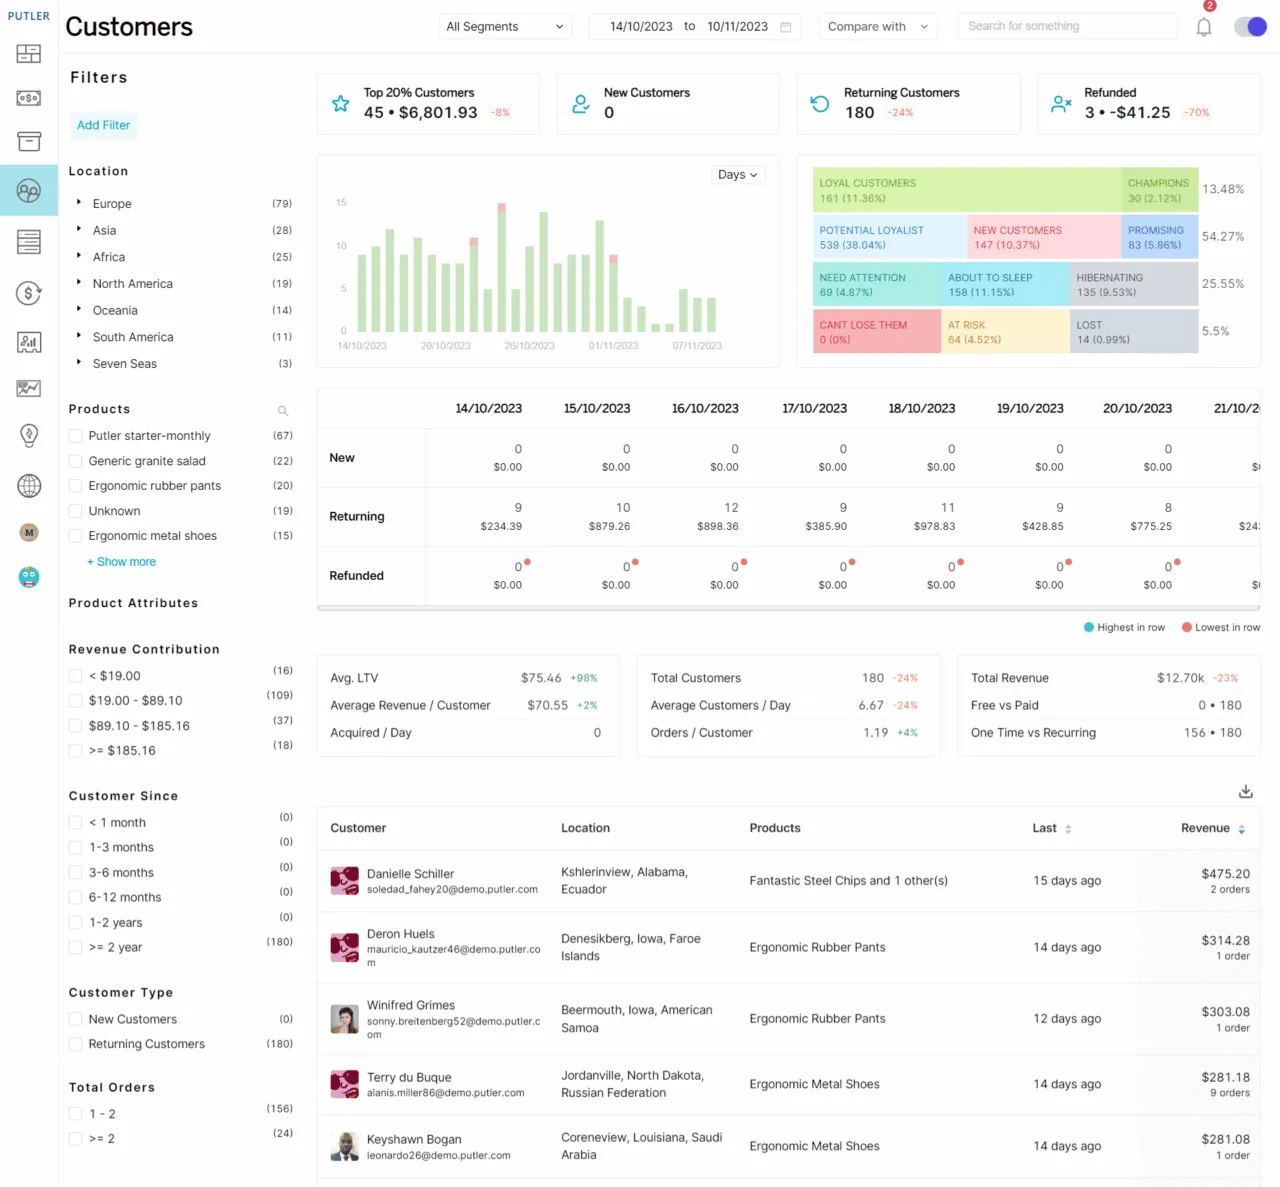
- Inspect: The relevant period, metric definition, trend, and comparison group.
- Check: Whether a change is large enough to justify a narrower analysis.
- Act: Choose the next profile, segment, cohort, product, or source view.
Narrow the population with filters and segments
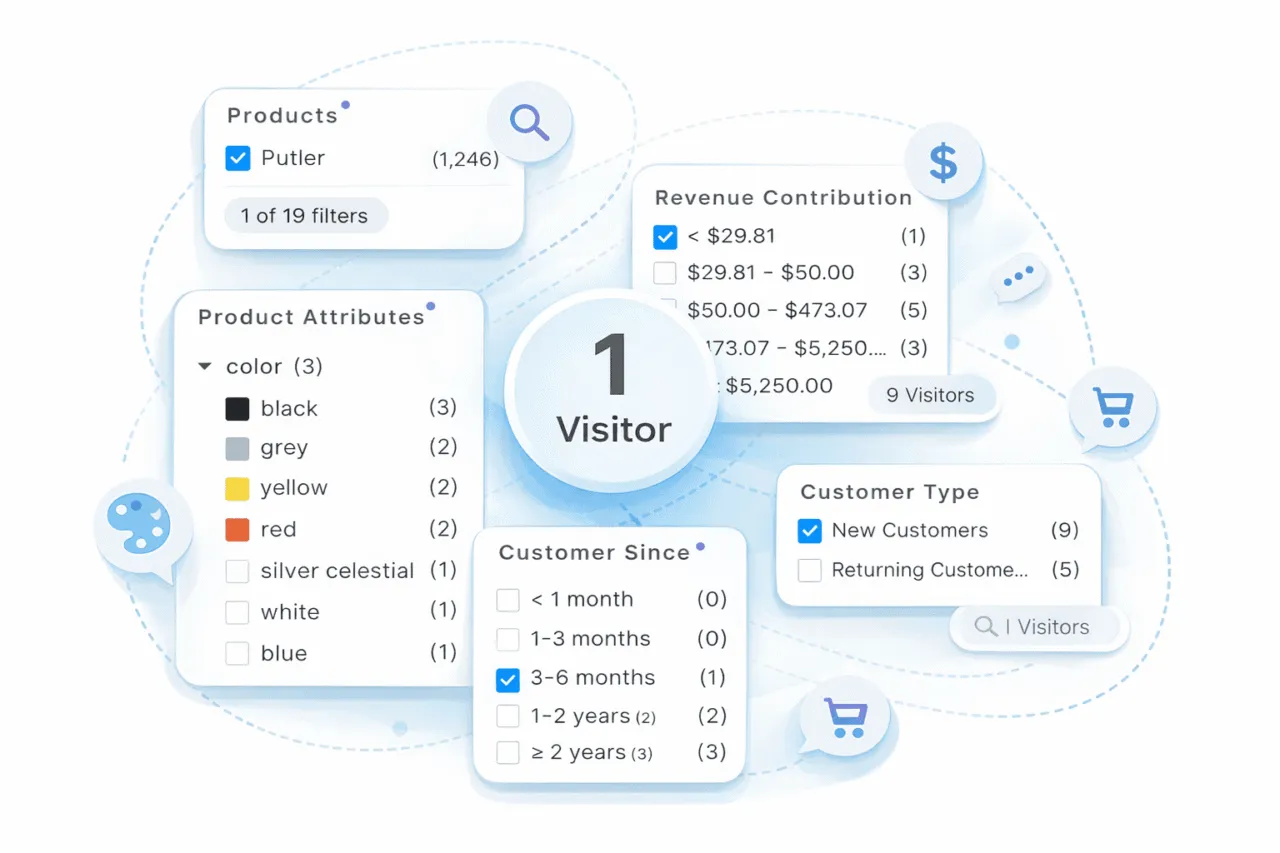
A storewide average often hides the customers connected to a decision. Putler documents filters for location, product, product attribute, revenue contribution, customer-since date, customer type, and number of orders.
- Inspect: One filter that maps directly to the question.
- Check: The number and profiles of customers included after filtering.
- Act: Export the group only after the segment passes a sanity check.
Use RFM to prioritize, then inspect profiles
RFM can quickly narrow a large customer base to people who may deserve attention. The profile supplies the purchase and refund history behind that label.
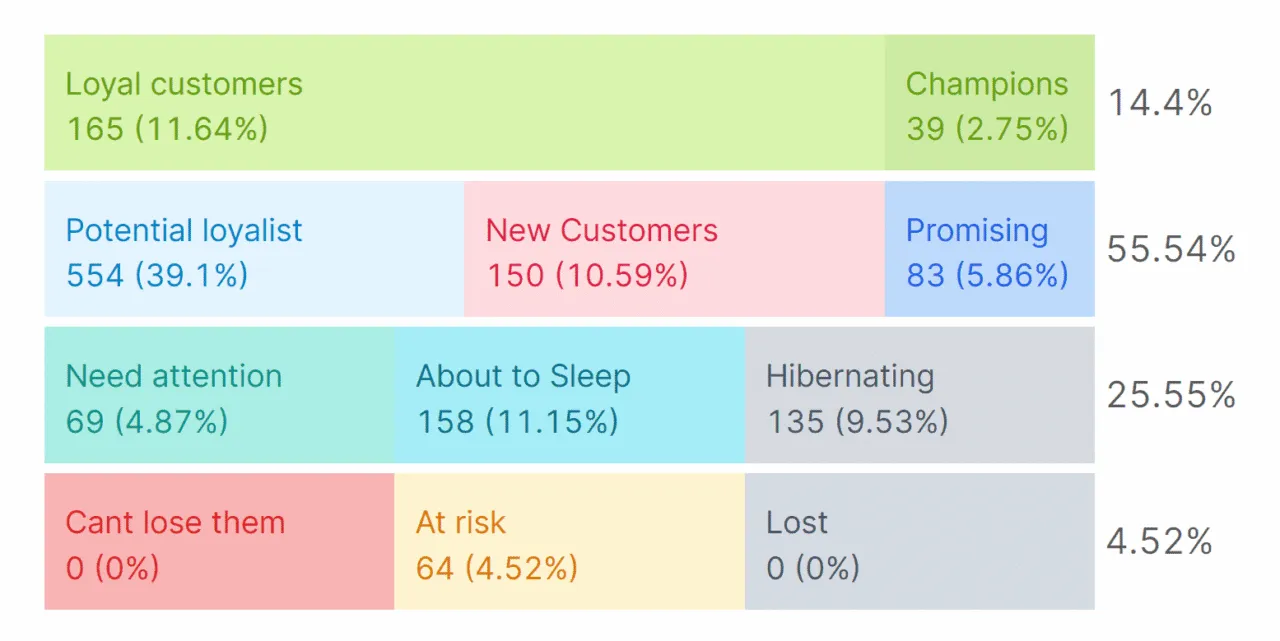
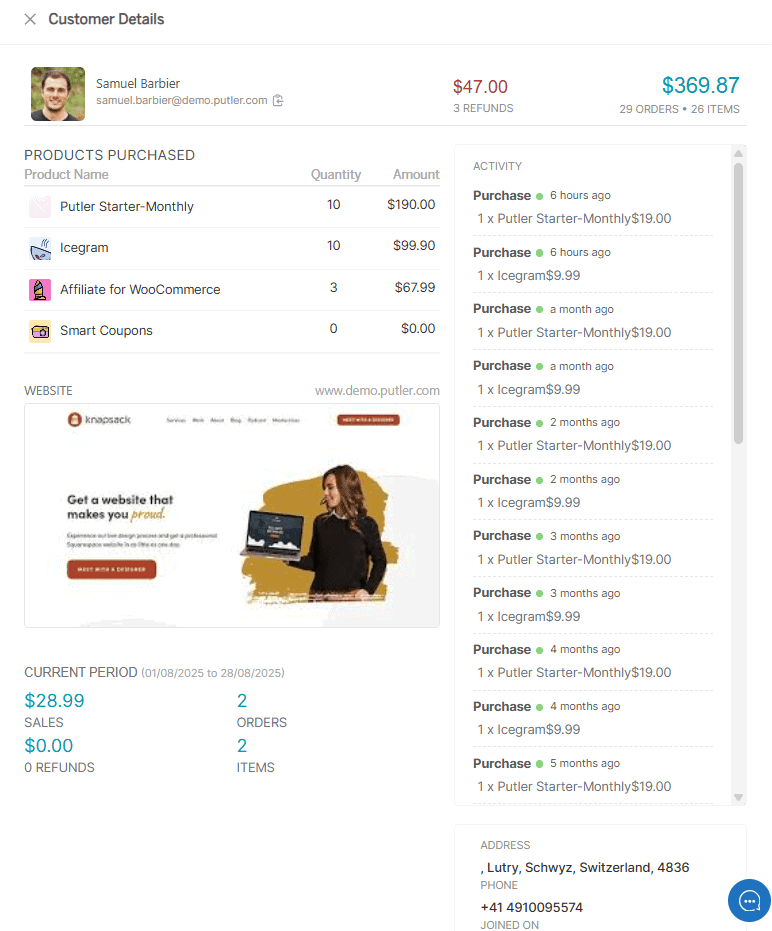
- Inspect: Recency, frequency, monetary value, products, order dates, and refunds.
- Check: Several profiles, including an apparent outlier.
- Act: Match one segment to a specific service, retention, or research action.
Export or act, then schedule the re-check
Putler documents CSV export and sending selected contacts to a Mailchimp audience. Stores that run follow-ups through eCommerce CRM software can import the same checked list there. An export moves a list. It does not prove that the segment was correct or that the campaign worked.
Record the owner, channel, success measure, and re-check date. Documented profile actions include notes, email, tags, and eligible full or partial refunds.
What is a 15-minute ecommerce customer analytics routine?
A useful routine can fit into 15 focused minutes when the data is connected and checked. Stop after one decision so the review stays repeatable.
Step 1: identify the question
Write the decision in plain language. “Which first product leads to a second order?” is useful. “Review customer analytics” is not.
Step 2: choose a fair comparison
Pick one segment, cohort, source, product, or period. Match cohort age and keep the metric definition stable so the comparison answers the question you wrote.
Step 3: explain the pattern
Open several customer profiles and one complementary source. Purchase history shows what happened. Web behavior, support messages, or a survey may help explain why.
Step 4: assign one action
Name the owner and the change. “Send a refill reminder to customers whose purchase interval has passed” is an action. “Improve retention” is a hope wearing office clothes.
Step 5: set the re-check date
Choose a date based on the normal purchase cycle. Re-checking tomorrow is pointless when customers usually reorder after six weeks.
Use this one-line worksheet:
We want to know ___, so we will compare ___ using ___, take ___ action, and re-check on ___.
When can customer analytics not answer the question alone?
Customer analytics can show patterns in identities, purchases, products, refunds, and value. It cannot supply every part of the explanation. Use another source when the question moves beyond post-purchase evidence.
- Use GA4 or another web analytics tool for acquisition, sessions, landing pages, events, and on-site paths.
- Use the store, payment gateway, or accounting system to verify actual orders, payouts, taxes, and financial records.
- Use support conversations, reviews, surveys, and interviews to understand motives or dissatisfaction.
- Use an experiment or controlled comparison before claiming that a campaign caused a change.
Ecommerce web analytics explains how behavioral and transaction data complement each other. Neither system should be forced to answer a question it was not built to measure.
FAQs
What is ecommerce customer analytics?
Ecommerce customer analytics studies customer-level identities, purchases, products, refunds, value, and acquisition data. It helps a store understand who buys, how customer relationships change, which sources or products attract valuable buyers, and which action to take. The analysis differs from general traffic reporting because the customer, not the visit, is the main unit.
What customer data should an ecommerce store track?
Track only data connected to a decision. A practical base includes a stable customer identifier, order and item history, transaction dates, amounts, currencies, refunds, first product, acquisition source, and consented contact details. Add web behavior or support data when it helps explain a purchase pattern. Avoid collecting fields merely because a tool offers them.
What is the difference between new, returning, one-time, and repeat customers?
New and returning describe purchase history relative to the selected date range. One-time and repeat describe order count inside that range. A person can be new and repeat after placing two first-period orders. Another person can be returning and one-time after buying before the range and placing one order within it.
What is the difference between segmentation, RFM, and cohort analysis?
Segmentation groups customers by any useful condition. RFM is one behavioral segmentation method based on recency, frequency, and monetary value. Cohort analysis groups customers around a shared starting event, such as first purchase month, then compares how their behavior develops. Use RFM for prioritization and cohorts for change over time.
What is a good repeat customer rate for ecommerce?
No universal repeat customer rate fits every ecommerce business. The useful comparison depends on the denominator, date window, product type, expected repurchase cycle, margin, and cohort age. Define the rate once, compare like groups, and track the internal trend. A durable-goods store should not copy a replenishment brand’s target.
What should you do next?
Write down the customer question that matters most this week. Check identity, duplicates, dates, currencies, and refund treatment. Then choose the matching analysis, inspect the evidence, assign one action, and set a realistic re-check date.
If the question crosses several stores or payment sources, run the same decision through a consolidated post-purchase view. Do not replace a clear question with another dashboard.
What else should you read about customer analytics?
Segmentation and retention have their own sections, listed below. The guides here cover the foundations: building customer profiles, turning customer data into insights, and reading user behavior so you know who buys, why they come back, and why they leave.
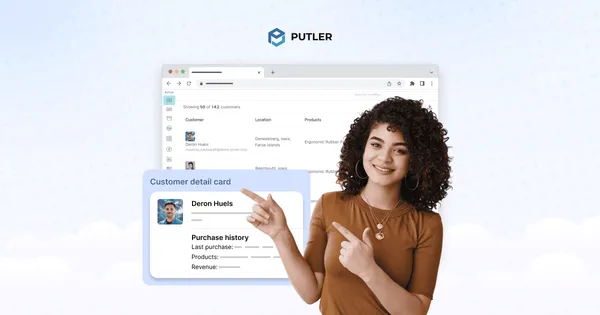
Stop guessing who your best customers are. Putler's customer profiles build a complete picture of every buyer automatically. No manual entry, no extra tools.
Explore the essential guide to User Behavior Analytics (UBA) for achieving business success. Learn why UBA is crucial, its benefits, key metrics, common mistakes to avoid, and how to analyze user behavior effectively with Putler.

Discover the game-changing power of customer insights! Explore how decoding feedback with tools like Putler transforms strategies, boosts engagement, and bridges the gap between expectations and reality.

Effective customer analysis helps businesses know their current and prospective buyers. Learn how to analyze customers and align your service delivery with regards to customer needs.