

Market basket analysis finds products that customers buy together in the same transaction. Store owners use these patterns to choose cross-sells, recommendations, and bundle ideas worth testing.
A popular pairing can look like an obvious sales opportunity. But two popular products may appear together simply because almost everyone buys them. Count the same order twice, and even the ranking of your product pairs can change.
This guide uses twenty fictional orders to explain support, confidence, and lift, then shows how to check a pairing before making an offer.
What is market basket analysis used for?
Market basket analysis helps retailers identify products that occur together in purchases and consider how to merchandise them. Common applications include complementary recommendations, optional bundles, and product placement. The analysis describes buying patterns; a separate test is needed to learn whether changing an offer improves results.
You might recommend filters beside coffee or test a mug as an optional add-on. The question is which pairing deserves attention, rather than which two products sell the most units.
“Basket analysis,” “shopping basket analysis,” and “market basket analytics” often describe this same task. In this guide, one basket means one completed order, not everything a customer has bought over their lifetime.
Use sales analytics to place a pairing alongside broader sales trends. A pair can be interesting without being your next merchandising priority.
What data do you need before analysing baskets?
A useful basket dataset needs a stable order identifier and the products in each eligible order. The observation window, order exclusions, and product grouping must stay consistent throughout the calculation. Multiple line items belong to one basket, and multiple units of one product still count as one product presence.
Define the eligible orders
Choose a period that reflects the decision you’re making. Mixing holiday promotions with ordinary trading may hide a change in buying behaviour.
Decide how to treat test orders, cancellations, and refunds before counting. For example, an analysis of completed purchases and an analysis of products customers ultimately kept answer different questions. Record your choice so another person can reproduce it.
Keep order and product identities stable
Keep the store identifier with the order identifier when combining stores. Order 1001 from one store isn’t automatically the same sale as order 1001 from another.
Choose products or variants as the unit, then apply that choice throughout. Counting blue and red mugs separately answers a different question from counting all mugs together.
Count baskets, not units. In the sample below, coffee appears in eight orders, although one order contains two units. That makes nine coffee units but only eight coffee-containing baskets.
If several systems describe the same sale, combine sales records without double counting before calculating product associations. A payment record isn’t automatically an additional basket.
Market basket analysis example: how do support, confidence, and lift work?
Support measures how often a product pair appears across all baskets. Confidence measures how often product B appears in baskets containing product A. Lift compares that confidence with B’s overall purchase frequency. These measures answer different questions, so the same pair should be examined using all three.
Every order in this example is fictional. The small dataset makes the arithmetic visible; it isn’t customer evidence or a basis for launching an offer.
| Products in the basket | Number of orders |
|---|---|
| Coffee + filters | 4 |
| Coffee + mug | 3 |
| Coffee only | 1 |
| Filters only | 4 |
| Mug only | 4 |
| Tea only | 4 |
| Total | 20 |
Coffee appears in eight baskets, filters in eight, and mugs in seven. Four baskets contain coffee and filters together; three contain coffee and a mug.
Support: how common is the pair?
Support is the share of all baskets containing both products. The denominator includes every eligible basket, including orders containing neither product. For coffee and filters, four qualifying baskets divided by twenty total baskets gives 20% support. Support describes the pair’s reach within this dataset, rather than its profitability.
Support(A and B) = baskets containing both A and B ÷ all baskets
For coffee and filters: 4 ÷ 20 = 20%.
For coffee and a mug: 3 ÷ 20 = 15%.
A pair with very few occurrences needs caution even when another measure looks strong. Keep the actual pair count beside the percentage so a high percentage based on only a few baskets does not overstate the evidence.
Confidence: how often does B appear with A?
Confidence is the share of A-containing baskets that also contain B. The direction matters because changing the starting product can change the denominator. Coffee → filters asks about filter purchases among coffee baskets. Filters → coffee asks about coffee purchases among filter baskets, which is a different conditional question.
Confidence(A → B) = baskets containing both A and B ÷ baskets containing A
For coffee → filters: 4 ÷ 8 = 50%.
For coffee → mug: 3 ÷ 8 = 37.5%.
A conditional rule sets the calculation’s direction, not an order of events. Nothing about that direction establishes which product caused the purchase or which item entered the basket first.
Lift: how does the pair compare with B’s baseline?
Lift compares confidence with the overall share of baskets containing B. A lift above one means B occurs more often among A-containing baskets than across all baskets in the dataset. A value of one indicates the same frequency. Lift alone doesn’t establish causation, statistical reliability, or a profitable offer.
Lift(A → B) = confidence(A → B) ÷ support(B)
Filters appear in 8 ÷ 20 = 40% of baskets. Coffee → filters therefore has lift of 50% ÷ 40% = 1.25.
Mugs appear in 7 ÷ 20 = 35% of baskets. Coffee → mug has lift of 37.5% ÷ 35% = about 1.07.
These definitions follow the association-rule documentation. Lift of 1.25 does not mean a recommendation will increase revenue by 25%.
Which mistakes can change the result?
Incorrect basket identity can change both the counts and the apparent strength of a pairing. Counting an existing sale again inflates the dataset, while merging unrelated orders creates combinations that never occurred. A reliable market basket analysis needs checks for both errors before any pair becomes a test candidate.
Count each order once
Suppose three coffee-and-mug orders appear again in an already-itemised feed. Treating those copies as new orders produces 23 apparent baskets instead of twenty.
The comparison below shows how duplicated observations reverse the lift ranking:
| Input | Coffee → filters lift | Coffee → mug lift |
|---|---|---|
| 20 genuine sample orders | 1.25 | 1.07 |
| 23 observations including 3 copies | 1.05 | 1.25 |
The coffee-and-mug pair count rises from three to six, and coffee appears in eleven apparent baskets. Mug appears in ten, while the filter count stays at eight. Those changed denominators reverse the ranking by lift.
No customer made another purchase. Only the records changed.
This is an illustrative joined feed with supplied order mappings, not a native payment-provider export. Don’t infer that a gateway CSV always includes product SKUs or that matching amounts and email addresses safely identifies duplicate orders.
Keep different stores’ orders separate
The two fictional stores also reuse order numbers 1001-1010. Grouping by order number alone collapses twenty genuine orders into ten false baskets.
That mistake produces two coffee-and-tea combinations, even though no genuine order contains both. Include the store identity when the order number isn’t globally unique.
Download the synthetic sample and calculation notes. The package explains the supplied mappings and input fields. Its schema is a teaching format, not Shopify’s native export layout.
How can you do market basket analysis for Shopify?
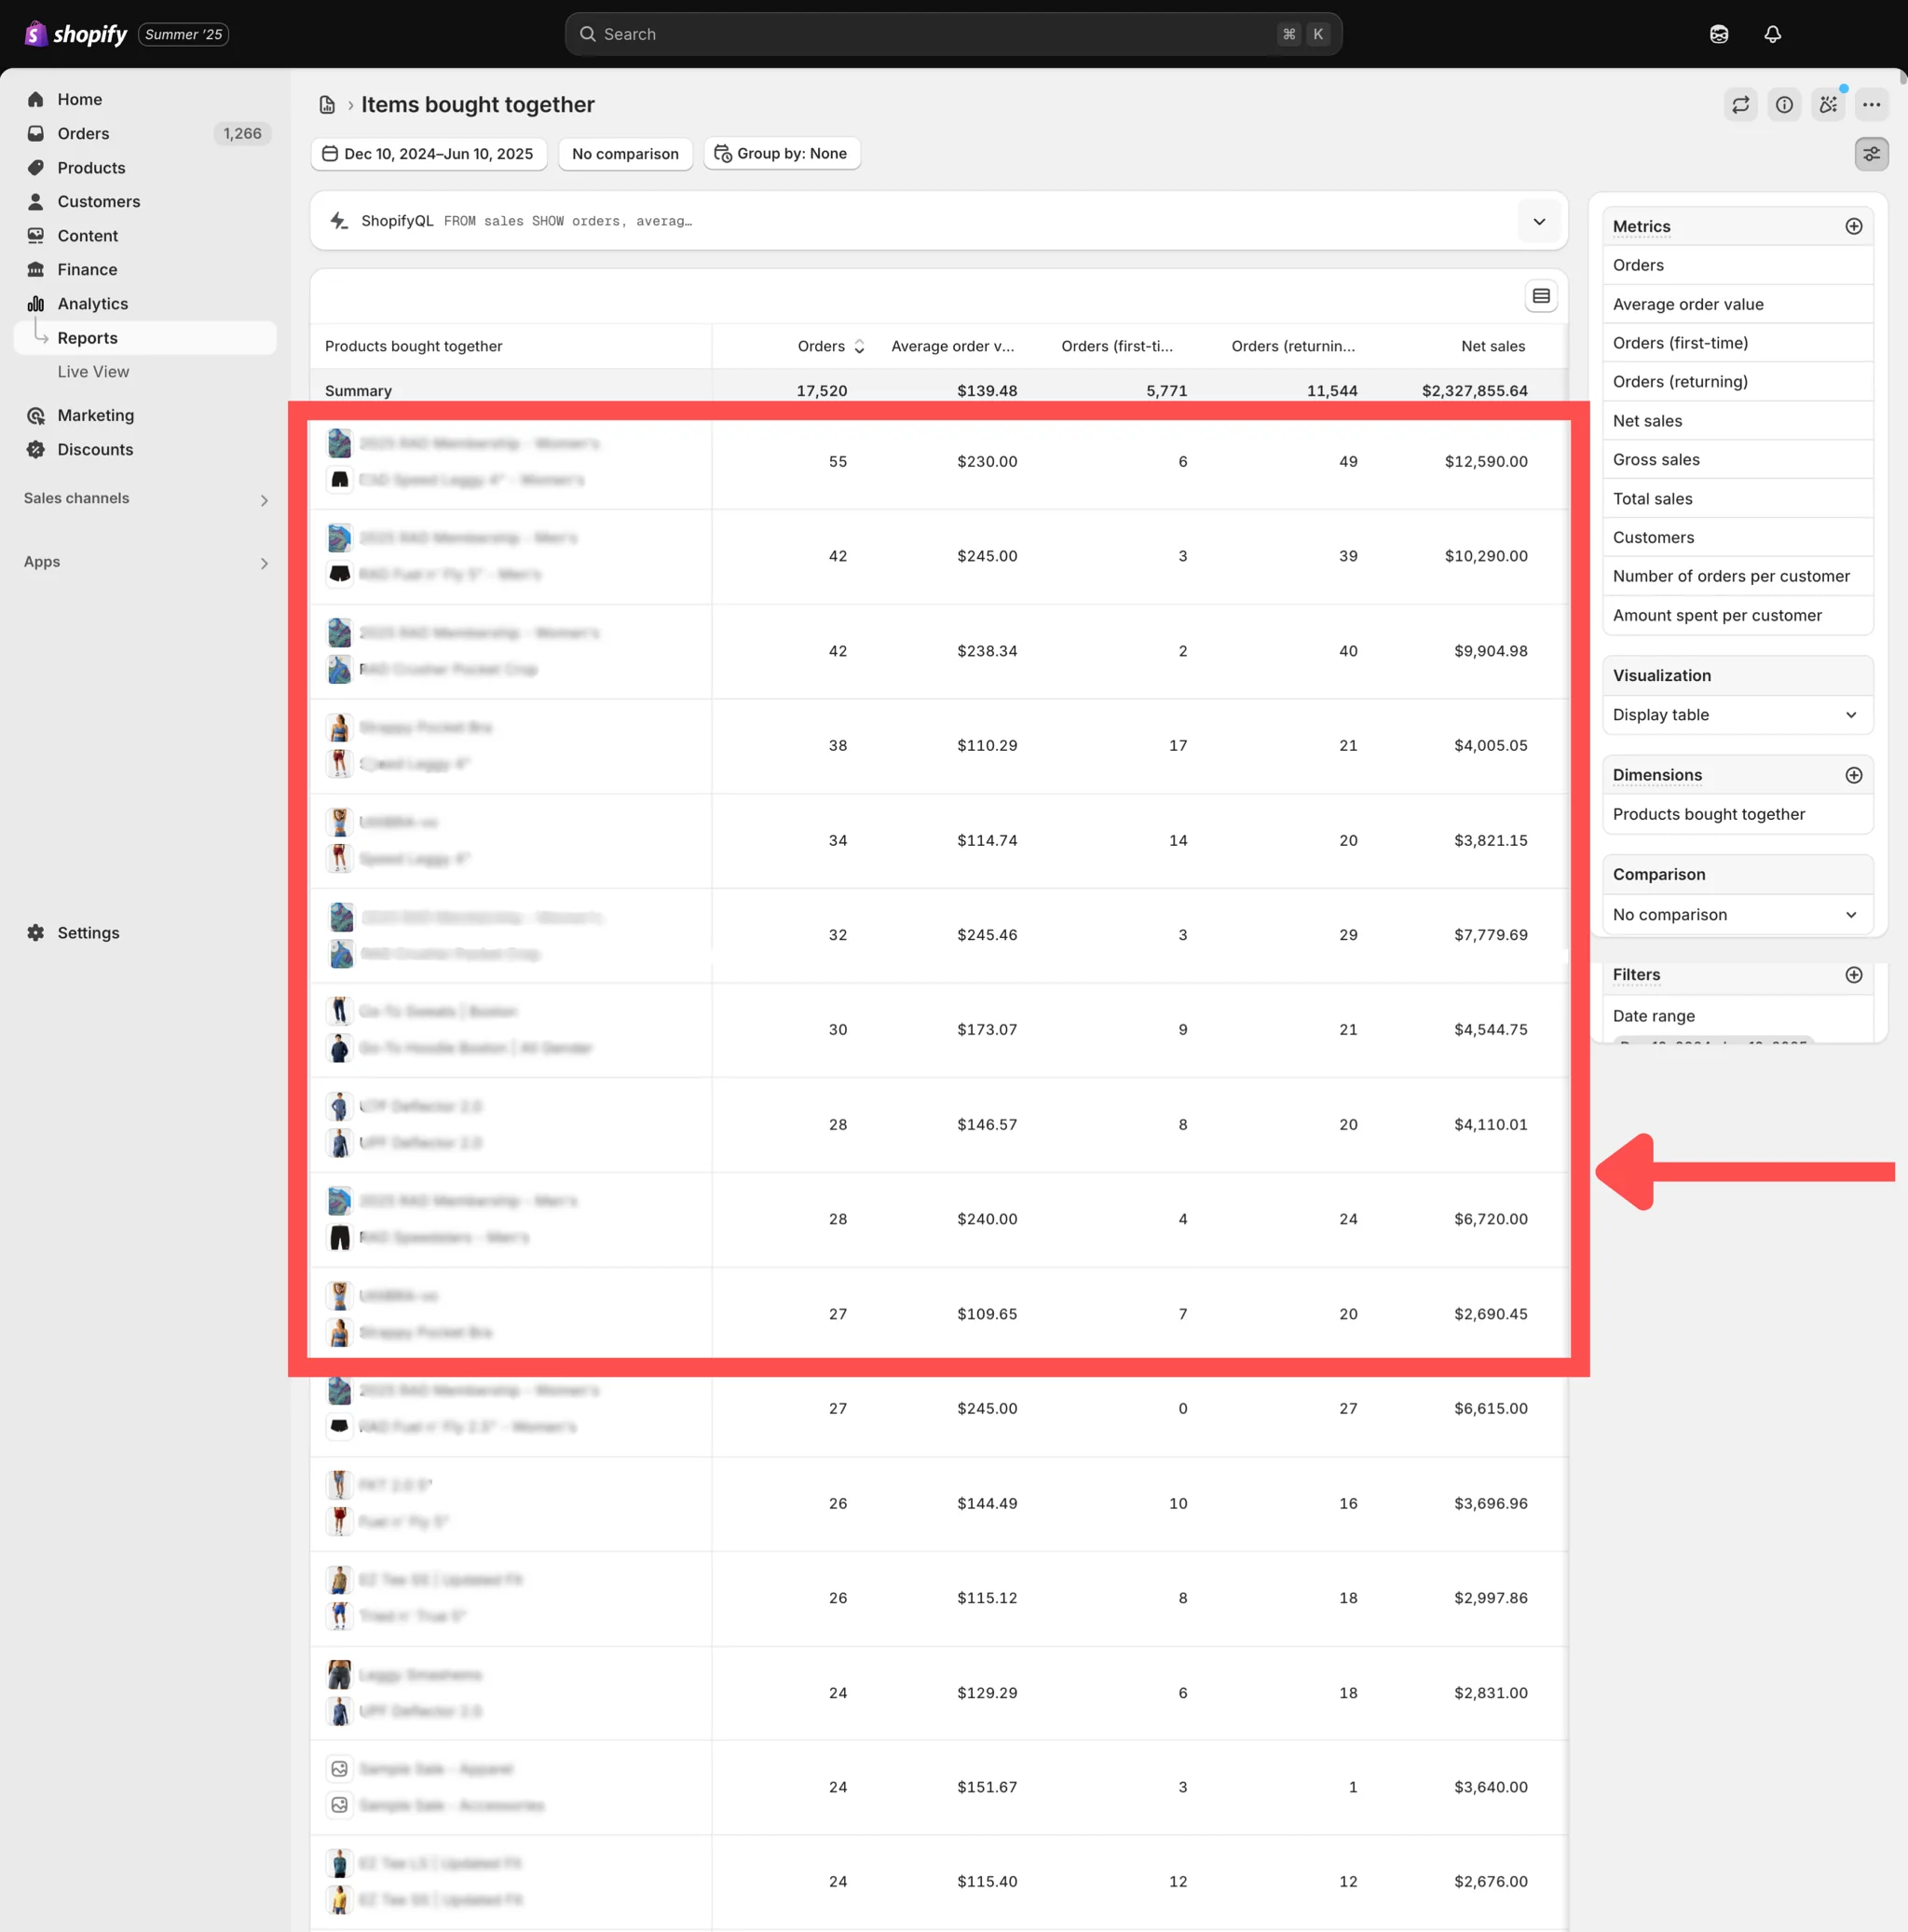
Shopify’s native Items bought together report provides a starting point for exploring product combinations from processed orders. The report supports product and variant views, along with combination-size filters. An extra app isn’t automatically necessary to find pairs; custom calculations may still require preparing and analysing product-level order data separately.
Start in Analytics → Reports and look for Items bought together. Consult Shopify’s order-report guidance for the current options.
Screenshot source: Blue Stout.
The report concerns processed orders, not products merely added to a cart, so it cannot describe abandoned-cart behaviour. Don’t assume its interface displays support, confidence, and lift just because it displays combinations.
For a separate calculation, export the relevant order data and group line items into their original orders. Shopify’s export documentation explains that multi-item orders can span several rows, with some order-level fields left blank on additional rows.
A CSV row isn’t necessarily a basket. Keep the order relationship intact before applying the formulas.
How can a product report help you explore a pairing?
A products-bought-together report can help identify combinations to inspect before deciding which deserve a test. The report’s population and definitions matter as much as its labels. Counts or rankings should not be treated as association-rule measures unless the product explicitly defines and supplies those calculations for the same set of orders.
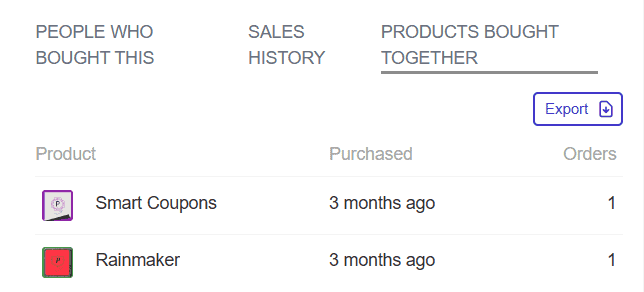
In Putler, product details includes Products Bought Together. The published product-metric definition says the frequently-bought-together metric uses all available data, so a date selection alone shouldn’t be taken as proof of a monthly calculation.
Screenshot source: Putler.
Use the report’s navigation guide to find the feature. Keep the support, confidence, and lift calculations in this article separate from what the report displays.
Which product pairing should you test first?
A sensible test candidate combines a credible purchase pattern with practical fit, available stock, and acceptable margin. The highest lift alone isn’t enough. Check whether a current promotion explains the pattern, define the proposed change, and agree on the outcome and comparison before showing the offer to customers.
Check whether the offer makes sense
Coffee and filters rank higher in the clean sample, but twenty fictional orders cannot justify a real campaign. For your own store, examine the pair count, the observation period, and whether the association holds beyond a temporary promotion.
Use these four checks before choosing an offer:
- Confirm the products work together and the add-on fits the buyer’s need.
- Check stock and fulfilment constraints so the offer can be delivered.
- Calculate margin after discounts and added costs.
- Review assess product performance so the pair isn’t judged in isolation.
Measure the result of one test
Choose one recommendation or limited offer. Define what success means before launch, such as more incremental contribution after discounts and fulfilment costs, rather than simply more units in the basket.
Use a controlled comparison where feasible. A before-and-after increase may reflect a holiday, price change, or different visitors rather than the offer itself.
For Shopify recommendations, check the Search & Discovery requirements, including theme and product eligibility, because those conditions determine whether shoppers can see the recommendation. Once an offer runs, measure a bundle after launch rather than treating the original association as its result.
FAQ
Is market basket analysis the same as association rule mining?
Market basket analysis is an application of association rule mining to items in transactions. Association rules describe relationships such as coffee → filters, using measures including support, confidence, and lift. The broader technique can be applied beyond retail purchases. Finding a rule describes an observed relationship; it doesn’t prove that one item causes another to be purchased.
What is the difference between confidence and lift?
Confidence measures how often B appears among baskets containing A. Lift compares that figure with B’s overall frequency. A common product can have high confidence simply because it appears in many orders. Lift adds the baseline comparison, but neither measure alone establishes reliability, causation, or whether a recommendation will make money.
Can Shopify show products bought together?
Yes. Shopify documents an Items bought together report based on processed orders, with product and variant dimensions and filters for combination size. Start with the native report before assuming another app is necessary. For a separate statistical analysis, prepare product-level order data and calculate the measures using consistent basket definitions and denominators.
How much order data do you need for market basket analysis?
There isn’t one minimum order count that makes every product pairing reliable. The evidence depends on individual product frequency, pair occurrences, seasonality, and the decision’s risk. A pair supported by only a few orders can produce unstable measures. The twenty-order example here explains the arithmetic; it isn’t a recommended sample size for commercial decisions.