


Revenue reporting presents defined revenue figures for a stated period so the people running a business can review performance and decide what needs attention. For an ecommerce store, a useful report names its sources, explains its figures, and reaches someone who can act on it.
The difficult part isn’t choosing a chart. It’s making sure this week’s report measures the same thing as last week’s, especially when orders, refunds, and payments live in different systems.
This guide gives you a sample weekly report, a preparation checklist, and practical sharing options. The sample figures are illustrative, not a customer result or a report generated by Putler.
What is revenue reporting for ecommerce?
Revenue reporting is the collection and presentation of an ecommerce business’s revenue figures over a defined period. A weekly operating report might show product sales, discounts, sales reversals, and the change from the previous week, with notes explaining what the figures include.
A report tells people what happened. Revenue analytics investigates why it happened, such as whether growth came from more orders or larger baskets. Keep detailed investigation linked to the report rather than adding every possible breakdown to its first page.
The reporting basis matters too. A store’s sales report, a payment processor’s balance report, and an accounting revenue-recognition report serve different purposes. Choose the figure needed for the decision instead of labelling all three as revenue.
What should your revenue report include?
Include the figures needed for the decision and enough context to reproduce them. The report specification should identify the audience, period, source accounts, definitions, and preparation rules. Without that context, a change in filters can look like a change in business performance.
Use this specification before building the report:
| Field | What to record | Why it matters |
|---|---|---|
| Purpose and audience | The question and people who will use the report | Keeps the report focused |
| Period and comparison | Exact dates and reporting timezone | Makes period comparisons reproducible |
| Included business | Stores and accounts included or excluded | Prevents scope changes going unnoticed |
| Currency | Reporting currency and any conversion method | Prevents unlike amounts being combined |
| Revenue basis | Included sales, discounts, reversals, tax, shipping, and fees | Makes the figure interpretable |
| Record rules | Order statuses, refund dates, test orders, and duplicate handling | Keeps detail and totals consistent |
| Preparation and delivery | Last refresh, owner, reviewer, recipients, and status | Shows whether the report is ready to use |
Don’t assume the word net has one meaning everywhere. Shopify’s sales definitions distinguish net sales from total sales, which can also include tax, shipping, duties, and fees. Its order-status rules also affect which records appear.
A metric name isn’t a complete definition. Write down the actual calculation and inclusion rules once, then use them consistently in each report.
Use this sample weekly revenue report
The following is a hypothetical operating report with invented figures. You can copy its structure into a document or spreadsheet you already use. It isn’t a native export, a real merchant’s results, or an accounting statement.
Set the report’s scope
For this example, the current period is 26 October to 1 November 2026 and the comparison is 19 to 25 October 2026. Both are complete seven-day periods.
The sample combines product sales from two illustrative stores, Store A and Store B. Both report in USD using UTC.
It counts paid orders placed in each week and excludes test and unpaid orders. It counts refunded product amounts on the date the refund was processed, including refunds for earlier orders; refunded tax and shipping are excluded. No other order adjustments occur, and matching payment processor transactions are not added as extra sales.
Gross product sales exclude tax and shipping. These assumptions describe this sample, not every platform’s default report.
Present the figures
| Measure | Current week | Previous week | Calculation or basis |
|---|---|---|---|
| Gross product sales | $50,000 | $46,000 | Before discounts and refunds |
| Discounts | $2,000 | $1,500 | Reductions recorded in the sales figures |
| Sales reversals | $3,000 | $2,500 | Refund reductions under the stated period rules |
| Net sales | $45,000 | $42,000 | Gross product sales minus discounts and reversals |
Current net sales are $50,000 - $2,000 - $3,000 = $45,000. The previous week’s $46,000 - $1,500 - $2,500 gives $42,000.
The increase is $3,000. Dividing that by the previous $42,000 gives 7.14% growth, rounded to two decimal places. Neither the net-sales figure nor its growth rate measures profit or money deposited into a bank account.
If a comparison period has zero revenue, report the absolute change instead of dividing by zero to produce a percentage.
Add the handoff
Numbers become useful when someone knows what to do with them. Alongside the sample table, include these fields:
- Prepared by: Operations lead.
- Reviewed by: Finance lead.
- Recipients: Business owner and the team responsible for the next decision.
- Data refreshed through: Replace with the actual source-sync time.
- Report status: Draft, provisional, or approved.
- Exception note: Describe any missing source, unresolved records, or definition change.
- Next action: Assign a task, an owner, and a review date.
These are suggested roles and fields, not a claim about a particular team. For the hypothetical report, a next action could be to investigate the increase in refunds before the next weekly review. Keep the underlying order list available so the reviewer can check that question.
How do you prepare and check a revenue report?
Prepare a revenue report by fixing its scope, collecting matching records, applying consistent definitions, checking exceptions, and getting a reviewer to approve the version you share. Repeat the same process each period so changes in preparation don’t get mistaken for sales trends.
1. Choose the audience and period
Start with the decision. An owner reviewing weekly trading needs a different level of detail from someone reconciling payment settlements.
Select complete periods where possible. If you compare a partial month with a complete month, label the difference clearly; the total can change simply because the periods contain different numbers of selling days.
2. Gather matching records
List the stores and accounts in scope, then collect the relevant records for the chosen dates. Record the export or refresh time so a reviewer can distinguish a missing transaction from a source that hasn’t finished syncing.
When several systems describe the same sale, define how you match or exclude related records. Our data consolidation guide explains why combining sources requires more care than adding their totals.
3. Apply the same definitions
Use the saved report specification for both periods. Check order statuses, refunds, tax, shipping, fees, timezone, and currency conversion rather than relying on similarly named fields.
Stripe’s reporting documentation separates balance reports, payout reconciliation, and revenue recognition. Use the appropriate output for each task. A payout delay shouldn’t automatically become a fall in the store’s reported sales.
4. Check totals and exceptions
Recalculate the main total and follow representative sales and refunds back to their source records. Confirm that your detailed export uses the same filters and reporting basis as the summary you intend to share.
Watch for these four problems:
- Missing stores or payment accounts change the report’s coverage.
- Refunds are compared using different date rules.
- An export contains only part of the requested records.
- A source refresh or definition change affects the comparison.
If an unresolved issue could materially change the total, mark the report provisional and explain what remains unchecked. An empty exception note shouldn’t stand in for a completed check.
5. Review and share
Give the reviewer the report, its scope, and the supporting data. Save the approved version with a clear period label so recipients aren’t comparing different drafts.
Include a short message naming the main change, any open issue, and the next action. For deeper interpretation, link the relevant analysis rather than sending every recipient a large collection of exports.
How often should you share the report?
Match the reporting schedule to how quickly someone needs to make a decision. Daily checks can catch operating issues, weekly reports can support trading reviews, and monthly reports can provide a broader comparison. These are suggested starting points, not a rule for every store.
| Cadence | Useful focus | Suggested recipient |
|---|---|---|
| Daily | Unusual sales movement or incomplete source updates | Person responsible for daily operations |
| Weekly | Completed-period totals and agreed follow-up actions | Owner and relevant operating leads |
| Monthly | Longer-term comparisons and recurring exceptions | Leadership and finance reviewers |
Shopify’s reporting guide also recommends matching cadence to the metric and assigning responsibility for it. A faster report isn’t automatically more useful if nobody has time or authority to respond.
Choose a regular delivery time after the necessary data has arrived. When a source is late, send a clearly marked provisional report or explain the delay rather than silently changing the cutoff.
How can you reduce manual report preparation?
Use a consistent reporting source and saved preparation rules to reduce repetitive work. Putler can help gather connected sales and customer data, but the sample report above is a layout you assemble for your own reporting question, not a promise of an identical native report.
Export the records you need
Putler’s export documentation describes CSV list exports from Sales, Products, Transactions, and Customers. Export the relevant list, then check its rows and date coverage against the report specification.
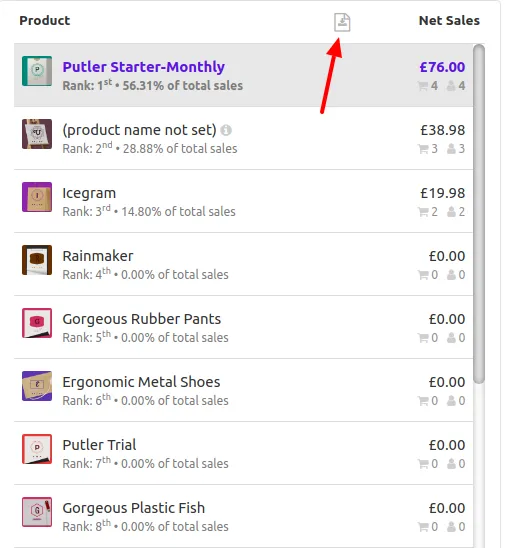
The documented export limit is 10,000 rows per report. Larger exports need to be split into smaller parts, with the combined set checked for gaps and overlap.
The documentation also states that graphs and KPI cards can’t be exported. Plan how you’ll record the required summary figures; don’t assume downloading a list creates a complete dashboard PDF.
Use the weekly summary where it fits
Putler also documents weekly summary emails, with an address field that can include multiple recipients. That can suit a standard weekly digest, while your own report may still need separate commentary, checks, and approval.
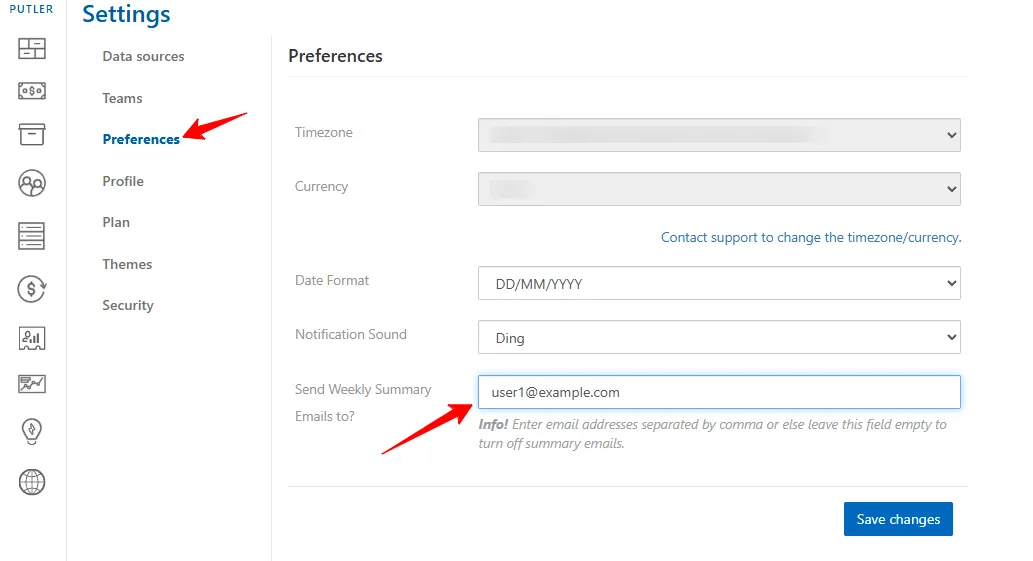
See the weekly summary setup instructions for the documented configuration. This doesn’t establish custom monthly scheduling, PDF attachments, or automatic delivery of the report template in this guide.
Make the next report easier to trust
Choose one recurring revenue report, save its definitions, and assign someone to review it before delivery. Start with the period, source coverage, and main figure; add detail only when it helps the recipient make a decision.
For the next cycle, retain the approved version and its exception notes. That makes it easier to distinguish a business change from a change in how the report was prepared.
Frequently asked questions
What should an ecommerce revenue report include?
Include the reporting period, comparison period, source accounts, currency, revenue definition, and the figures needed for the decision. Add the data-refresh time, report owner, reviewer, exceptions, and next action. Keep supporting records available so the totals can be checked without making the main report difficult to read.
How is revenue reporting different from revenue analytics?
Revenue reporting presents defined figures for a period, while revenue analytics investigates what explains them. A weekly report might show higher net sales; analysis might examine order volume, basket value, customer mix, or refunds. Link the investigation to the report so recipients can understand the explanation without losing the agreed reporting basis.
Should a revenue report match bank payouts?
Not automatically. Sales, captured payments, and payouts can use different dates and include different adjustments. Identify what each report measures before comparing its total. Use payment and payout reconciliation for the relevant cash movements, while keeping the operating sales report’s definitions and periods consistent.
Can one revenue report cover multiple stores?
Yes, if the report identifies the stores included and applies compatible definitions, periods, currencies, and record-handling rules. Combine related records carefully so a storefront sale and its payment aren’t added as two separate sales. Check each source and document missing or incomplete data before sharing the consolidated report.