
If you run a subscription business and looking for analytics, you’ll find Baremetrics, ChartMogul, ProfitWell. They track MRR, churn, LTV beautifully. But they only track subscriptions.
Your one-time sales? Invisible. Your product leaderboard? Doesn’t exist. Your customer profiles beyond subscriber data? Not their job.
If you run an eCommerce store and looking for analytics, you’ll find Triple Whale, Shopify Analytics, Metorik. They handle products, orders, and customer data.
But ask them for your MRR breakdown or churn rate and you get a blank stare. And most of them are locked to one platform.
What you actually need is a proper SaaS metrics dashboard that doesn’t force you to leave your eCommerce data behind. Putler was built for exactly this gap.
Let’s walk through what that actually looks like.
A dedicated SaaS metrics dashboard: not a bolt-on, a full SaaS engine
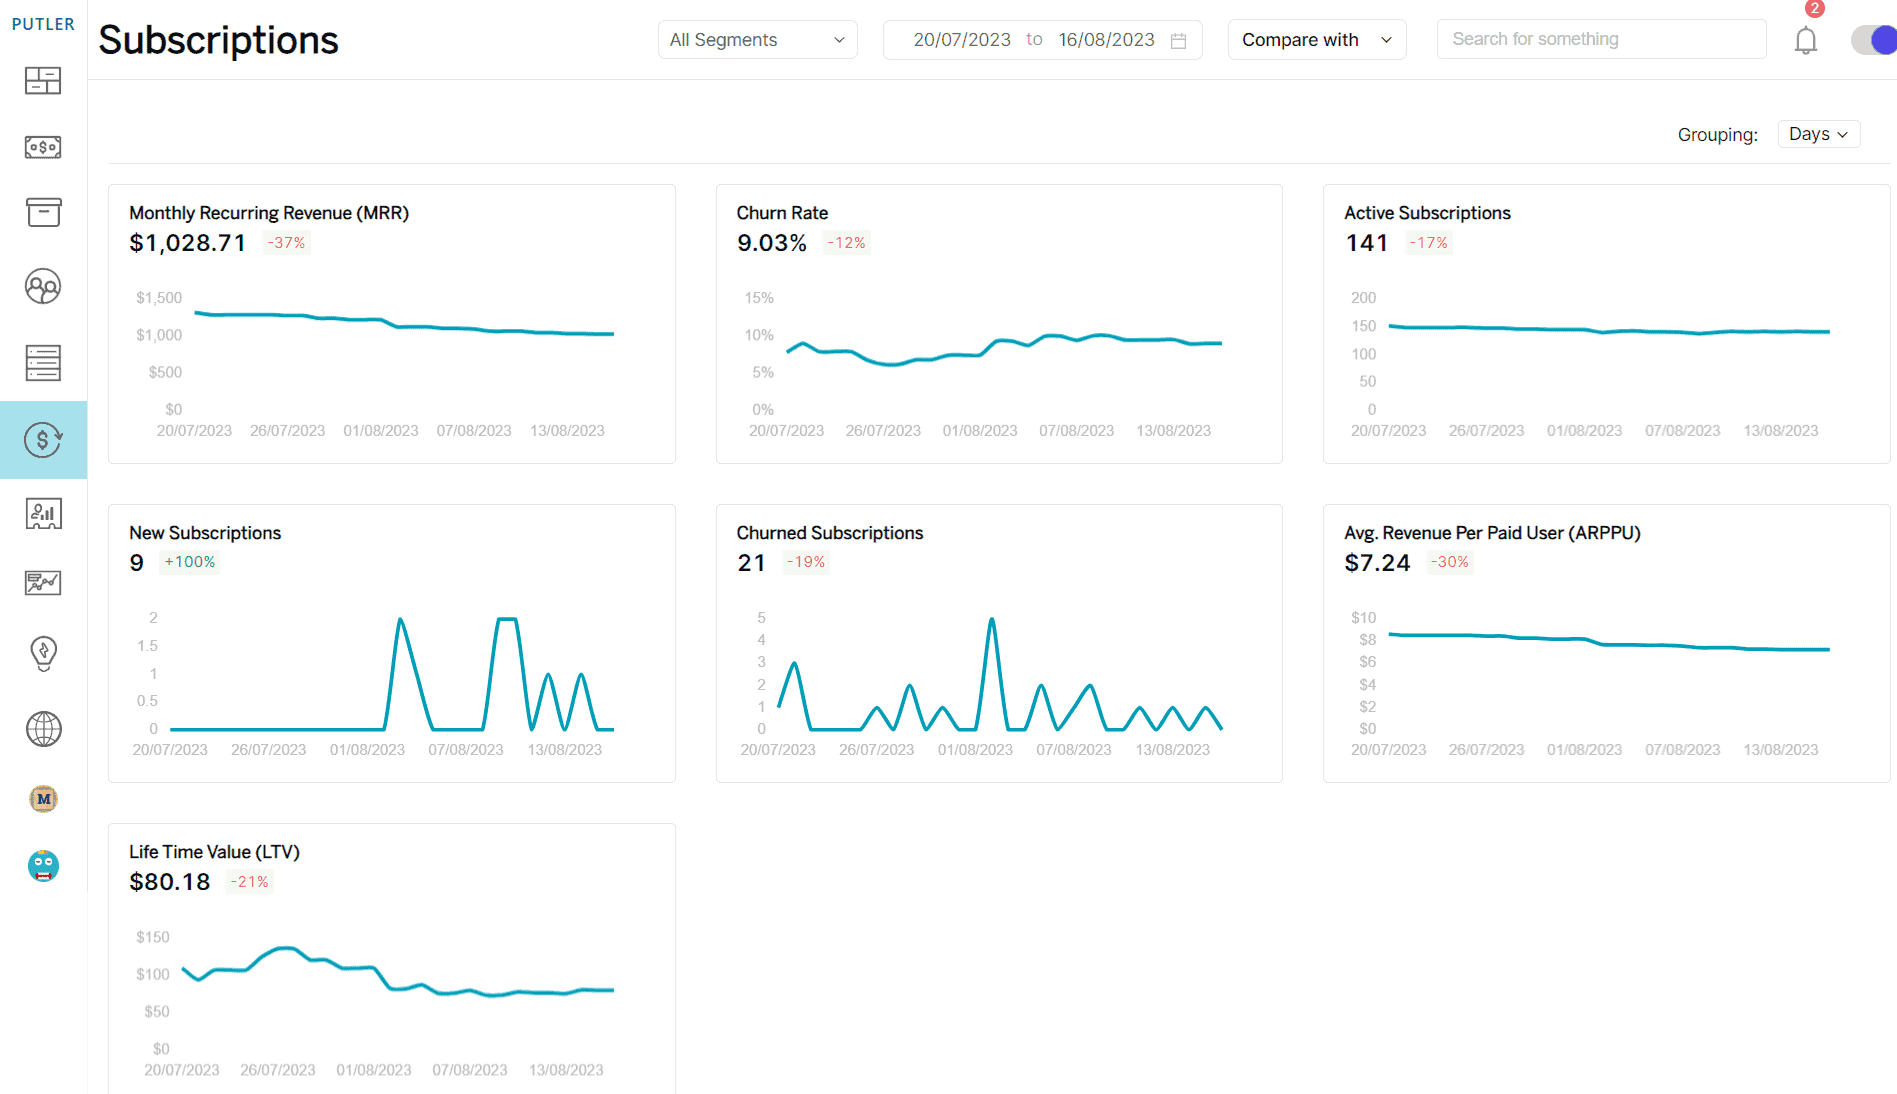
Most eCommerce tools treat subscriptions as an afterthought. Maybe you get a basic MRR number somewhere in the sales report. Putler gives you an entire dashboard built specifically for recurring revenue.
It supports subscription data from Stripe, WooCommerce, Easy Digital Downloads, Braintree, Authorize.Net, and Putler’s Inbound API (which lets you push data from any custom platform). You can group everything by days, months, or years.
Here’s what you get:
MRR (Monthly Recurring Revenue): Putler calculates Net MRR by accounting for current MRR from active subscriptions, plus New MRR from customers acquired in the period, plus Expansion MRR from upgrades and upsells, minus Churned MRR from cancellations and downgrades.
You see exactly where your recurring revenue is growing and where it’s leaking. Refunds are tracked separately and don’t distort your MRR figure.
ARR (Annual Recurring Revenue): Derived automatically from your MRR. No manual calculation needed.
User churn rate: The percentage of paying customers who cancelled in the last 30 days relative to your active paying customers 30 days ago.
If you had 200 paying customers a month ago and lost 10, your churn rate is 5%. This is the number that tells you whether your growth is real or whether you’re filling a leaky bucket.
Revenue churn rate: Similar formula but applied to MRR, not headcount. You might lose 10 customers but if they were all on your cheapest plan, your revenue churn is lower than your user churn. Or the reverse. Both numbers matter, and Putler shows both.
User growth rate: Percentage of new paying customers gained in the last 30 days. When this number is higher than your churn rate, your subscriber base is growing. When it’s not, you have a problem the top-line revenue might be hiding.
Active subscriptions: The total count of unique subscriptions, excluding cancelled or non-converted trials. This is your real subscriber base, not inflated by dead trials.
New subscriptions: How many new paying subscribers you gained in your selected date range. Useful for measuring the impact of a campaign, a pricing change, or a product launch.
Churned subscriptions: Customers who discontinued in the period. Putler tracks this separately so you can segment churned subscribers, understand patterns, and build retention strategies around what you find.
ARPPU (Average Revenue Per Paying User): Your MRR divided by active paying customers. If your MRR is $10,000 from 100 paying customers, your ARPPU is $100.
Track this over time to see if pricing changes, upsells, or plan restructuring are actually moving the needle.
LTV (Lifetime Value): Calculated as average recurring revenue per user divided by user churn rate.
This is the number that tells you how much a customer is worth over their entire relationship with your business. Compare it to your acquisition cost and you know if your growth is profitable or just expensive.
All of these metrics are viewable by days, months, or years. You can track trends, spot seasonality in churn, and compare periods to see if your retention efforts are working.
SaaS metrics don’t stay locked in one dashboard
Here’s something the subscription-only tools can’t do: Putler surfaces key SaaS metrics across your other dashboards too, so you don’t have to switch screens to see the full picture.
On the Sales Dashboard: MRR, churn rate, and active subscriptions appear alongside your net sales, daily average, orders, and average revenue per sale.
If you sell both one-time products and subscriptions, you see both revenue streams on the same screen. The sales heatmap, order list, and transaction details work for all your revenue, not just one type.
On the Home Dashboard: Your subscription health (MRR, churn, active subscriptions) shows up in the overview section alongside your total sales, forecasts, and top 20% customers and products.
One glance tells you how both sides of your business are doing.
On the Customers Dashboard: Customer profiles include both subscription history and one-time purchase data.
A customer who subscribes to your SaaS plan and also bought a one-time product shows both on the same profile card.
RFM segmentation works across all revenue types, so a “Champion” customer might be someone with high subscription tenure and frequent one-time purchases.
On the Time Machine: Revenue forecasting uses your full revenue picture, including recurring and one-time, to project 12 months ahead. Customer forecasting accounts for both subscriber growth and one-time buyer acquisition.
This is the part that matters for mixed businesses. Your SaaS metrics dashboard isn’t siloed while your eCommerce metrics live somewhere else. They flow together because your business works that way.
What the alternatives actually offer (and what they don’t)
Baremetrics and ChartMogul: Excellent for pure SaaS. MRR, churn, ARR, LTV, cohort analysis. But if you sell anything that isn’t a subscription, it doesn’t exist in their world.
No product leaderboards, no sales heatmaps, no RFM segmentation, no enriched customer profiles with purchase history. Baremetrics starts around $108/month at $10K MRR. ChartMogul is free up to $120K ARR, then $99+.
Triple Whale: Powerful for Shopify DTC brands with heavy ad spend. Attribution, creative analytics, AI insights. But Shopify-only. No WooCommerce, no multi-platform, and no SaaS metrics dashboard layer.
Shopify Analytics: Free with your plan but advanced reports are locked behind expensive tiers. Shopify-only. No subscription metrics.
Google Analytics: Tracks traffic, not revenue. No customer profiles, no subscription metrics, no product intelligence.
Each tool is strong in its lane. None of them handle both subscriptions and eCommerce across multiple platforms.
What makes Putler different for mixed businesses
Full SaaS metrics dashboard: A dedicated Subscriptions Dashboard with MRR, churn (user + revenue), LTV, ARPPU, ARR, active subscriptions, new and churned subscriber tracking, upgrades and downgrades. Not a widget. A complete dashboard.
SaaS metrics across all dashboards: MRR and churn on the Sales Dashboard, subscription health on Home, subscription + one-time history on customer profiles, full revenue forecasting on Time Machine.
Full eCommerce alongside it: Product leaderboards, 80/20 analysis, sales heatmaps, enriched customer profiles, RFM segmentation, transaction tracking with fees and taxes, audience analytics tied to revenue. Everything subscription tools leave out.
17+ integrations: Shopify, WooCommerce, BigCommerce, EDD, eBay, Etsy, PayPal, Stripe, Razorpay, Braintree, Authorize.Net, Google Analytics, plus Inbound API for custom platforms. No platform lock-in.
Data cleaning: Currency conversion across 36+ currencies, timezone normalization, deduplication, orphaned transaction cleanup. Accurate numbers because the data was cleaned before it reached the dashboard.
Unlimited team members: Admin, Support, and Analyst roles. No per-seat charge.
Pricing from $20/month: Starter at $20/month for businesses under $10K monthly revenue. Growth from $50/month.
The bottom line
Subscription tools ignore your eCommerce revenue. eCommerce tools ignore your subscriptions. Platform tools lock you to one platform.
Putler doesn’t ask you to pick a lane. A dedicated SaaS metrics dashboard handles MRR, churn, LTV, ARPPU, and every metric your recurring revenue needs. And those metrics flow across your Sales, Home, and Customer dashboards so you see one-time and recurring revenue together.
That’s not a feature comparison. It’s a fundamentally different approach to analytics for businesses that don’t fit one category.
- Customer Profiles: How to Know Everything About Every Customer with Putler
- eCommerce Transaction Management: One Dashboard for Every Payment, Refund, and Report
- Your eCommerce Dashboard: One Screen to Replace Five Tabs and Thirty Minutes
- eCommerce Data Consolidation: How Putler Connects and Cleans Data from 17+ Sources
- eCommerce Web Analytics: How to Finally Connect Your Traffic to Real Revenue