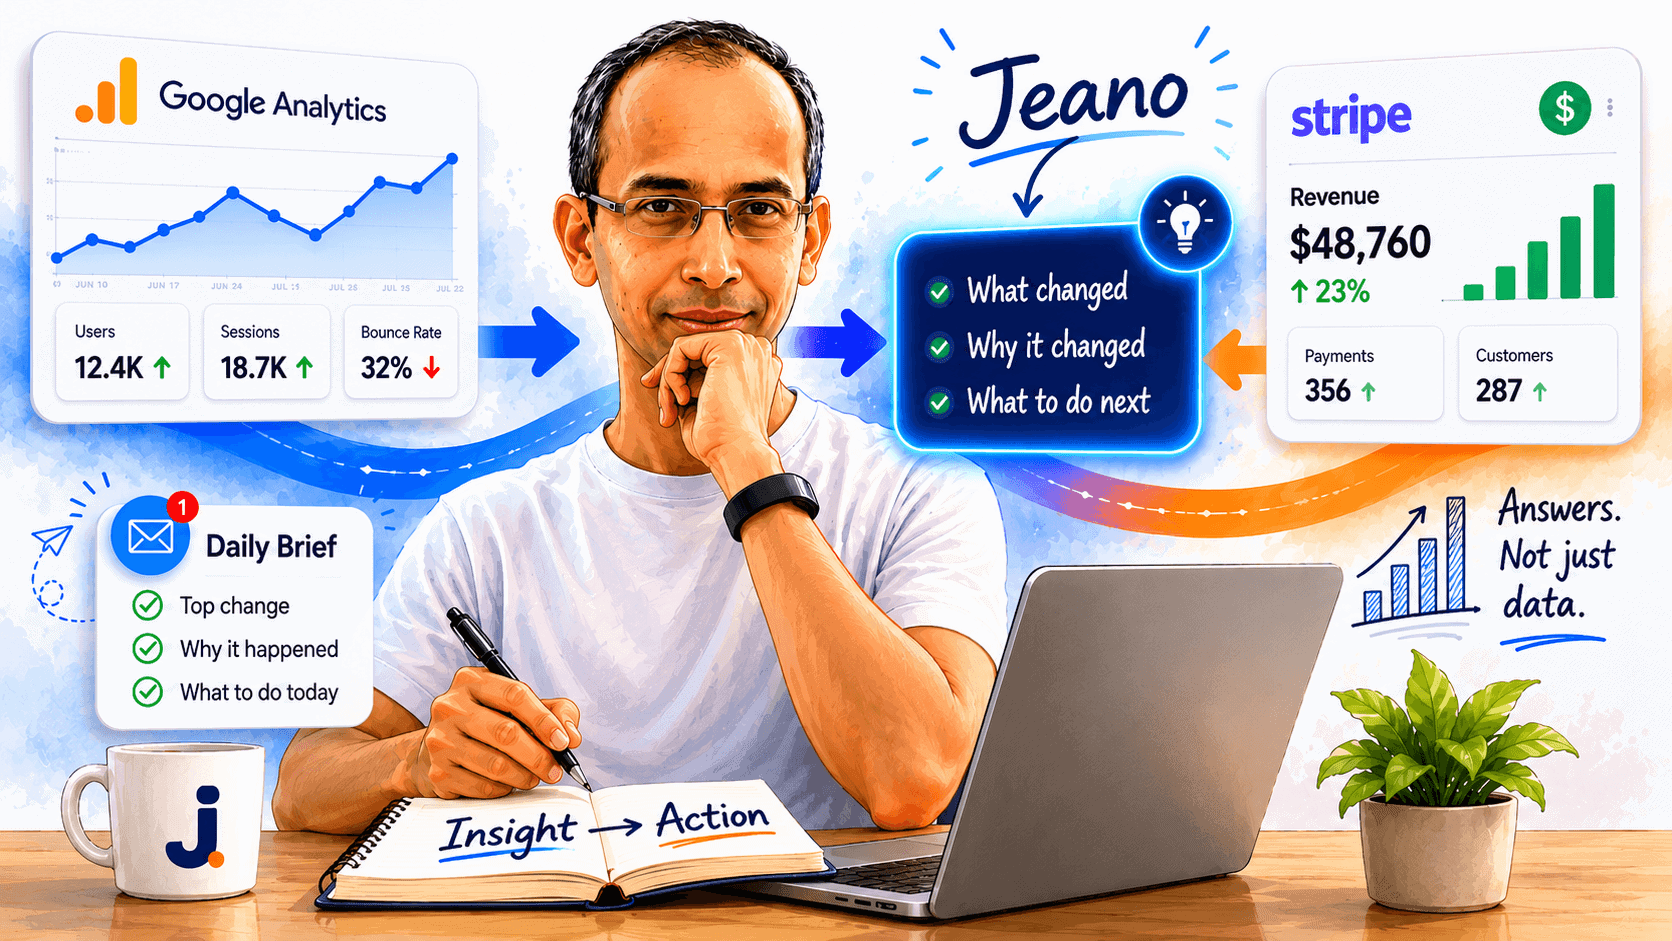
Analytics for Founders That Tells You What to Do Next
You should not have to be an analyst to understand your own business. So I stopped opening dashboards that hand me data and no answers, and built the thing that hands me the decision instead.
You should not have to be an analyst to understand your own business. So I stopped opening dashboards that hand me data and no answers, and built the thing that hands me the decision instead.
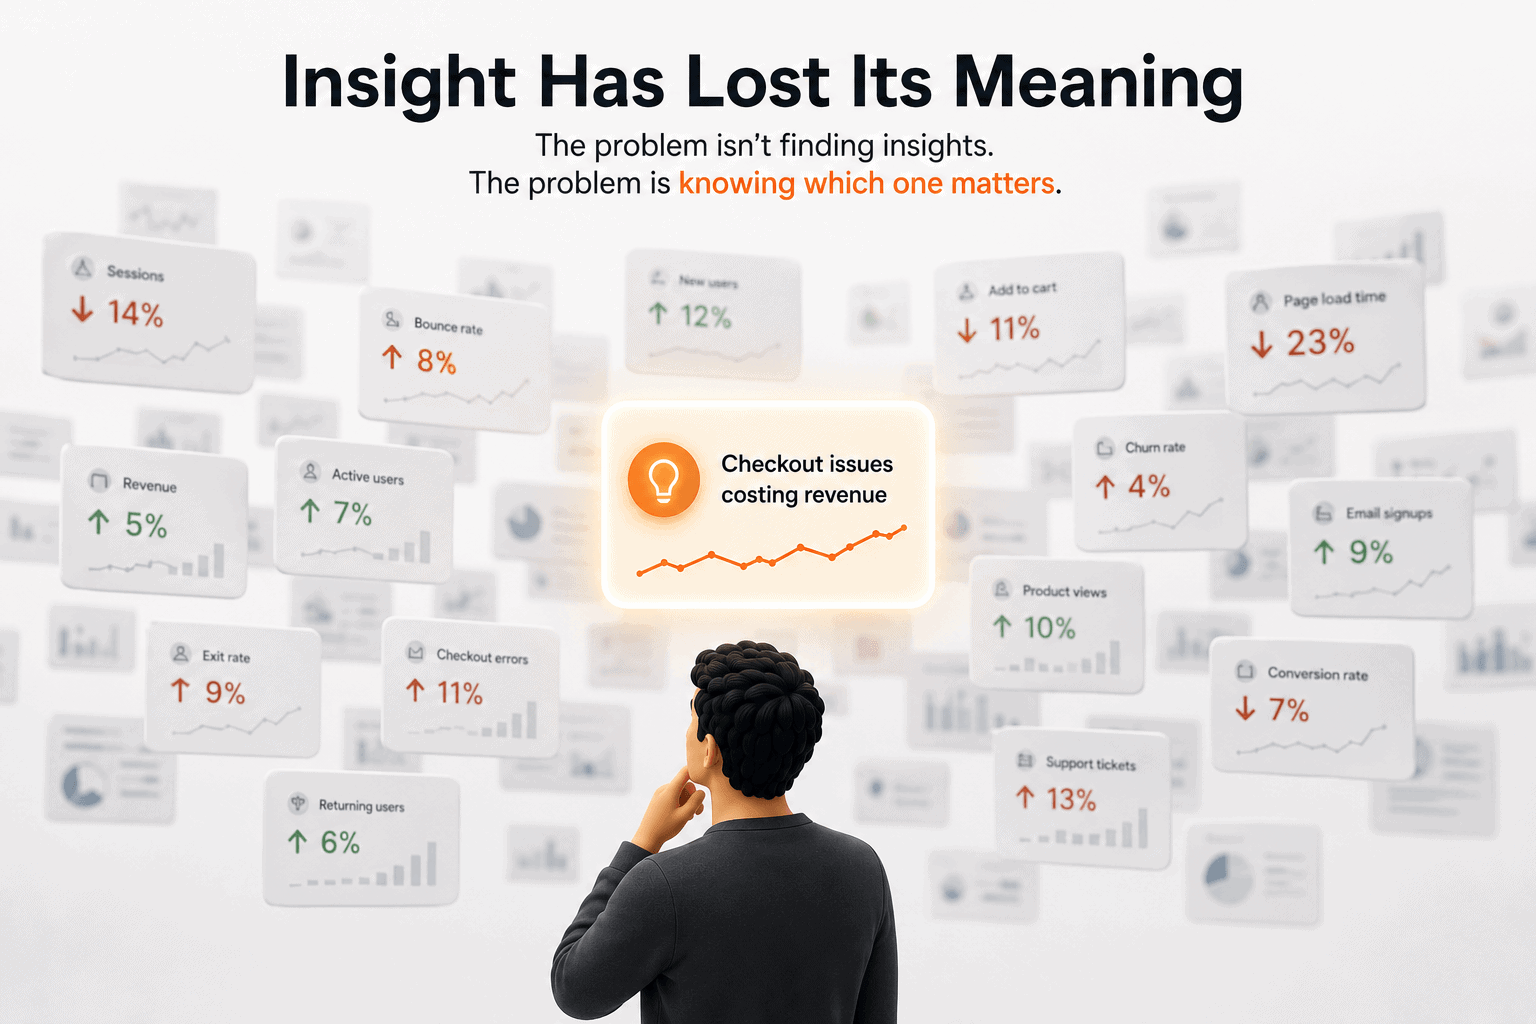
Anyone can generate a thousand insights. The skill is deciding which one you say out loud. Why most analytics tools narrate your data and never decide.
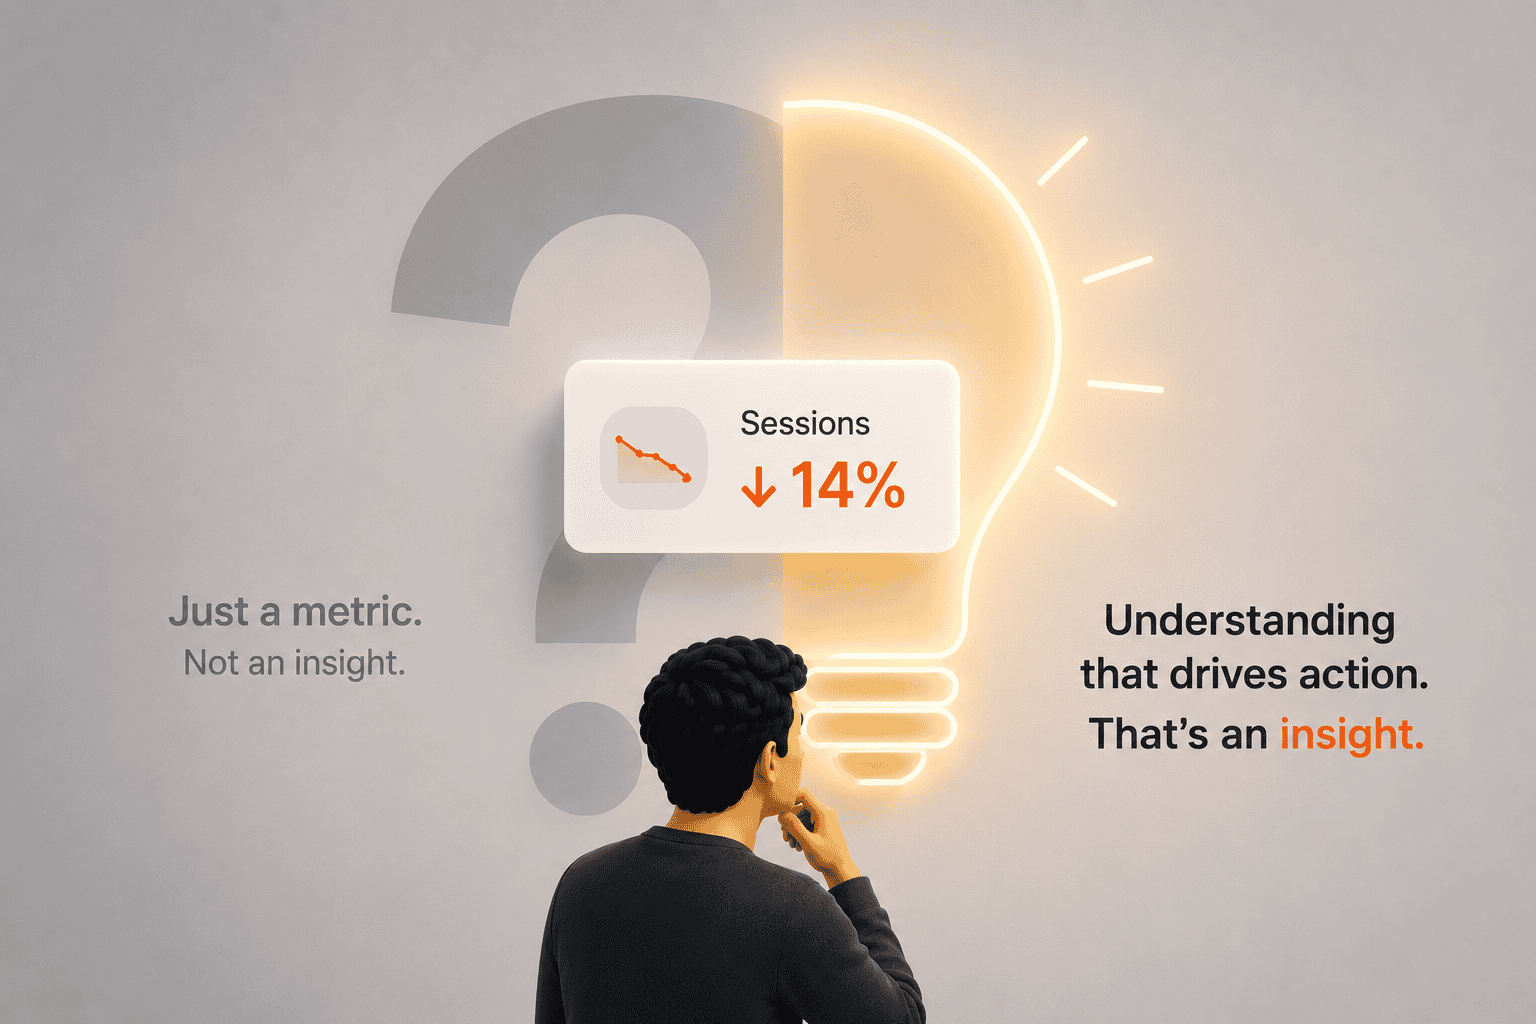
An anomaly alert is called an insight. A percentage change on a chart is called an insight. When a word means everything, it means nothing.

Setting up Authorize.Net on WooCommerce is the easy part. Real reporting takes more than a daily CSV. Here is how to get from payments to actionable analytics.

Duplicate payments cost businesses up to 2% of total disbursements every year. Here’s what causes them and five proven fixes to stop them before they happen.
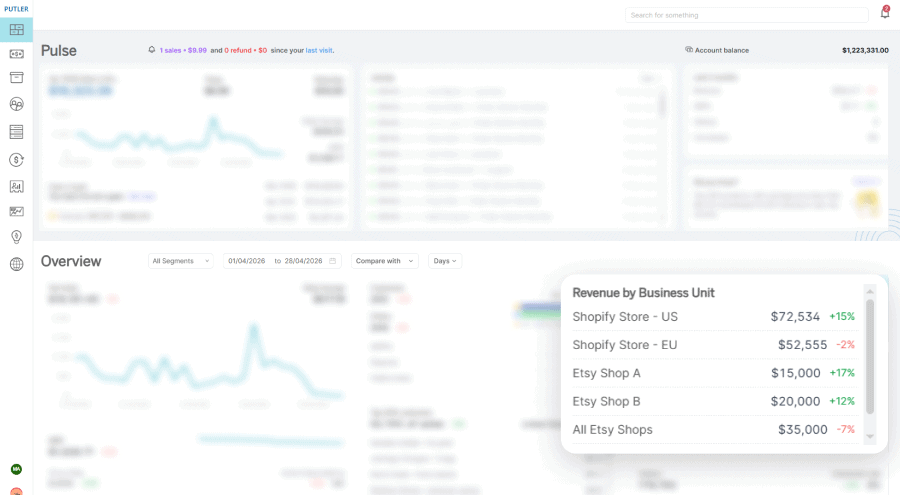
See revenue from every team in one view with Revenue by Business Unit. Compare stores, brands, or regions at a glance without switching teams.

Shopify analytics look complete until you ask harder questions. Here are every significant gap, what the 2025 updates did and did not fix, and how to fill what Shopify leaves out.

Stripe, Shopify, PayPal, all showing different numbers. Putler’s eCommerce data consolidation connects 17+ sources and cleans everything automatically so you finally trust your data.

Selling subscriptions and one-time products? See how a proper SaaS metrics dashboard tracks MRR, churn, LTV and eCommerce revenue without switching tools.
20% of your products generate 80% of your revenue. Putler’s products dashboard shows you exactly which ones. Plus refund rates, bundle opportunities, and variation data.