The word insight has been quietly drained of meaning.
An anomaly alert is called an insight. A percentage change on a chart card is called an insight. An AI-generated summary of last week’s traffic is called an insight.
The little box in your dashboard with a green or red arrow next to a number is, somehow, also called an insight.
When a word means everything, it means nothing.
So, what makes an analytics insight actually useful?
A real insight is something specific. It does four particular things. Miss any one of them and what you have is not an insight. It is a notification in fancier clothing.
What an insight actually looks like
Here is the same finding, told two ways.
The first way is what you get from a modern analytics dashboard.
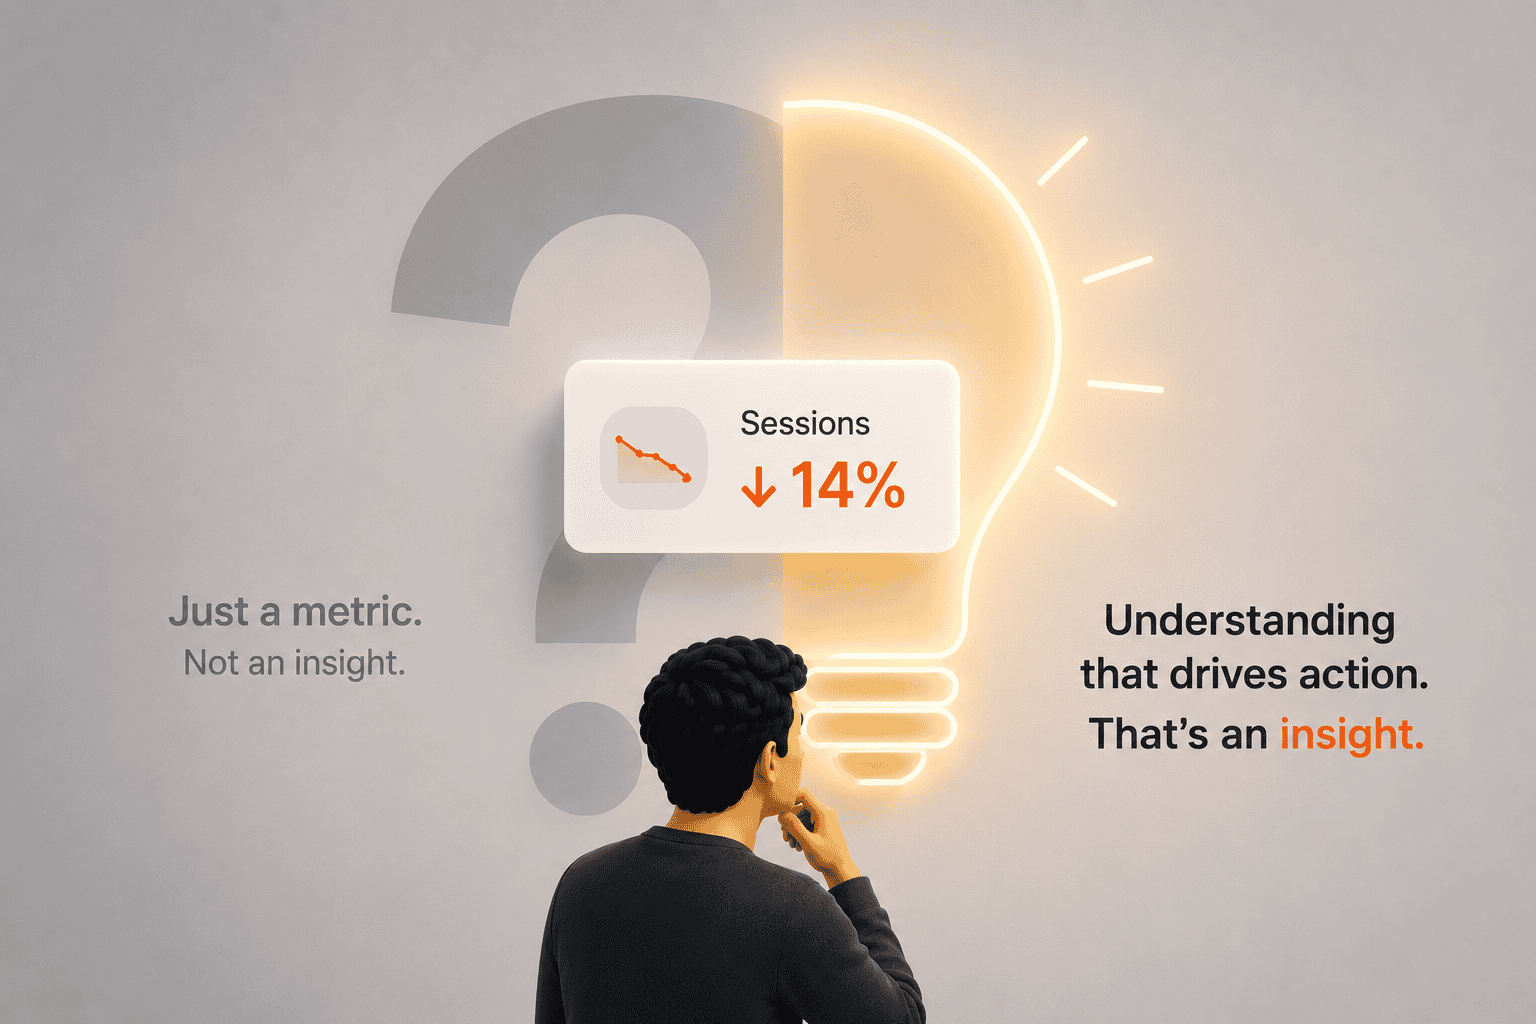
Sessions in the United States dropped 14% compared to the expected range.
That is the entire output. Eleven words, one number, no context, no cause, no consequence, no recommendation. You read it, you nod, you close the tab, and the insight has done none of the work an insight is supposed to do.
Now here is the same finding, written as a real insight.
Sessions in the US dropped 14% last week. The Meta retargeting campaign was paused on Thursday after a billing failure, and the drop began that same evening. If the campaign stays paused for the next two weeks, you will lose roughly $8,400 in new-customer revenue. Restart the campaign Monday morning, and audit your billing alert settings so this doesn’t happen again.
The first one is data. The second one is an insight.
The difference is not the writing. It is the work behind the writing. The first version surfaced a number. The second version did the diagnostic work, the consequence math, and the editorial commitment that turn a number into a decision.
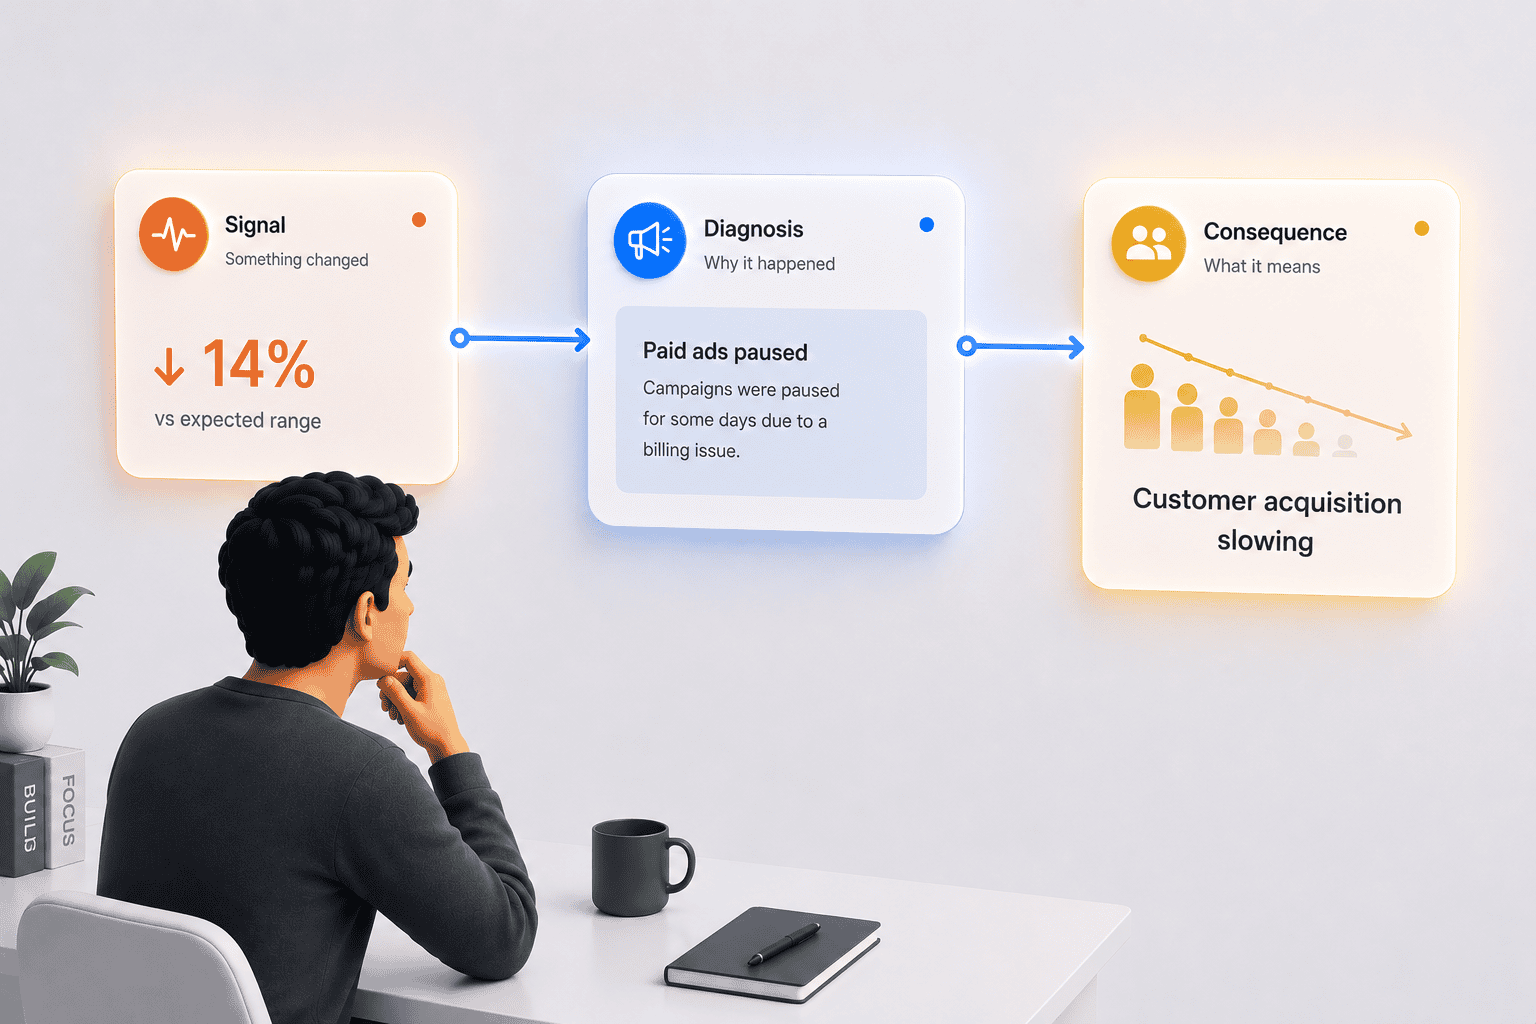
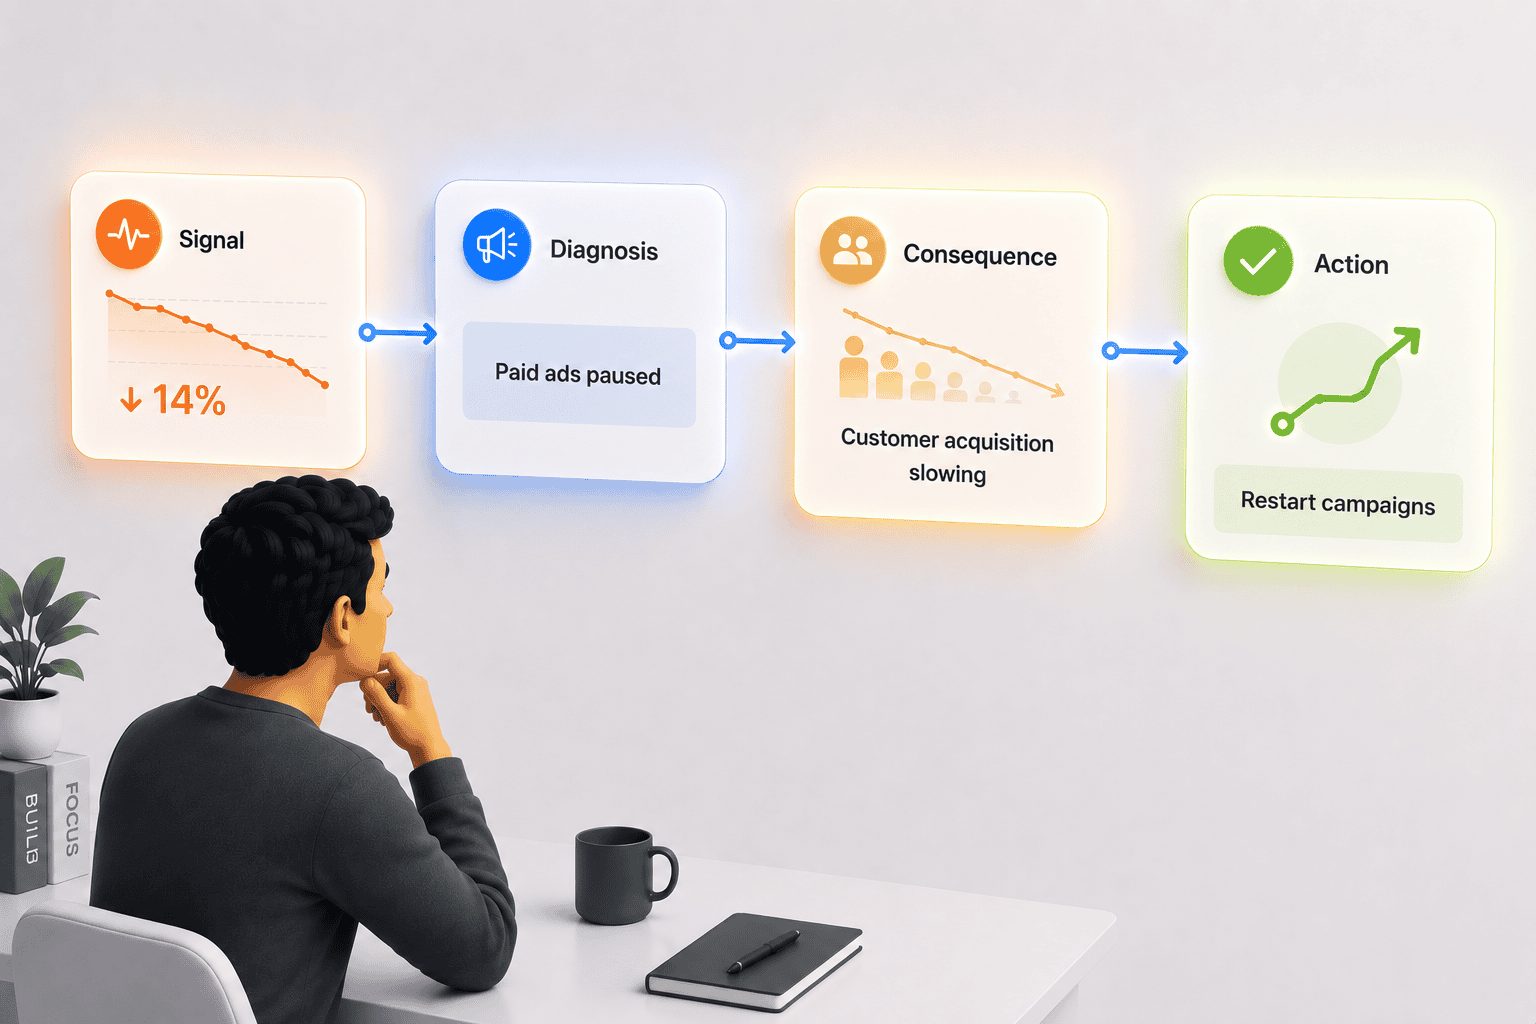
What separates them is four parts. Signal. Diagnosis. Consequence. Action.
Every real insight has all four. Most things called insights today have only the first.
The four parts of a real insight
A signal without a diagnosis is an alarm. A diagnosis without a consequence is trivia. A consequence without an action is editorial. They depend on each other.
Here is what each one actually means.
1. Signal: something moved, and it is worth your attention
The first job of an insight is to surface something that changed.
Most analytics tools have this part figured out. They will flag a 14% drop, a 30% rise, a sudden spike in cart abandonment. The hard part is not detecting the change. The hard part is deciding whether the change matters.
A 14% drop on a Tuesday could be a four-alarm fire. It could also be normal noise for that day of the week, in that channel, for your size of business.
A real signal answers three things at once:
- What metric moved
- How much it moved
- Whether the size of the move is unusual for your specific business
The third one is what most tools skip. They treat your business the same as every other business they have ever seen data from. Which means they flag changes that don’t matter to you, and miss the ones that do.
A signal that doesn’t account for your baseline is just an alarm clock that goes off at random times.
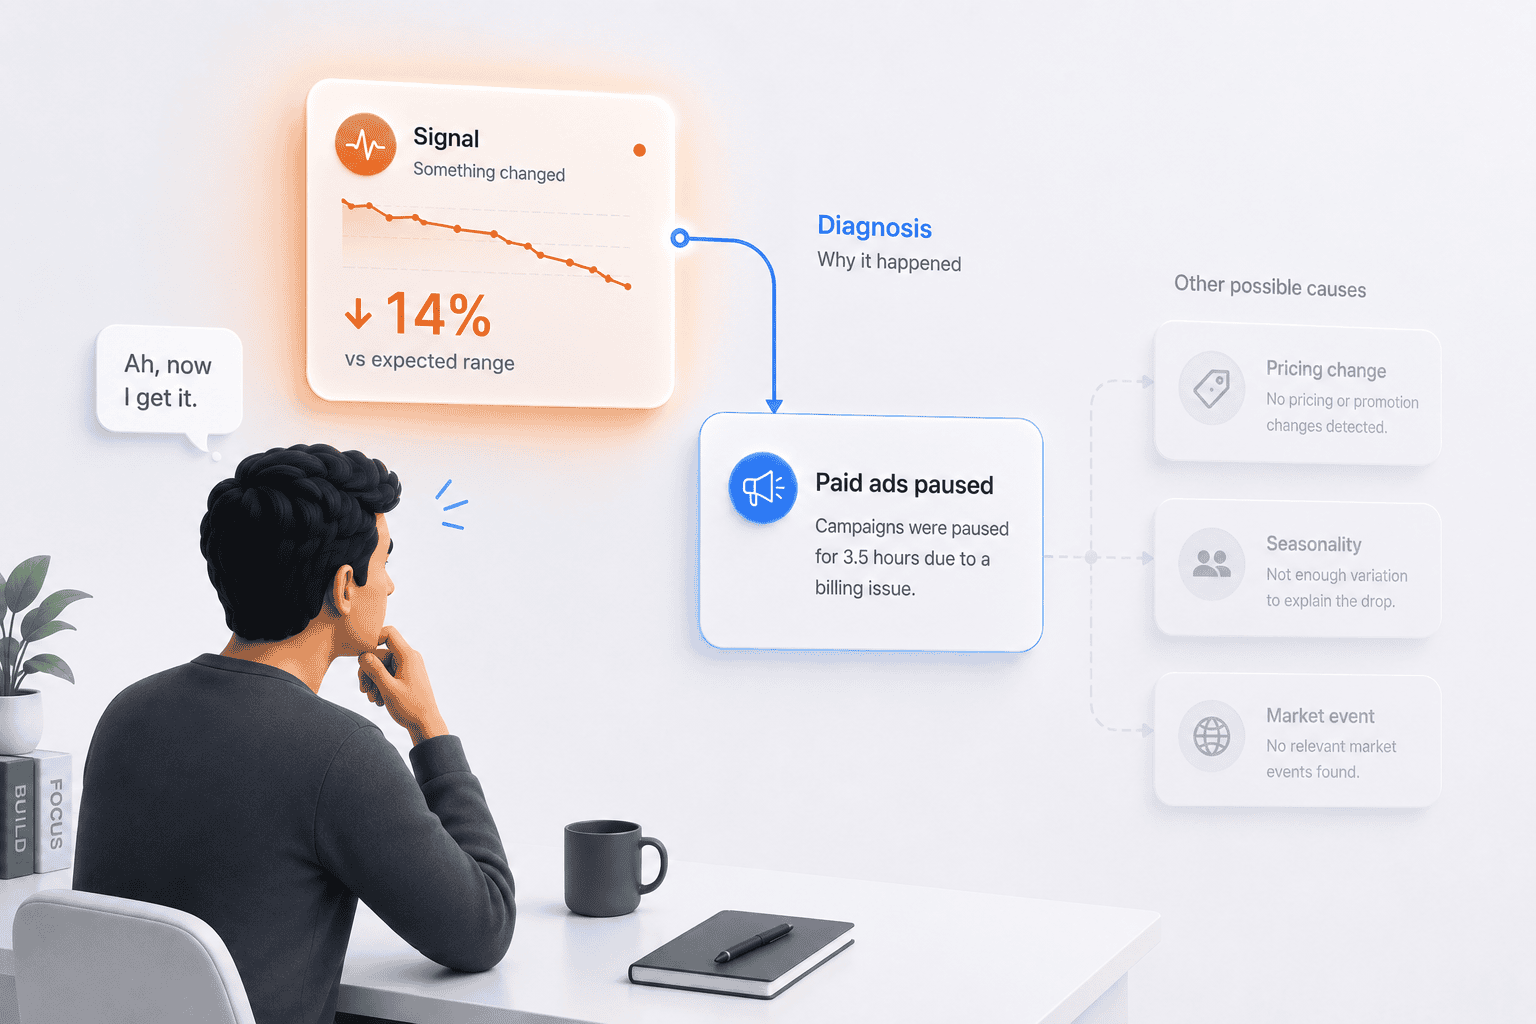
2. Diagnosis: why it changed
The second part is where almost every analytics tool quietly walks off the stage.
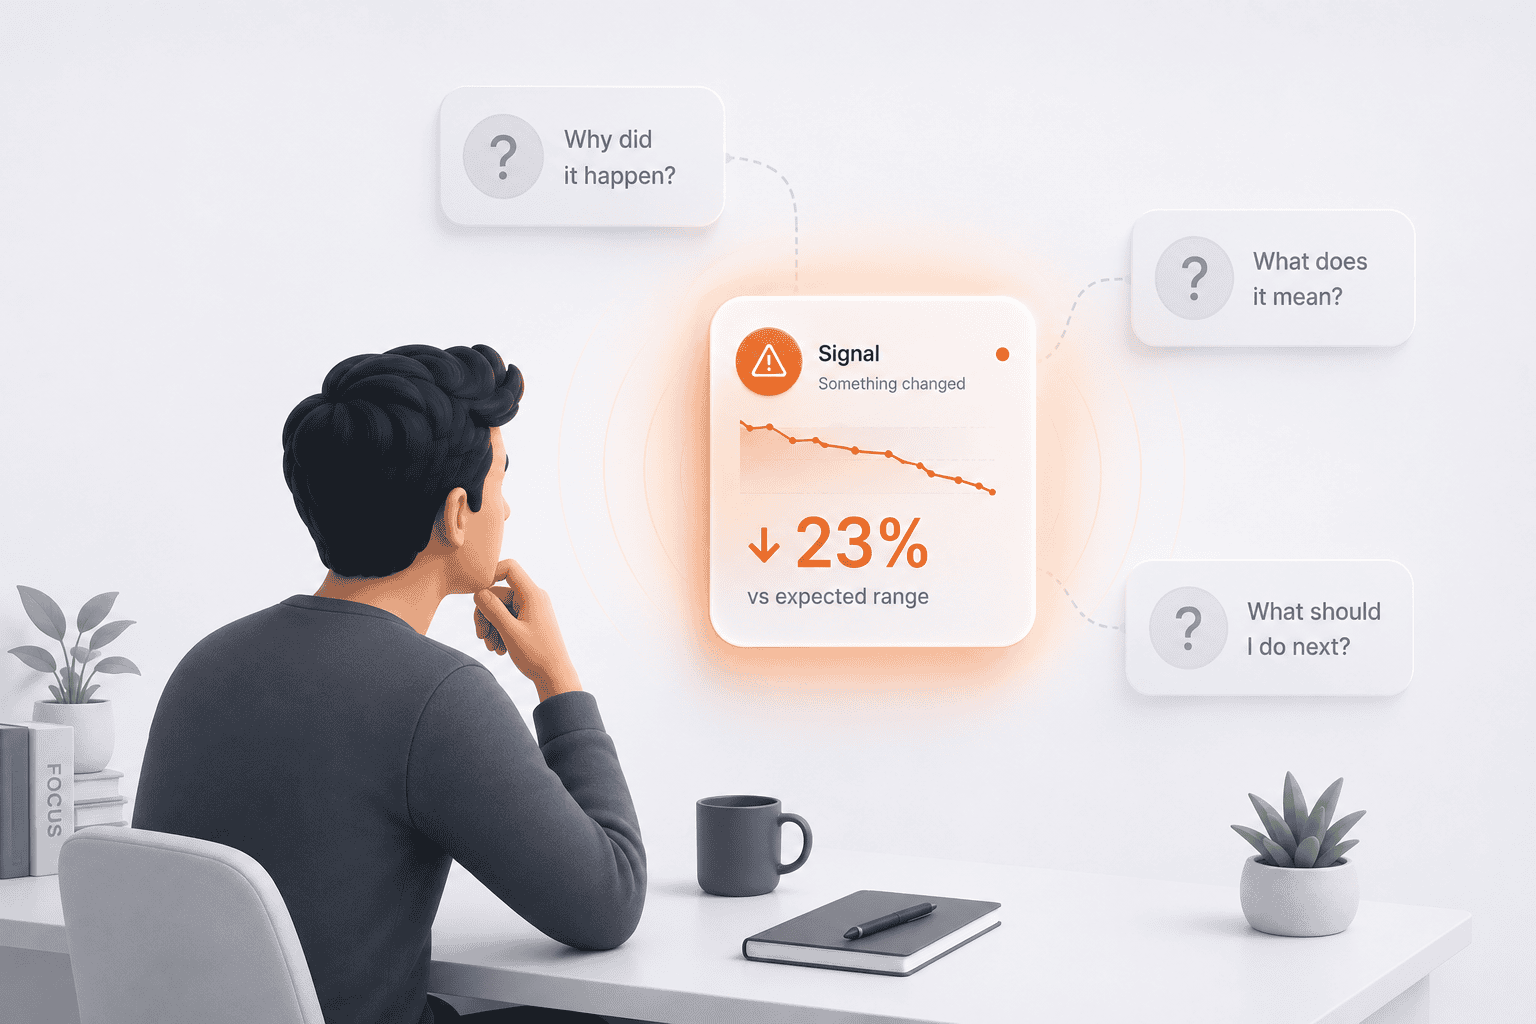
A diagnosis asks the next question. Why did this happen?
- Was it the campaign that ended Thursday?
- The pricing page you shipped Wednesday?
- A regional outage?
- A seasonal pattern your competitors are also feeling?
- A tagging bug in your own analytics?
To diagnose, the tool has to know things it doesn’t currently know. It has to know what you launched last week, what you changed on the site, what campaigns you paused, what events are happening in your market.
The diagnosis is the hardest of the four parts to deliver because it requires context that lives outside the dashboard.
So tools skip it. They flag the change and hand it to you, expecting you to remember that you turned off the Meta retargeting campaign on Thursday and that Thursday is when the drop started.
Sometimes you remember. Most days you don’t.
3. Consequence: what this means for the business
Even a perfectly diagnosed change isn’t an insight yet.
The third part is consequence. What does this change actually do to the business?
This is where Avinash Kaushik’s “so what” test lives. Sessions dropped 14%. So what? Because the Meta campaign was paused. So what? Because if it stays paused for two more weeks, you lose roughly $8,400 in new-customer revenue.
The third “so what” is where the insight starts to be useful. Before that, what you have is technically true but commercially irrelevant.
The consequence layer translates the data into the language the founder actually thinks in. Not sessions, but new customer revenue. Not bounce rate, but conversion of qualified traffic. Not engagement time, but probability that the product page is doing its job.
Every dashboard in the world will show you that sessions dropped. Almost none will tell you what that means in your business.
4. Action: a clear, committed next step
The fourth part is the one that scares tools the most.
An action is a specific, committed recommendation. Not a list of possibilities. Not a “you might want to look at.” One move, written like the tool means it.
- Restart the Meta campaign Monday morning, and if revenue hasn’t recovered by Thursday, the pricing page change is the real culprit.
- Revert the new homepage and re-test in two weeks once the holiday traffic mix has stabilized.
- Reach out to the 47 customers whose repeat-purchase frequency broke this month, before the cohort goes dark.
- Wait. This is seasonal noise and the data will normalize within ten days.
The action doesn’t have to be the right one. It has to be a committed one. The whole job of the insight is to commit to a hypothesis and let the founder decide whether to take the move.
When a tool refuses to commit, the work gets pushed back onto the founder, who is the person least equipped to do it and the most short on time.
An insight without an action is editorial. Interesting, not useful.
Why we don’t have this yet
Because each of the four parts gets exponentially harder than the one before.
Signal is the easy part. It is math. It has been solved for years.
Diagnosis is harder, because it needs context the tool does not have. What you shipped, what you paused, what is happening in your market.
Consequence is harder still, because it needs to understand your business model. What a session is worth to you. What a paused campaign costs. What your margins and LTV actually look like. Most tools are not connected to enough of your business to do this math.
Action is the hardest of all, because action requires opinion. And opinion is risky. If the tool recommends a move and the move is wrong, the tool gets blamed. So most tools quietly decide it is safer to surface the data and let you figure it out.
The standard from here
Stop accepting notifications as insights. That is the whole shift.
The next time your dashboard hands you a chart card with a percentage change on it, do not call it an insight. Call it what it is. A signal.
The work of turning it into something useful is still ahead of you, unless you have a tool that does that part for you.
A tool that gives you only the signal is not finishing the job. It is sending you the bill.