
With your business, direction is certainly more important than speed!
If you are looking for the right benchmarks for where your business is headed, it’s worth considering product analytics metrics.
Analyzing your product metrics helps you understand whether you are on track to meet your goals or not.
Consistently monitoring these metrics can change the course of your business.
Let’s dive deep into what it is and how it helps:
What is Product Analytics?
Following this, businesses can improve and optimize their product by gauging the performance of a digital experience.
This helps businesses understand and answer questions related to customer behavior when interacting with the product.
Why do product analytics metrics matter?
Product metrics matter because they lead to better decision-making throughout the product development phase.
Since it shows the customer’s or users’ interaction with the product, you can see how those aspects affect your business.
Besides product development, these insights can be helpful in areas such as marketing, customer success, and analytics to gauge the way forward.
The challenge of choosing the right product metrics
While choosing the right product metrics can be rewarding, there can be challenges while choosing the right product metrics.
Here are some challenges that teams face:
- Finding the right tool that can gather quality data and present the same in a user-friendly manner
- Aligning the data with your product goals
- Identifying the right data to track
- Unraveling the data to reveal the insights and outline the steps to take
- Finding out the right benchmarks for your products
- Gauging how your product performs in comparison to the competitors
Despite the lingering challenges, businesses can still keep their operations afloat by pinpointing important product metrics to analyze their SaaS products.
More on that in the point to follow.
Important product metrics to analyze your SaaS products
Vital product metrics to analyze your SaaS products can make all the difference. Here they are:
Monthly Recurring Revenue (MRR)
MRR is the total amount of revenue the product brings in every month. It helps businesses predict cash flow and financial health, and surfacing revenue trends.
Annual Recurring Revenue (ARR)
Annual Recurring Revenue is a subscription economy metric for predictable and recurring revenue generated by a customer within a year. In simpler terms, companies can get a clear idea about the revenue they can expect annually.
Customer Lifetime Value (CLTV, CLV, or LTV)
Customer Lifetime Value is the average customer spends on your product during their relationship with the company. It helps in understanding how much you should spend on customer acquisition and identifying the customers you must pursue.
Average Revenue Per User (ARPU)
The ARPU quantifies the amount of revenue generated from each customer on average. It helps companies analyze their growth patterns, and compare their growth to that of their competitors.
Average Revenue Per Paid User (ARPPU)
ARPPU helps to evaluate the revenue generated by paying users over some time. This helps companies understand how to acquire customers profitably.
It is also used to assess paying customers rather than the company’s entire customer base, while also giving you a picture of the revenue-generating capabilities.
User Growth Rate
User growth rate is the percentage of new growing customers that you gain every month. If the trend is positive that means that the company is acquiring more customers.
Besides measuring the company’s success, it also helps to assess the success of the product. By calculating the same, companies can make informed decisions, drive growth and increase customer satisfaction.
Customer Acquisition Cost (CAC)
CAC is the average amount that your company spends for a new customer acquisition. It helps to measure the impact and efficiency of marketing and sales activities.
This also helps in knowing if the amount spent on customer acquisition is equivalent to the revenue that flows in.
Churn Rate
The churn rate refers to the percentage of users who stop using your product after a specific period. It tracks the company’s ability to retain customers and is often used to signal customer satisfaction.
Conversion Rate
This measures the number of people who complete a specified action in your product, which can be referred to as the conversion event. The conversion rate measures how effectively your product guides users to take the action you want them to take.
These actions can range from making a purchase, filling out a form, downloading an ebook, or any other relevant action.
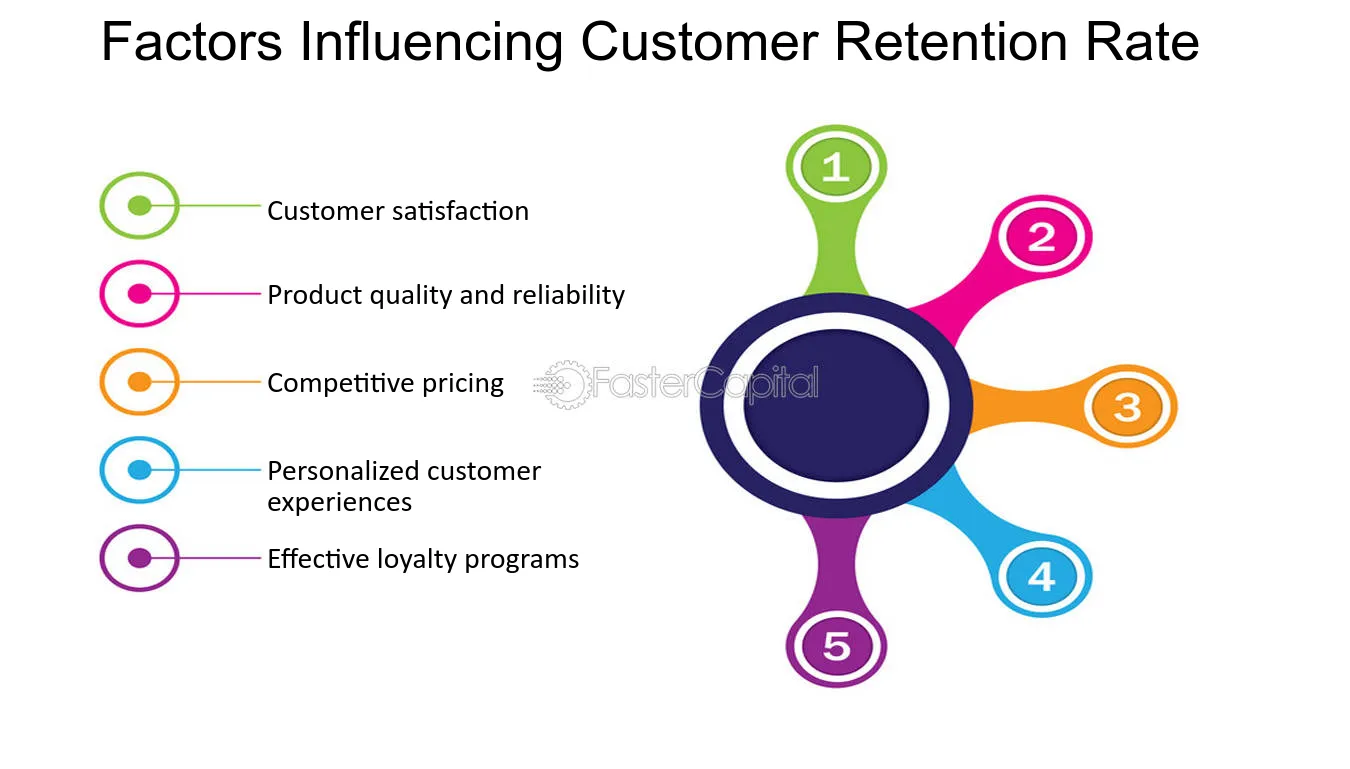
Retention Rate
Retention describes the product’s ability to keep the users engaged over a specific period. Amongst other metrics, retention is a relevant one that captures the product-market fit.
Especially, with SaaS business models, retention rates are directly correlated with revenue.
As per the Faster Capital, these are the factors that impact customer retention rate:
While you must focus on the product metrics to follow, it is equally important to be aware of the ones you must ignore for a targeted approach.
The results of the above metrics can give you a crystal clear picture of the areas of improvement.
Which product metrics should you not focus on?
While you focus on the metrics that matter, it is equally important to evade those that can lead you off the track. Here are some of them:
Vanity Metrics
Vanity metrics refer to ones that look good on paper but cannot be implemented, nor their execution can make a significant difference.
Here are some vanity metrics that you must avoid:
- Bounce Rate
It measures the percentage of people who leave your site after visiting only one page and doesn’t tell you much. Rather than give you direct answers, there is a lot of ambiguity. - Time on Page
Though it might seem helpful, it can be misleading as well. Increased time on the page may indicate that the brand has been successful in engaging the users. But the time on the page could also extend as the user must have been confused or just kept the tab open while idle.
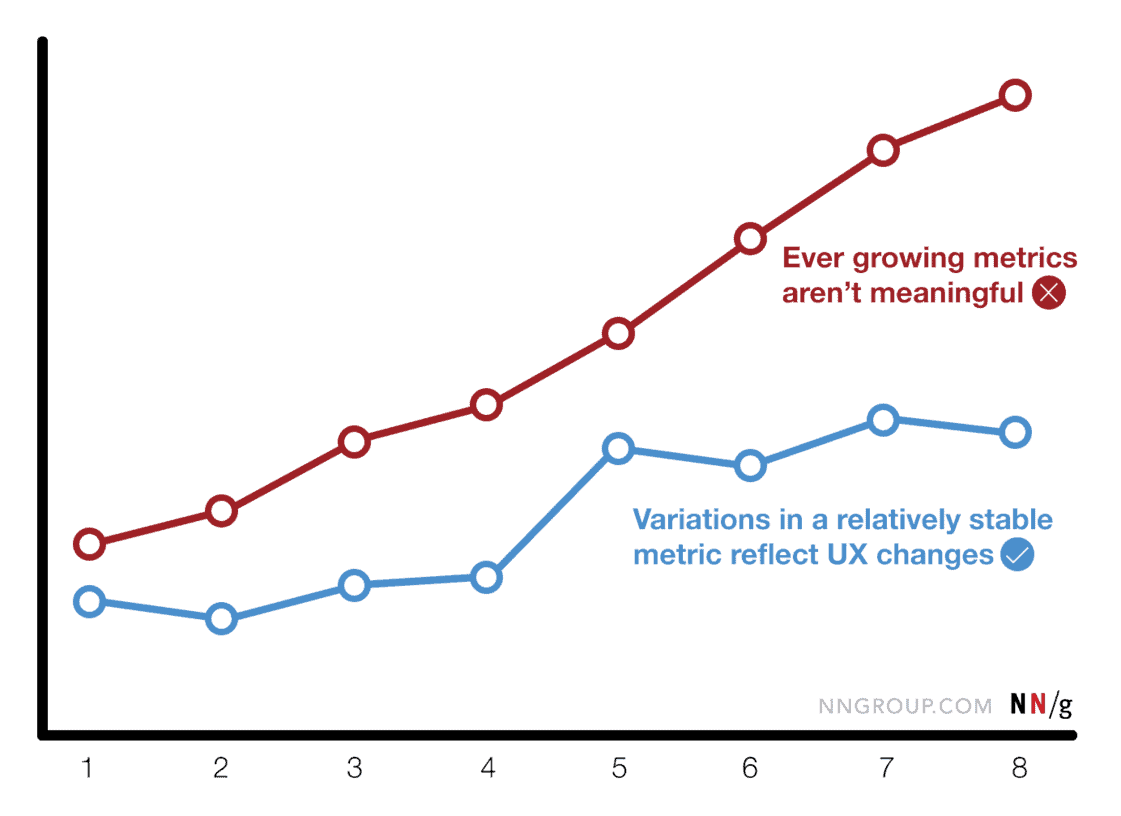
Rather than working in darkness, it’s better to waive off metrics that serve no purpose.
This image from the Neilson Norman Group sums it up perfectly.
Conclusion
Metrics are more than numbers. They offer critical insight into customer behavior.
The above-mentioned product metrics can capture a lot of information about your customer and the product.
However, like other factors, there is yet to be a quick answer. It depends on your customers, your goals for your product, and the focus that it requires.
However, we believe Putler can make things easier and more direct for you.
Looking for a demo? All it takes is 5 minutes!
Get in touch now!
FAQs
What do you measure in product analytics?
Here is what you must measure through the product analytics:
- Pricing
- Pay model
- User interface
- Messaging
- Ideal customers
and more.
What is the KPI of a product analyst?
The KPI for a product analyst is the measure of performance. It counts activities, costs, revenue, usage, and other metrics to make informed decisions.
What is the difference between product metrics and analytics?
Product metrics are quantitative measurements representing data such as numbers and stats. On the flip side, analytics is about interpretation.