


SaaS analytics helps you understand whether your subscription business is growing, keeping customers, and earning enough from each account. It brings recurring revenue, retention, and customer activity into focus so you can investigate a falling MRR or a rise in cancellations.
This guide explains the SaaS metrics to track first, their formulas, and how to use them in everyday decisions. You’ll also learn how Putler, Google Analytics 4, and Baremetrics differ, so you can choose tools for billing reports, customer journeys, or both.
What is SaaS analytics?
SaaS analytics is the process of collecting and analyzing data from a software-as-a-service business to understand how it’s performing and where it’s heading. It takes raw subscription data and turns it into clear signals you can act on.
Key Performance Indicators (KPIs) only mean something once analytics puts them in context. A churn number needs context. Track it over time, compare customer segments, and assess the revenue affected before deciding what to change.
SaaS analytics focuses on recurring customer relationships. Billing data shows renewals, upgrades, downgrades, and cancellations, while product events show how customers use the service. Reviewing both helps you understand retention alongside revenue.
SaaS business analytics needs three kinds of data: billing records for recurring revenue, product events for activation and feature use, and acquisition data for where customers came from. SaaS data analytics connects those views. A payment dashboard can tell you what changed in revenue; it cannot explain a drop in feature usage without that usage data.
How SaaS analytics helps a business grow
Subscription growth depends on winning customers and retaining existing revenue. SaaS analytics helps you see where revenue is gained or lost and investigate the changes that deserve attention.
- Turning data into decisions: The point of SaaS metrics isn’t the number, it’s the action it triggers. Analytics connects the metric to a next step you can actually take.
- Investigating churn signals: Waiting for a monthly report can delay your response to failed payments or declining usage. Timely billing and product-usage data can flag warning signs while you can still do something about them. A failed renewal or falling usage is a reason to investigate, not proof that a customer will leave.
- Comparing what works: Compare plans, acquisition channels, and product usage with retention and revenue. Investigate the differences before changing your pricing, onboarding, or marketing budget.
- Forecasting instead of guessing: Historical patterns help you project revenue and explore churn scenarios, so you plan around real trends rather than hope. The forecast still depends on your assumptions.
Why you need SaaS analytics
Your billing system already holds useful revenue data. Product usage and acquisition reporting may need additional tracking. Bringing these sources together supports three common tasks.
- Churn analysis: Customers leave for reasons, and billing records, cancellation feedback, and product usage help you investigate them. Churn analytics helps you spot patterns and separate failed-payment churn from voluntary cancellations, so you can choose the right response.
- Customer segmentation: One message doesn’t fit every customer. Segmentation groups subscribers by recorded behavior, MRR, LTV, or subscription status so you can treat a high-value long-term account differently from a trial that’s about to lapse.
- Predictive insights: Forecasting revenue under different retention assumptions helps you plan beyond past results. Review the forecast against actual results; it is a scenario, not a guarantee.
Once you’re convinced subscription analytics is worth doing, the next question is which numbers to actually track.
Start small. Connect your billing source, agree on the reporting period and customer unit, then track a useful product event such as creating a first project. Each week, check revenue movements and compare new-customer cohorts. If cancellations rise, inspect failed payments and customer feedback before changing onboarding or pricing. That’s how SaaS reporting becomes a working routine.
What SaaS metrics should you track?
Start with churn rate, MRR, ARR, customer LTV, and ARPPU. Together, these SaaS metrics help you monitor retention, recurring revenue, and the value of paying customers.
- Churn rate: The churn rate is the percentage of customers who leave over a given period. A rising rate deserves investigation. Check payment failures, customer feedback, and usage patterns to understand the cause.
- MRR: Monthly Recurring Revenue is the monthly-normalized value of recurring subscriptions, excluding one-time fees. It measures your recurring revenue run rate rather than cash collected that month.
- ARR: Annual Recurring Revenue is the same idea over a year, normalized to a 12-month period. MRR gives you the granular monthly view, ARR gives you the big picture for forecasting and valuation. If you’re deciding which to lead with, the MRR vs ARR breakdown covers when each one fits.
- Customer LTV: Customer Lifetime Value is the total revenue you can expect from a customer across their whole relationship with you. Use it alongside gross margin and acquisition cost before deciding how much you can afford to spend acquiring one. Revenue LTV is not profit.
- ARPPU: Average Revenue Per Paying User shows average revenue from paying users over a defined period. Comparing cohorts can help you investigate differences in plan mix and spending.
These metrics work together. Churn tells you if customers stay, MRR and ARR tell you what they’re worth now, and LTV tells you what they’re worth over time. Watch them as a set, not in isolation.
Here’s the calculation behind each number. Use the same period, currency, and customer definition throughout.
| Metric | Starting calculation | What to check |
|---|---|---|
| Opening-cohort customer churn rate | Customers from the opening base who churned ÷ customers at the start × 100 | Count losses from the opening cohort only. Define cancellation and reactivation rules; other dashboards may use different denominators. |
| MRR | Sum of monthly-normalized recurring subscription amounts | Divide annual subscription amounts by 12. Keep one-time fees separate; check discounts and subscription status. |
| ARR | MRR × 12 | An annualized recurring run rate, not cash received or a guaranteed year's revenue. |
| ARPPU | Revenue in the period ÷ paying users in that period | For subscription-only monthly analysis, use recurring revenue consistently. If you bill accounts rather than individual seats, track ARPA too. |
| Revenue LTV estimate | Monthly recurring revenue per paying account ÷ estimated monthly customer churn rate | Use churn as a decimal. A stable historical churn estimate is more useful than one noisy month; zero churn does not give a usable estimate. |
For example, an annual subscription of $1,200 contributes $100 to MRR, not $1,200. If 3 of your 100 opening customers leave during the month, customer churn is 3%. A $100 monthly revenue per account and a 5% historical monthly churn estimate give a simple revenue LTV estimate of $2,000. These are illustrative calculations, not business benchmarks. Stripe’s billing definitions and ChartMogul’s LTV calculation show why dashboard settings and estimation methods matter. The churn example uses the opening customer cohort; Stripe’s subscriber churn report uses a different rolling calculation that also includes new subscribers in its denominator. Record your chosen definition before comparing tools.
Once those basics are reliable, add net revenue retention (NRR) to see what happens to revenue from existing customers. For a cohort with no reactivations, NRR = (starting MRR + expansion − contraction − churned MRR) ÷ starting MRR × 100. With $2,000 at the start, $100 expansion, $20 contraction and $60 churned MRR, NRR is 101%. New-customer revenue stays out of this calculation. NRR definitions can include reactivations, so compare like with like.
Gross revenue retention (GRR) excludes expansion, making lost revenue easier to see. Customer acquisition cost (CAC) and CAC payback add the spending side: what a new customer costs to win and how long gross profit takes to repay that cost. Add an activation or cohort-retention measure when the question is whether customers get value from the product. You don’t need all of them on day one.
Best tools for SaaS analytics
The right tool depends on what you’re optimizing for: an all-in-one view, free web tracking, or deep financial reporting. Here are three that cover the range.
| Tool | Best fit among these options | Check before choosing |
|---|---|---|
| Putler | Subscription businesses that also sell one-time products or collect payments across supported sources | Confirm your integrations and metric definitions. Use a product-event tool alongside it when you need feature-level behavior. |
| Google Analytics 4 | Website and app acquisition, event-based funnels and cohort exploration | Configure the events you need. Keep a billing source for recurring-revenue reconciliation. |
| Baremetrics | Dedicated subscription financial reporting | Check integration limits, forecast access and separate recovery or cancellation-feedback add-ons. |
These SaaS analytics tools solve different jobs. During a trial, reconcile a sample of renewals and cancellations with your billing system and check that your chosen events appear in the funnel reports.
Putler: all-in-one SaaS analytics
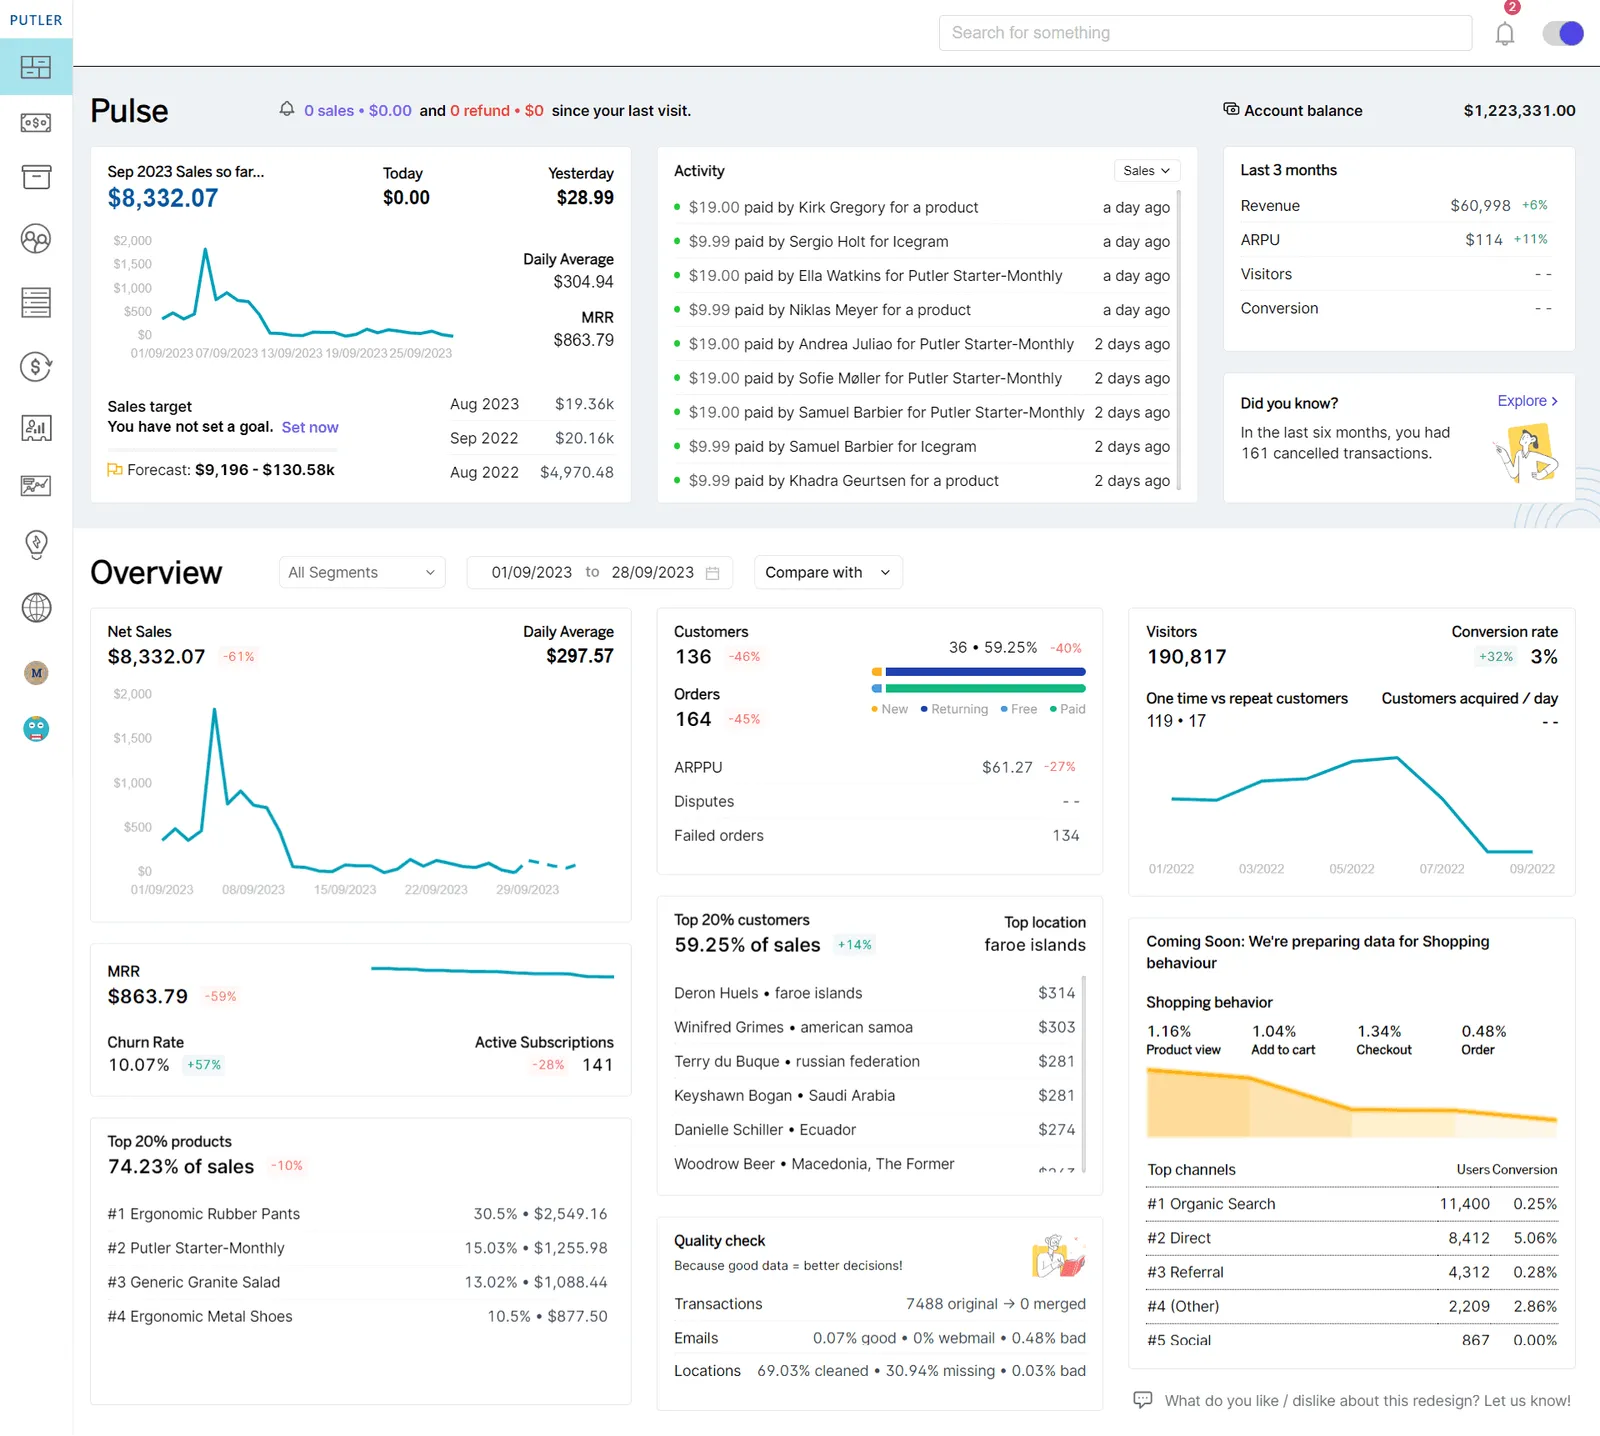
Putler is an all-in-one analytics tool that consolidates your subscription data into one view. It pulls from supported sources, merges them, and surfaces the SaaS metrics that matter without stitching together separate reports. For WooCommerce sellers specifically, it reads directly from WooCommerce subscriptions alongside your other channels.
- Data integration: Putler collects data from your payment gateways, stores, and subscription systems, then combines it into a unified dashboard so you’re not stitching numbers together by hand.
- Regularly updated metrics: Regularly updated reports help you spot a churn spike or a revenue dip before month-end. Check how your connected source syncs before relying on an immediate alert.
- Subscription analytics: Putler reports MRR, churn, and active subscriptions alongside sales and customer metrics. Check the definitions and subscription data available from your connected sources.
- Revenue forecasting: Use historical performance and adjustable model assumptions to explore revenue scenarios. Compare forecasts with actual results.
- On-demand reports: Access dashboard reports and filter them by period or segment rather than rebuilding the same report manually.
Putler is particularly useful when subscriptions and one-time sales share a business. You can review recurring revenue alongside customers and other sales, while keeping MRR separate from total sales. Check the supported integrations and revenue-based pricing for your setup.
Google Analytics: free web analytics
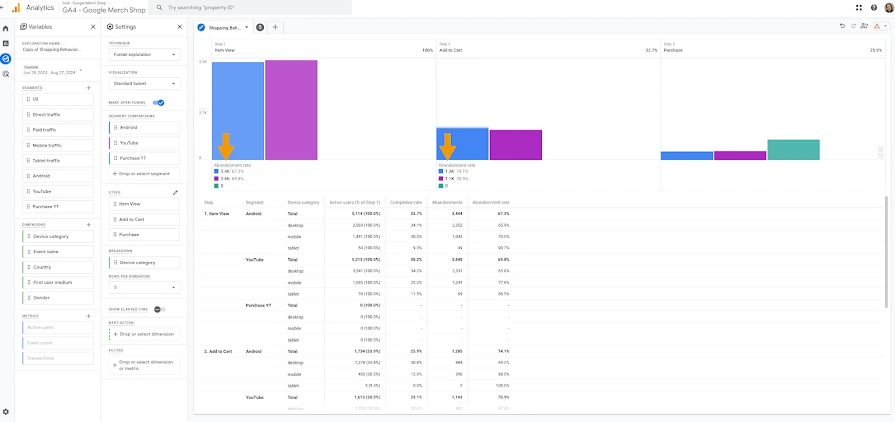
Google documentation example showing a shopping funnel. For SaaS, configure steps such as signup, activation, and paid conversion.
Google Analytics 4 (GA4) has a free version for website and app analytics. It helps you understand acquisition and customer journeys through collected events. For recurring-revenue reporting, pair it with billing data rather than treating event-based revenue as a subscription ledger.
- User behavior tracking: It shows how visitors move through your site and where they engage, which is useful for acquisition and in-product journeys when the relevant events are collected.
- Conversion funnel analysis: With configured events and funnel steps, it surfaces where people drop off on the way to signing up or reaching an activation milestone.
- Custom reporting: You can build event-based reports and cohort explorations around your own goals. MRR, upgrades, downgrades, and billing churn still require subscription data and appropriate calculations. Google’s funnel exploration guide explains how to define and compare funnel steps.
Baremetrics: financial metrics tracking
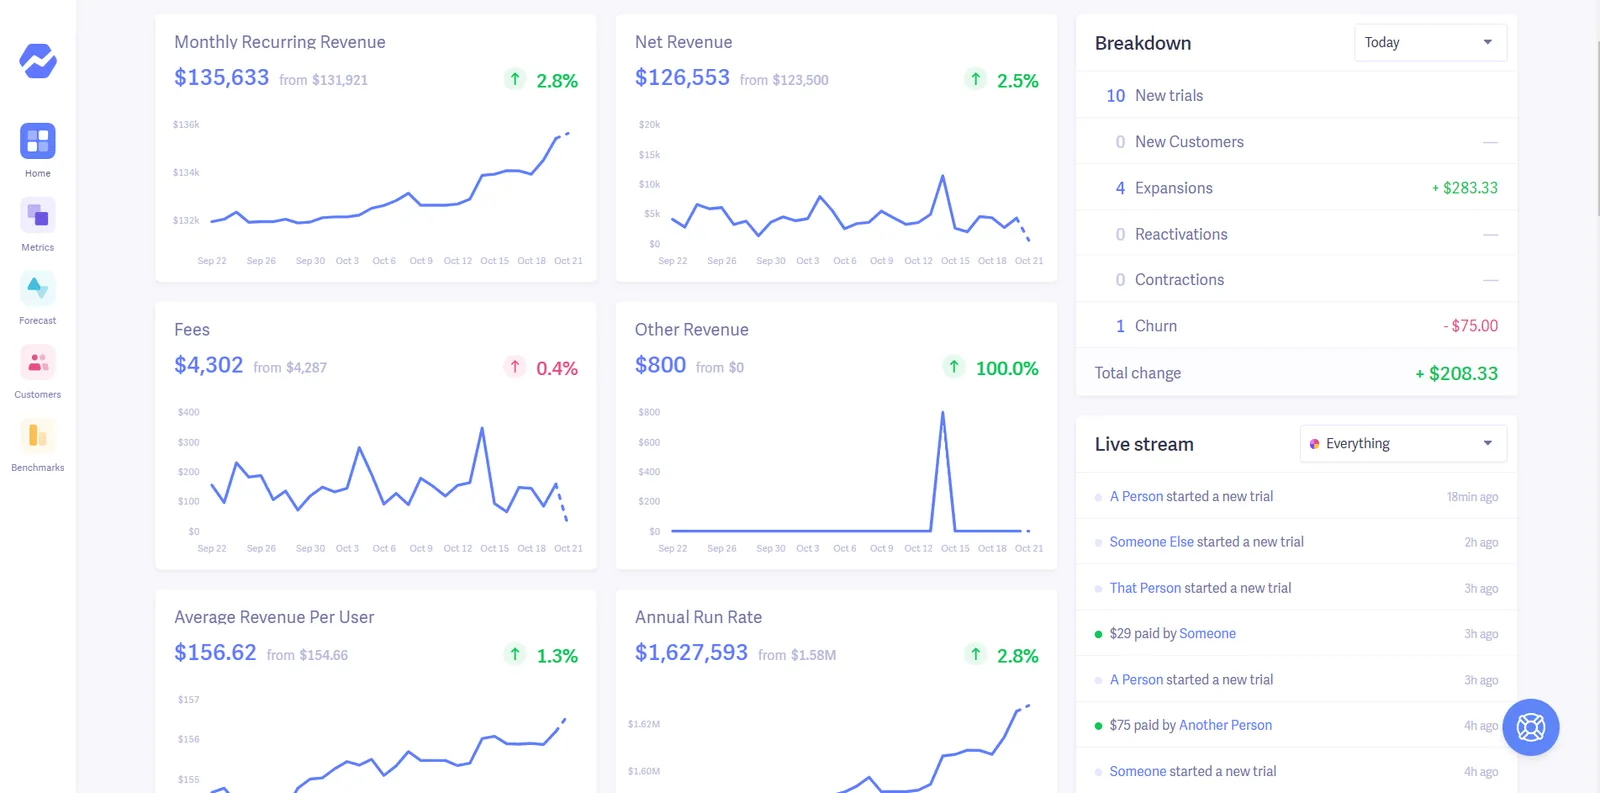
Baremetrics focuses on financial metrics, and it’s a strong choice for businesses that want revenue and churn laid out in detail. CAC reporting needs acquisition-cost data too. Use it for subscription financial reporting, with a separate product-event tool when you need detailed feature usage.
- Financial transparency: It gives clear breakdowns of recurring revenue and churn. In Forecast+, tagged marketing costs and new-customer data feed the customer acquisition cost calculation.
- Forecasting tools: Its forecasting helps you model revenue, expenses, and runway. Check forecast and scenario-planning access for the plan you choose.
- Subscription analytics: It digs into recurring revenue dynamics, going past surface numbers into what’s actually driving the movement.
Baremetrics pricing depends on ARR, integrations, and the package you choose. Payment Recovery and Cancellation Insights are separate add-ons on its pricing page. Confirm the final quote and billing term rather than assuming every feature is included.
Conclusion
SaaS analytics is useful when a metric leads to a concrete decision. A churn increase can prompt a payment-recovery check; weaker activation in a new cohort can prompt an onboarding review. Start with reliable data and a question you need to answer.
Start with churn, MRR, and LTV. Watch them consistently, connect each number to a decision, and pick a tool that puts them in one place. When you’re ready for a consolidated view across subscriptions, customers, and revenue, that’s exactly what Putler is built for.
FAQs
What is the best tool for SaaS analytics?
The best tool depends on your needs. Putler offers data integration, regularly updated metrics, and revenue forecasting in one dashboard, which suits businesses that want a consolidated view. Baremetrics is strong for financial reporting, and GA4 covers website and app events. Pair event analytics with billing data when you need both product usage and recurring-revenue reports.
How can businesses use SaaS analytics for customer retention?
SaaS analytics supports retention by showing where cancellations, failed payments, or declining product use need attention. Segmentation lets you tailor outreach by customer type. Combine billing data with product usage and cancellation feedback to investigate risk; a dashboard alone does not guarantee advance warning.
How can SaaS analytics improve business performance?
It can help you investigate revenue changes, compare customer cohorts, and identify payment or onboarding problems. Use the findings to make a specific change, then measure the outcome; reporting alone does not improve performance.
Can you use Google Analytics for SaaS?
You can use GA4 for website and app events, funnels, and cohort exploration. It does not provide a ready-made subscription ledger for MRR and billing churn. Tools like Putler and Baremetrics cover recurring-revenue reporting; use your billing source to reconcile those numbers.
Can SaaS analytics predict market trends and customer behavior?
SaaS analytics can help forecast your own revenue and customer behavior from historical patterns, but it cannot reliably predict the wider market or every customer’s next move. Segmentation by industry, MRR, LTV, or churn rate sharpens your analysis. Treat predictions as scenarios and check them against actual results.
Which SaaS metrics should you learn next?
Continue with these guides to SaaS reporting, ARR, churn, ARPPU, and subscription analytics tools.