Churn rate is one of those metrics that looks simple on the surface but quietly shapes everything else in your business.
Understanding it, tracking it accurately, and knowing what to do about it is what separates businesses that grow from ones that stall.
Churn rate, or customer attrition if you want to be fancy, holds the secret to retaining your precious customers and fueling growth.
At its core, churn rate refers to the percentage of customers who stop using your product or service during a certain period of time.
It is like a leaky bucket, slyly draining away your hard-earned clientele.
This metric is a reflection of customer dissatisfaction, changing needs, or competitive pressures that result in the loss of revenue and potential growth opportunities.
Let’s start with a basic understanding of churn rate and why it matters for businesses.
What is Churn Rate?
Customer churn rate refers to the percentage of customers that stop using your product or service after some time.
A high churn rate indicates revenue loss, increased customer acquisition costs, and potential dissatisfaction among customers.
In a nutshell, it suppresses growth.
As we mentioned earlier, consider it like a bucket that’s leaking. Users drip out of it and you struggle to refill it with new users.
With this, it gets expensive fast.
- Acquiring a new customer is 5x-25x more expensive than retaining one.
- Reducing churn by just 5% can boost profitability by 75%.
- Improving retention has a 2-4x greater impact on growth than acquisition.
- The probability of selling to an existing customer is 60-70% , but only 5-20% for prospects.
Then too, it’s not all,
Churn rate plays a major role in informing metrics like CLTV and customer retention rate.
Together all these numbers will help you to build more accurate forecasts for revenue, growth, and scaling efforts.
So, now as you know the importance of churn rate, let’s dig deeper into…
Types of churn rate & how to calculate it?
Understanding the various types of churn rates and how to calculate them is vital for gaining a comprehensive view of your customer attrition.
Let’s explore the different types and the formula used to calculate churn rate.
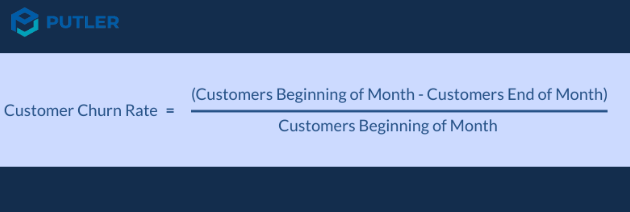
User churn rate
What percentage of paying customers are lost every month is known as your user churn rate or customer churn rate.
As of today, a 10% customer churn rate implies, 10% of the total active paying customers you had 30 days ago have canceled within the last 30 days.
How to calculate the user churn rate?
Let’s work through the numbers.
As of 1 June 2024, you had 100 paying customers. By June 28, 2024, only 95 customers remained, indicating a loss of 5 customers.
Calculating the churn rate:
User churn rate = (5/100) * 100 = 5%
Remember, a 5% monthly churn rate may seem small, but it equates to a substantial number of lost users in a year. Aim to lower this rate for long-term success.
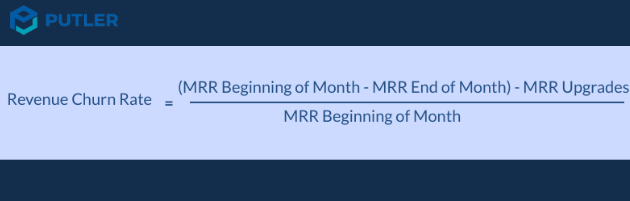
Revenue churn rate
How much % of the revenue you are losing every month is your revenue churn rate.
For example, a 10% revenue churn rate implies you lost 10 % of your MRR within the last 30 days to the MRR it stood 30 days ago.
How to calculate the revenue churn rate?
Here is how the calculation works.
As of June 1, 2024, you had 100 customers, each paying $100, resulting in an MRR of $10,000.
By June 28, 2024, 5 customers
downgraded to the $80 plan and 5 customers canceled their subscriptions.
This led to a loss of $100 (20 * 5) due to downgrades and $500 (100 * 5) due to cancellations.
- MRR as of June 1: 100 customers * $100 = $10,000
- MRR as of June 28: $10,000 – ($100 + $500) = $9,400
- Identify the number of users who churned
- Then divide this by the total number of users who started using your product or service in the start of the month.
- Small businesses: Average churn rate of 7.5%, often driven by budget constraints and limited resources.
- Mid-sized companies: Average churn rate of 5.2%, balancing scalability needs with operational challenges.
- Large organizations: Average churn rate of 3.8%, benefiting from stronger vendor relationships and higher switching costs.
- Monthly recurring revenue (MRR): MRR is crucial for long-term viability. Minimize user churn to protect your revenue.
- Customer lifetime value (CLTV): Churn decreases CLTV as it reduces revenue and value.
- Customer acquisition costs (CAC): Churn increases CAC, affecting your profitability. Reduce churn to recover acquisition costs.
- Net Negative MRR Churn: Lower user churn enables achieving net negative MRR churn, a powerful growth strategy.
- It is easily understandable – Anyone in your company is able to understand that number effortlessly. This is absolutely essential for a key metric. No one can actually act on your number unless and until they understand it.
- It is easily comparable – Do not add complexity as it will be harder for you to compare your churn calculations. Just create consistency by taking straightforward and simple paths. Hence, it will be easily compared then.
- For deeper analysis, it is a starting point- you are able to comprehend things such as; what your number accounts for or what it doesn’t and at which place you’re needed to dig in more to learn. Along with complex calculations, the first step of yours will remind you how to calculate it.
- Sales and transactions data
- In-depth customer profiles
- Product metrics and performances
- Visitor analytics
- In-built web analytics
Now, let’s calculate the churn rate for June.
Revenue Churn Rate = (600 / 10,000) * 100 = 6%
You experienced a churn rate of 6% in terms of revenue for June.
Annual churn rate
The annual churn rate is the percentage of customers you lose in a year.
Annual Churn Rate = (Total Number of Customers at the Start of the Year/Number of Customers Lost During the Year) × 100
For example, in 2024, Company X had 52,000 customers up for renewal, with 3,000 customers churning during this period.
They generated a total revenue of £501,000, with £44,408 revenue canceled.
Customer Churn Rate Calculation:
Churn rate = (3,000 / 52,000) * 100 = 5.76%
Revenue Churn Rate Calculation:
Revenue churn rate = (£44,408 / £501,000) * 100 = 8.86%
The revenue churn rate is slightly higher than the customer churn rate.
This suggests potential challenges in maintaining subscriptions at higher price points.
Re-evaluating the pricing structure may help reduce revenue churn.
Monthly churn rate
The monthly churn rate refers to the loss of customers in a month.
To calculate your monthly churn rate:
The correct formula is:
Monthly Churn Rate = (Total Number of Users at the Start of the Month/Number of Users Who Churned During the Month) × 100
Probability churn rate
The probability churn rate refers to the probability of customers that will be churned in the given period.
But how do all these affect other SaaS metrics? Let’s find out.
Voluntary vs involuntary churn: Know the difference
Not all churn happens for the same reason. There are two types and they require completely different responses.
Voluntary churn is when a customer actively decides to cancel. This is usually driven by dissatisfaction with the product, pricing concerns, or switching to a competitor. This type of churn points to product or experience problems that need fixing.
Involuntary churn is when a customer loses access because of a failed payment, expired card, or billing error. The customer did not intend to leave. According to the 2025 Recurly Churn Report, the average B2B SaaS churn rate is 3.5%, split between voluntary churn at 2.6% and involuntary churn at 0.8%.
That 0.8% matters more than it sounds. Fixing involuntary churn alone can lift revenue by 8.6% in year one. Simple fixes like automated card updaters, retry logic, and dunning emails can recover a significant portion of this revenue with minimal effort.
Churn rate benchmarks by company size
Knowing your churn rate is only useful if you know what to compare it against. Here is how churn breaks down by company size, based on data from over 1,000 subscription businesses:
The pattern is clear. As your business grows and your product matures, churn tends to come down. If you are early stage, a higher churn rate is expected. The goal is to bring it down consistently over time as you improve onboarding, product fit, and customer success.
What is net negative churn and why it matters
Most businesses think of churn as something to minimize. But the best SaaS companies go further. They achieve net negative churn.
Net negative churn happens when the revenue gained from existing customers through upgrades, expansions, and add-ons exceeds the revenue lost from cancellations and downgrades. In other words, your existing customer base grows in value even as some customers leave.
Net MRR Churn Rate = (Churned MRR – Expansion MRR) / MRR at Start of Month x 100
If this number is negative, you have achieved net negative churn. That is one of the strongest growth positions a subscription business can be in.
According to ChartMogul’s SaaS Benchmarks Report, 40% of SaaS businesses with ARR in the $15-30M range have achieved negative churn. The way to get there is by building a pricing model that has expansion built in, think usage based tiers, seat based pricing, or add-ons that grow with the customer.
How does churn affect other SaaS metrics?
The churn rate acts as a vital indicator for your product or service.
To combat churn, regular optimization and customization of your offering are necessary.
Consider these factors:
By proactively managing these factors, you can optimize your SaaS business, mitigate churn, and lay the foundation to drive long-term growth.
How to handle complex churn cases?
The above example of revenue churn showed a simple calculation.
But you will add customers, lose customers, and see customers migrate from one plan to another frequently.
Moreover, there will be a lot of free or unwanted users who may convert or leave the service.
You would also have customers on annual or quarterly plans.
Hence as the business grows, calculating the churn rate will become a nightmare for you.
So, how would you arrive at the accurate churn rate considering all cases?
Don’t worry, we have a solution – click here.
Reasons to make it easier for yourself
When churn calculation complexity is reduced, you get many benefits:
We kept it simple, your time can be spent in churn analysis of the number, taking a deeper dive on churn by cohort, etc. you won’t be spending your time calculating how you arrived at your number.
This method did work for many of our customers and it will also work for B2B SaaS companies or your subscription business as well.
Steps to take after calculating churn rate
So, you’ve figured out your churn rate and it’s not good news. Don’t worry! Even top businesses face the challenge of losing customers. But there is always something that you can do to reduce the churn rate.
Here are some strategies to control churn:
Understand why: First, ask yourself. Why are customers leaving? Use surveys, feedback, and data to find out. Look for patterns – is there a specific problem with your product? Or maybe new customers find it hard to get started?
Improve onboarding: When new customers start using your product, make sure it’s straightforward for them. Give clear guidance, offer personal help, and show them the benefits quickly.
Keep customers engaged: Don’t wait for customers to leave before you reach out. Regularly check in with them, give helpful tips, and offer special online events.
Listen and change: Your customers have valuable ideas. Their feedback is like a map showing how to make your product better. Act on their ideas quickly.
Create a great loyalty program: Everyone likes to feel special. Make a program that rewards long-time customers like they’re in an exclusive club. Special features, fast support, or just a thank-you note can make a big difference.
Learn from cancellations: When a customer decides to leave, ask them why. Use their feedback to make your product better and maybe even bring them back. Reducing churn is like taking care of a garden. It needs attention and sometimes trimming. But with these steps, you’ll build a strong customer base that lasts.
Now, let’s find out how you can achieve higher accuracy while calculating churn rate.
Get an accurate churn rate for your business with Putler
Putler provides a total of 15 subscription metrics including your user churn rate for Stripe, PayPal, WooCommerce, and Authorize.Net.
Simply connect your payment gateways, and eCommerce systems and Putler will take care of all calculations and cases. However complex data your business deals with, Putler will handle that efficiently.
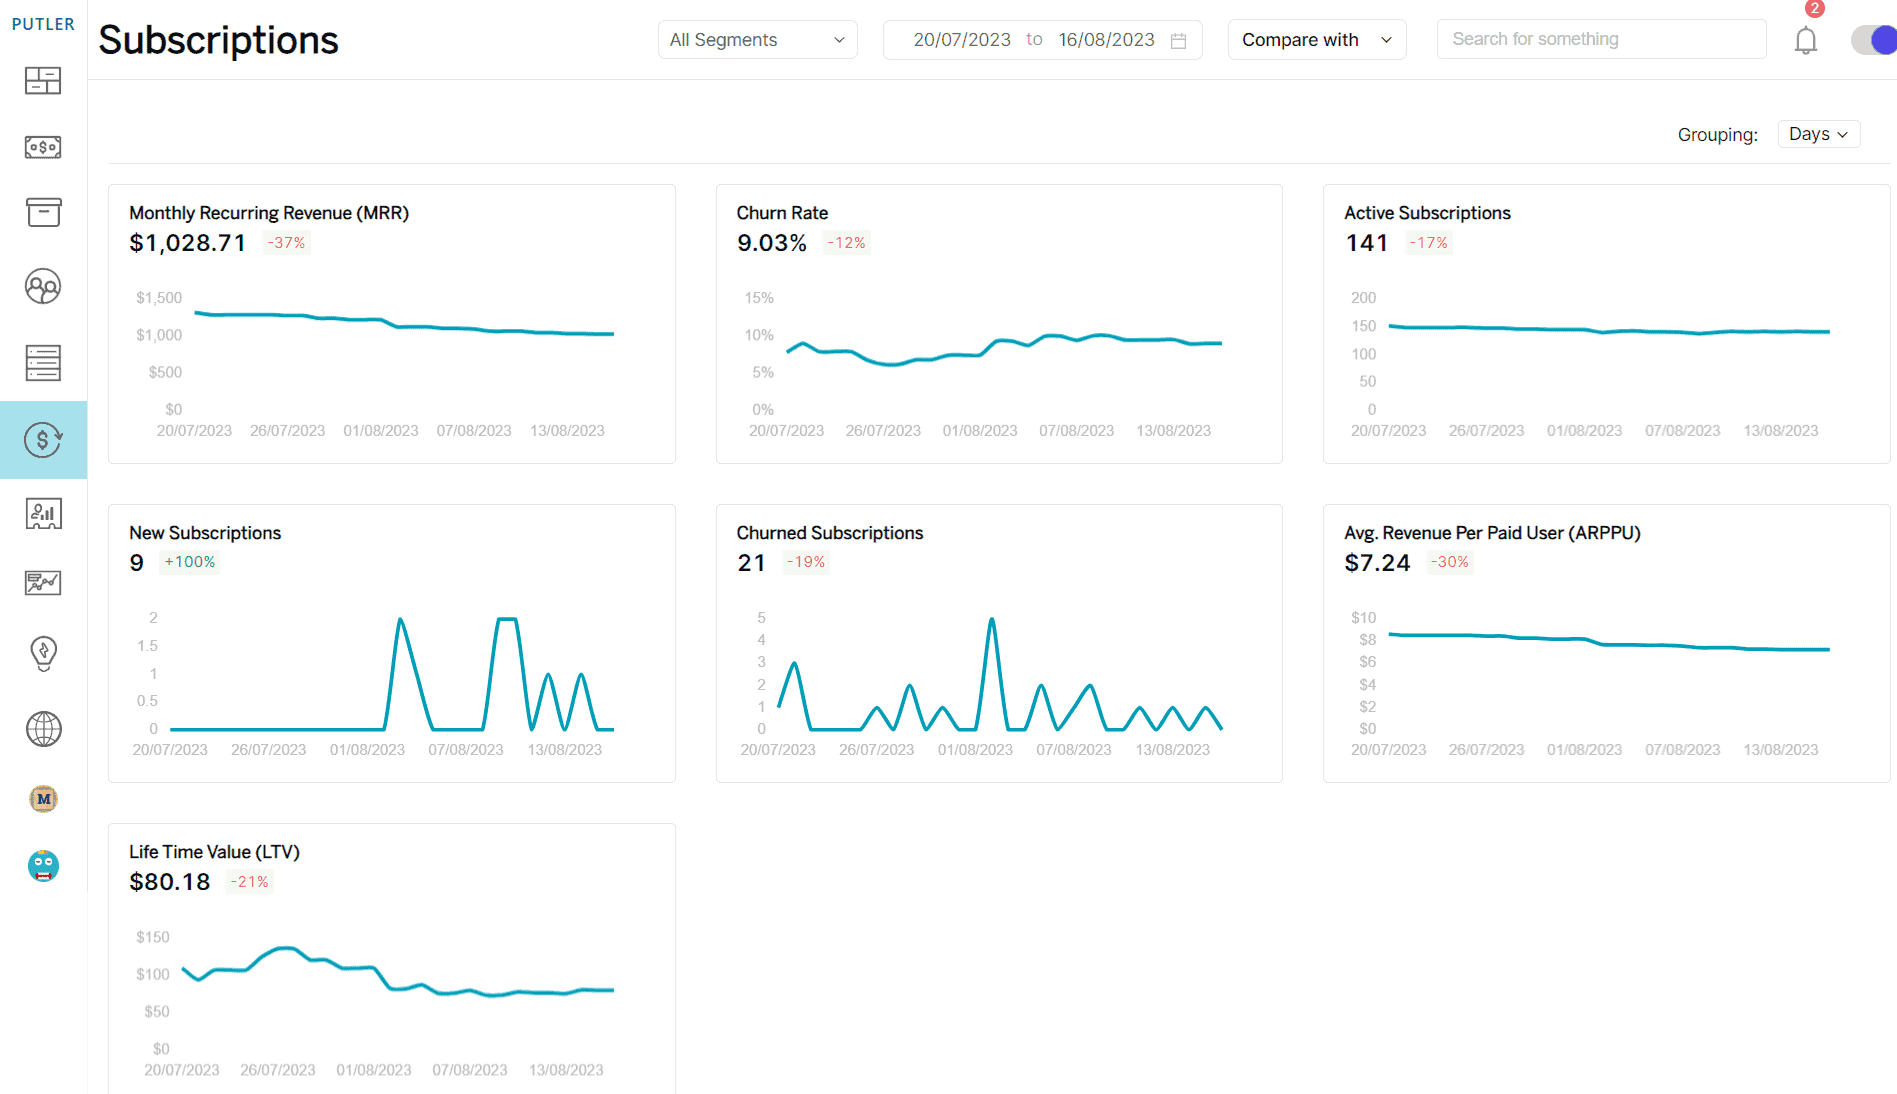
Along with subscription metrics, you also get:
and a lot more…
Thousands of eCommerce and SaaS businesses rely on Putler daily to monitor and grow their business.
Conclusion
Churn will always exist. The goal is not to eliminate it entirely but to understand it, track it accurately, and keep it low enough that your growth outpaces your losses.
Keep improving your product, stay close to your customers, and act on the signals before they become cancellations.
And to observe your customer’s behavior and keep a check on your churn rate, use Putler.
FAQs
Churn is quite a tricky subject which is why we get lots of the same questions on it time and again.
So, Here are the frequently asked questions on churn with our answers.
What’s a good churn rate?
It depends on your company size and stage. Based on data from over 1,000 subscription businesses, small businesses average 7.5% churn, mid-sized companies average 5.2%, and large organizations average 3.8%. For B2B SaaS specifically, the median churn rate in 2025 is 3.5%. If you are below 5%, you are in solid territory. Below 2% monthly puts you in the top 25% of all SaaS companies.
What’s the negative churn rate?
A negative churn rate is considered to occur when added revenue generated from new customers surpasses lost revenue generated from churned customers. It is generally caused by: add-ons, service options, upgrades, etc.
Does churn rate impact retention?
As churn rate is the inverse of retention so we can say that it does affect retention. The customers that are not retained are churn by default.
How to calculate customer lifetime value (CLV) from churn rate?
To calculate CLV, you need to use this formula:
CLV = Average Revenue per Customer / Churn Rate
How to reduce the churn rate?
As already discussed in the article, an increased churn rate indicates customer dissatisfaction and loss of trust in your product or service.
Therefore, to reduce it, you need to focus on improving customer satisfaction, provide exceptional customer support, and offer incentives for loyalty.
What does a high churn rate mean?
When you have a high churn rate, it means that a lot of customers are leaving your business or stopping using your product. It’s like having a leaky bucket – customers are leaving faster than you can add new ones.
This could indicate issues with your product, customer service, overall marketing, selling or how you engage with customers after they sign up.
What is the difference between the Churn Rate and the Growth Rate?
The churn rate measures how many customers stop using your product over a period, usually a month or a year.
It shows how well you’re retaining customers. On the other hand, the growth rate measures how much your customer base is expanding. It reflects how successful you are at acquiring new customers.
Ready to conquer churn rate and supercharge your business growth?
Implement these strategies today and start reducing customer attrition with Putler. Take action now! No credit card is required.