
As business owners, we try hard to improve the performance of our business year on year. We compare numbers for various periods and try measuring the growth that has been achieved.
But this isn’t a simple process.
Often we either lack the right tools or have way complicated ones which make the process of analyzing performance time-consuming and stressful. Thus, leaving very little headspace to do the actual work of learning what’s not working and improving it.
If you are in the same boat, this article will change the way you analyze your company’s performance. Keep reading…
Putler’s latest feature makes analyzing a company’s performance super simple. It brings together all the metrics you wish to compare in a single place.
Why is it important to measure performance?
One of the most necessary catalysts to grow is to compare.
Only when we compare our growth to that of our competitors or our current performance to past achievements, we ignite the fire to grow and achieve bigger goals.
Now though this seems to be a solid concept, businesses struggle with creating performance reports. So we did something special!
We created ‘Performance Comparison Insights’ within Putler.
Introducing comparison reports for your business

Business managers, entrepreneurs, marketing executives, etc. often do a performance comparison to know the pulse of their business.
Now if they don’t have Putler, they usually need to collect data from various departments, dig into the data, create reports, and combine key findings.
But with Pulter’s powerful ‘Performance Comparison’, this tool will allow you to create comparison insight reports within a matter of seconds.
All important performance metrics in a single place
A comparison of key performance metrics is good. But viewing all the essential metrics in one go is even better, right?
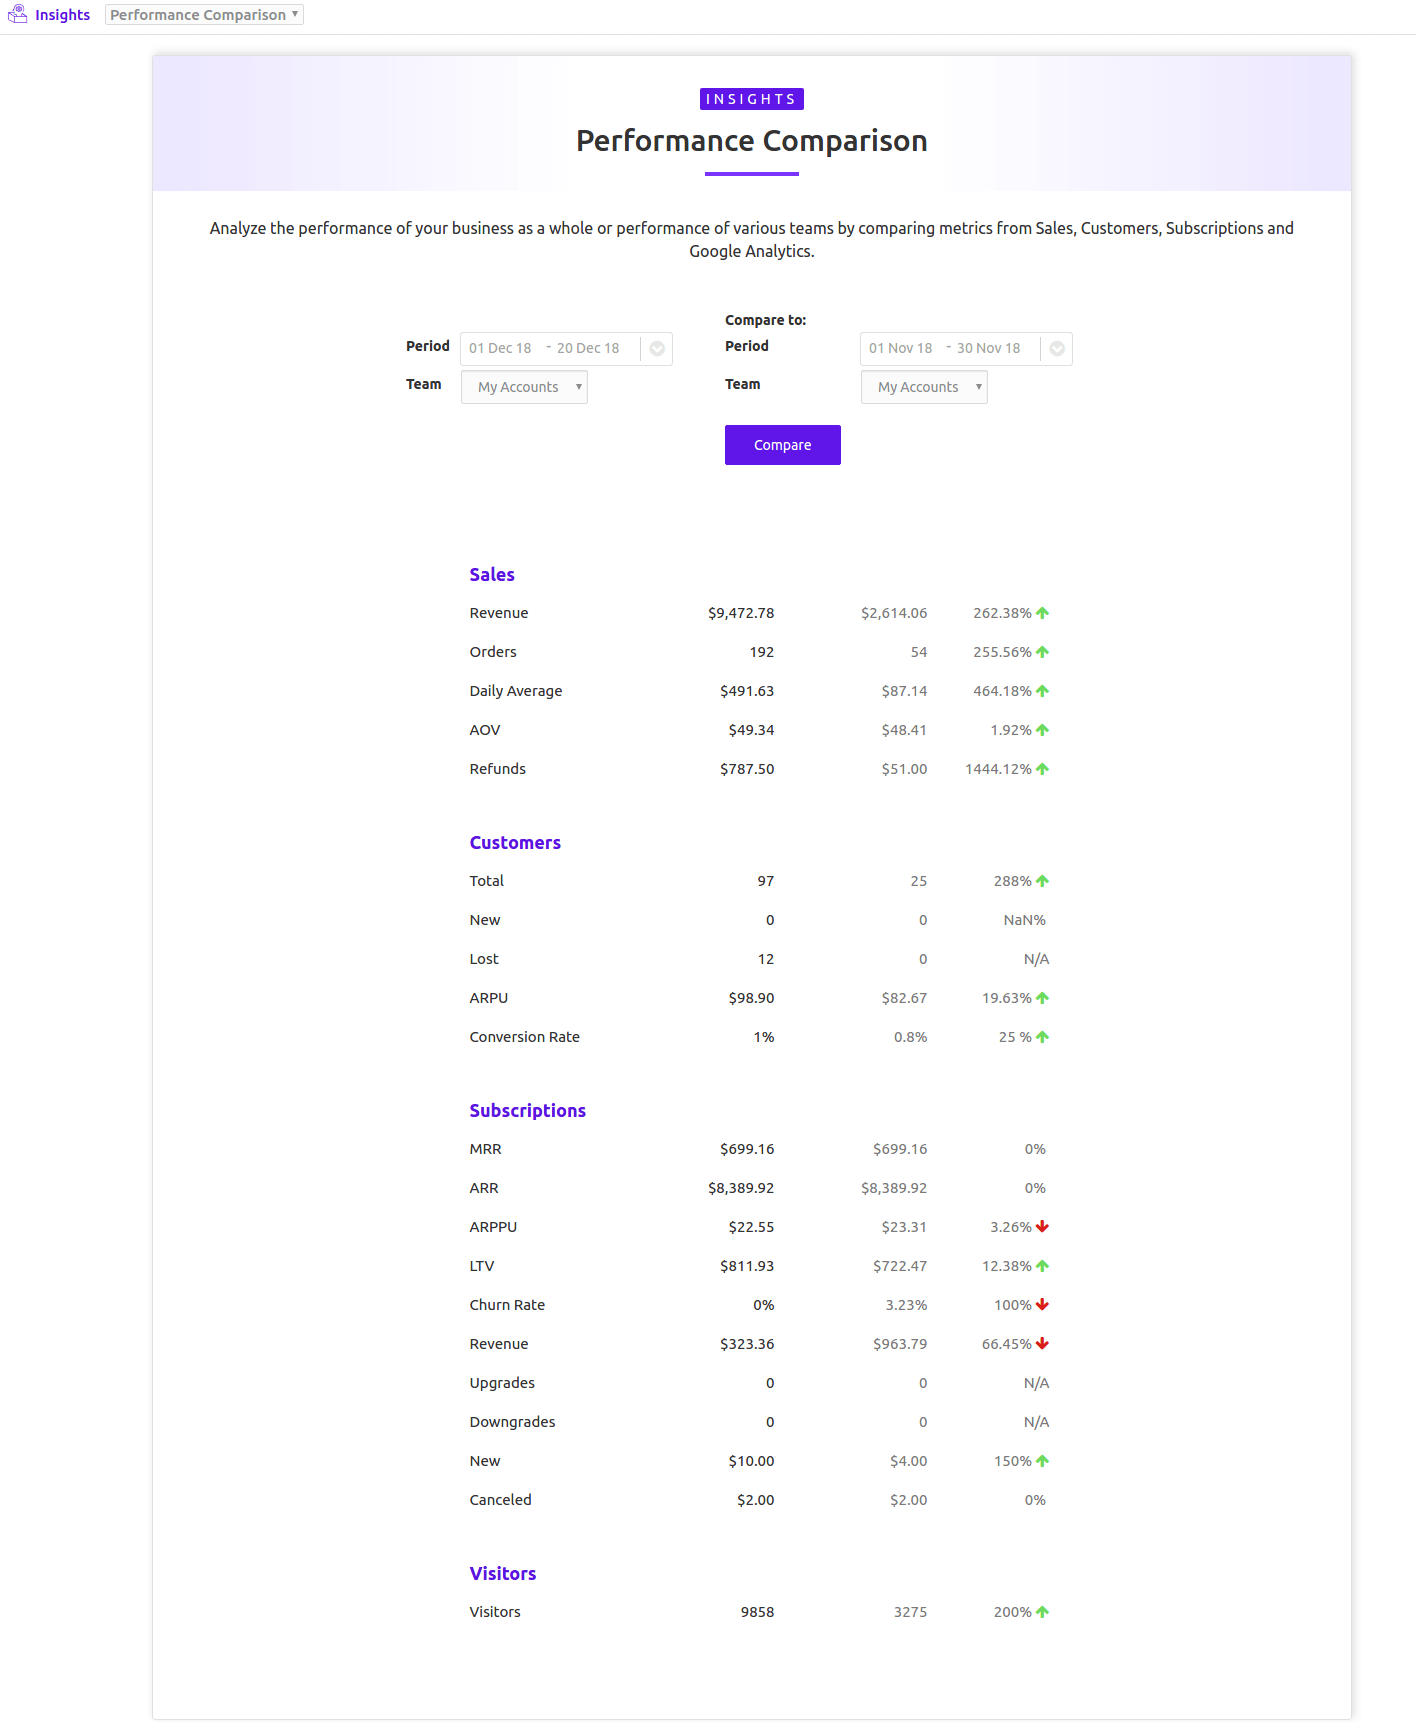
Putler’s performance reports pull in the required data from multiple aspects of your business – sales, customers, subscriptions, and website traffic and put it together in a single place.
Thus saving you time and effort.
How to view performance reports in Putler?
Step 1: Go to the Insights Dashboard in Putler and select ‘Performance Comparison’ from the drop-down given at the top..
Step 2: Select the date range you want to compare the performance for.
Step 3: Select the teams you want to compare the performance metrics of.
Step 4: Click ‘Compare’.
That’s it! Putler will pull in the performance metrics in seconds and display them on your screen.
Infinite comparison…(literally!)
You must be wondering what can you compare in this report, right? The answer is everything…
You can compare the performance of:
- The entire business during different periods
- Different accounts in the same/different time periods
- Different payment gateways
- Different e-Commerce stores
Let’s take it one by one:
Compare your entire business
Many of us like to compare how our business performs periodically – monthly/ quarterly/ half yearly/ yearly. Using Putler’s Performance Comparison you can view such reports in mere seconds.

All you do is select ‘My Account’ and select the dates you want the comparison to be performed. Here, we are viewing ‘Quarterly reports’.
- The ‘My Account’ is ideally the business account that has all the data sources checked in.
- You can compare the performance of any other team (or Strategic Business Unit (SBU)) during different periods similarly.
Compare different accounts/ teams/ SBU’s
Another way to use this feature is by comparing different accounts/ teams/SBUs. Either for the same period or during different time periods.

Suppose you have 2 businesses A and B. And you have created two teams in Putler.
Team 1 – Business A and Team 2 – Business B.
You can select both these teams and then select either the same date range or a different date range and view which business performed better.
Compare different payment gateways
One dilemma we store owners have is to decide on which payment gateway to remove and which to keep on our website. But not anymore…
Putler’s Comparison dashboard solves this issue.

Firstly you need to configure the payment gateways as separate teams.
For example – Team 1 – PayPal and Team 2 – Stripe. Once done, select the teams and compare their past performance (preferably in the same date range).
Then look at how both the payment gateways perform in terms of the number of orders, revenue, refund rate, upgrades, LTV, etc.
Once you figure out which payment gateway is the most preferred by your customers, stick to that.
Compare different E-Commerce stores
Just like payment gateways, you can compare the performance of eCommerce systems too.

Suppose, you have multiple stores like Shopify Store US and Shopify Store UK.
Select both these stores as individual teams and the date range you want to view the comparison for and compare.
Putler will instantly pull in all the performance metrics and you can then decide which store is performing better.
Compare different segments
If you need to compare the performance of your segments, Putler makes it incredibly simple. For instance, suppose your product is Putler Starter, and you want to compare its performance in the UK across Amazon and your WooCommerce store.
All you need to do is:
- Select the Date Ranges: Pick the time periods you want to compare.
- Choose the Product and Platforms: Select Putler Starter, along with Amazon and WooCommerce.
Within seconds, Putler will generate a detailed comparison report, showing you how the product performed across the two platforms.
Note: Before comparing, make sure you’ve created these segments in Putler. Segments act as customized data sets that group-specific products, platforms, or other criteria, making comparisons seamless.
By comparing segments, you can easily identify where your product performs best and make informed decisions to optimize your strategy.
Why you should try Putler’s performance comparison?
- Huge time-saver – As all the important metrics are displayed in a single place it saves the time spent on navigating through dashboards, jotting down KPIs, calculating performance differences, etc.
- Take faster decisions – Don’t waste time thinking about which dashboard to go to or which KPI to look at. Instead, spend time creating and executing strategies. The Performance Comparison insight has all the important performance metrics that are essential to make critical decisions.
- Know the pulse of your business yourself – Don’t wait for an analyst to create and interpret complex reports. Instead, use Putler’s user-friendly Performance Comparison insight and know what’s working for your business instantly.
Over to you
That’s it, folks! We tried reducing the stress that comes along with analyzing your business performance. Putler’s comparison reports are simple, straightforward and quick.
I’m sure once you give the Performance Comparison insight a look you will resonate with whatever I’ve spoken of in this article.
I’m hoping you try it right away and send me your most honest reviews in the comment section below.