
In the dynamic world of business, early sales projections are no longer sufficient. Precision matters as you grow.
What if your business, be it eCommerce or SaaS, needs capital to fuel its expansion? Investors want reliable revenue forecasts, not just promises.
And, it’s not just about investors; it’s about making smart choices.
When to hire? How much for marketing? The answers lie within churn analytics — a tool that goes beyond measurement, guiding you in predicting retention and revenue.
This is where Putler excels, offering specialized churn analytics that drive growth.
Join us to explore the power of churn analytics, its methodologies, and its real-world impact.
Let’s start.
What is churn analytics?
Churn analytics is a method designed to understand and measure why your current customers are deciding to stop using your product.
The main aim of analyzing customer churn data is to identify the root causes behind these occurrences. This analysis equips businesses to take proactive steps, retaining customers, and enhancing overall loyalty.
Why is it important to track churn analytics data?
Churn analytics guides your ship through the turbulent waters of customer retention and revenue projections.
By embracing churn analytics, businesses can gain:
- Precise insights for informed decisions: Predict early warning signs of customer dissatisfaction, enabling proactive measures to prevent churn.
- Tailored customer retention strategies: Understand different segments of your customer base, crafting personalized strategies to keep each segment engaged and satisfied.
- Maximizing customer lifetime value: Address the root causes of churn, enhance customer experience, and extend the lifetime value of customers.
- Optimizing resource allocation: Allocate business resources wisely by identifying areas where they are needed the most, and making data-driven choices for efficient growth.
- Fueling growth and innovation: When churn is under control, your business gains stability. With a steady customer base, you can confidently explore new avenues for growth and innovation.
Launching a new product? Expanding into a new market? Churn analytics lays a strong foundation for well-calibrated growth strategies.
But remember, these advantages are just the beginning.
Let’s take a closer look at the metrics and indicators that make churn analytics a transformative force for businesses like yours.
What are the reasons for customer churn?
Churn, as you’ve discovered, isn’t as simple as a straight line on a map. It’s more like a puzzle with various pieces – and these pieces can vary for different groups of users.
Let’s understand the common sources of churn.
- Cost: People leave when it costs too much for what they get.
- User Interface and Experience: If using your product is confusing or unpleasant, they’ll go.
- Onboarding Experience: If starting is hard, they might give up.
- Competition: Better options elsewhere catch their eye.
- Lack of Features: If it’s missing what they need, they’ll leave.
- Perceived Value Loss: If they don’t see it as valuable anymore, they’re gone.
- Product/Market Fit: If your product doesn’t match what they want, they’ll look elsewhere.
The good news?
There’s always room to raise the anchor and set a better course. By gathering user feedback and pinpointing friction points, you can chart a smoother path.
But, when it comes to high churn, two main culprits emerge from the shadows:
- Downgrades: Customers shifting to lower plans due to pricing concerns or finding satisfaction in features offered at lower tiers.
- Cancellations: When the product doesn’t function properly, customers find a better alternative or poor customer service dampens the journey.
No matter the reason, churn is a storm to weather.
But with Putler at your side, you’re armed with real-time metrics to analyze issues and steer your business to smoother waters.
And, your actions when driven by Putler’s insights, can help you navigate these waters and set a course for smoother sailing.
How to perform customer churn analysis?
Imagine having a trustworthy co-pilot who can decipher the reasons behind customer departures – that’s churn analytics.
When you integrate this tool with your business support systems, it’s like having a detective’s magnifying glass.
It delves deep into why churn happens, tracking user actions to uncover the journey before the farewell.
Now, let’s explore the three churn types companies can keep track of.
- Subscription Churn
For companies that offer subscription-based services, subscription churn marks a pivotal point. It’s the moment a customer decides to cancel or suspend their recurring payment plan.
Think of a user ending their subscription to a news website, SaaS product, or fitness app.
To measure subscription churn, it’s a straightforward equation:
Number of customers that quit / Total number of customers over a specific time period
- Non-Subscription Churn
Non-subscription churn is a tad trickier to measure.
This applies to eCommerce entities and ad-supported news sites that thrive on a consistent influx of recurring visitors.
Here, churn is defined as the percentage of those visitors who don’t return within weeks or months.
Keep in mind the concept of rotational churn, where churned visitors might make a return appearance and no longer count as churned.
The measurement equation for non-subscription churn looks like this:Percentage of customers that have dropped below the threshold and are considered inactive within a specific time period
- Revenue Churn
For SaaS companies, revenue churn takes center stage.
It gauges the percentage or dollar value of revenue that’s churned over a designated time period.
The equation to measure revenue churn is as follows:
Amount of recurring revenue lost / Total amount of recurring revenue at the beginning of the period
These forms of customer churn analysis empower businesses to truly understand the dynamics of their customer relationships.
Whether it’s tracking subscription cancellations, monitoring non-subscription visitor behavior, or measuring revenue loss, churn analytics provides a roadmap for enhancement.
But, predicting and understanding churn often turns out to be very difficult. Let’s understand why.
Important customer churn metrics to track
Now it’s time to delve into the heart of the matter – the key metrics and indicators that illuminate the path to understanding and mitigating churn.
These metrics act as beacons, shedding light on the performance of your business and the loyalty of your customers.
So, let’s unfurl the map and embark on this enlightening journey.
Churn Rate
In a nutshell, churn rate is nothing but the ebb and flow of a tide. It can either gently carry customers away or crash down like a wave, washing them out.
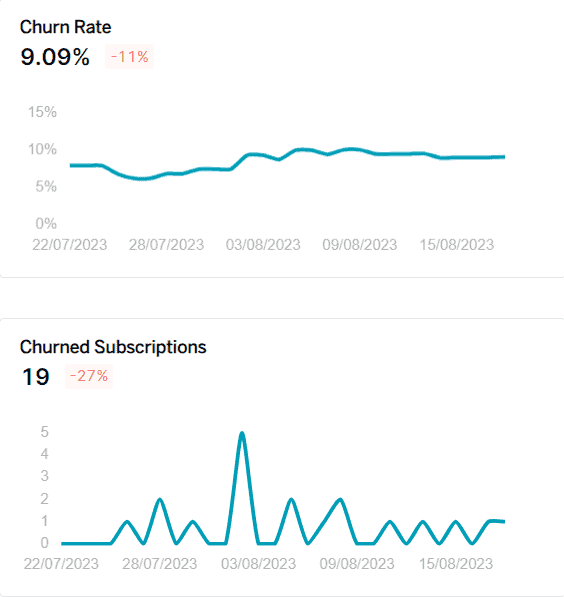
Yes, churn rate measures the percentage of customers who cut ties with your business within a specific time frame.
Calculated by dividing the number of departing customers by the total at the start and multiplying that by 100, this metric provides insights into customer loyalty and the effectiveness of your retention strategies.
A steady churn rate signals smooth sailing, while a high rate indicates leaks in your ship. It’s a crucial metric to grasp customer attrition and make informed decisions about keeping your business afloat.
You can check out this article of ours to get into the depths of churn rate.
Customer Lifetime Value
Customer Lifetime Value (CLTV) is your business’s North Star.
CLTV isn’t just about tallying up earnings. It’s a strategic tool that goes beyond. It calculates the total revenue a customer generates throughout their entire journey with you.
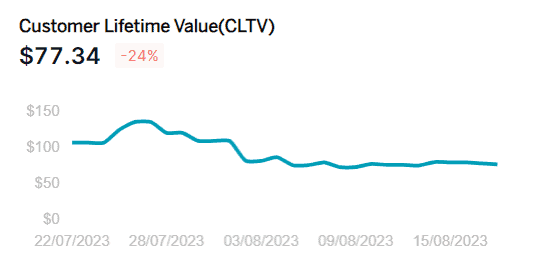
This not only helps distinguish your most valuable customers from the rest but also acts as a compass for tackling churn and making strategic decisions.
Think about it – by understanding CLTV, you can direct your resources toward the customers who bring in the most treasure over the long haul.
It guides you in deciding where to focus your efforts, whether on retention strategies, customer support enhancements, or product improvements.
So, while CLTV illuminates the path to identifying high-value customers, it also holds the key to managing churn and steering your business toward smart and successful decisions.
Cohort Analysis
Ever wondered what if you could travel back in time to witness how your customers behaved when they first set foot on your ship?
Cohort analysis lets you do just that.
It groups customers who came aboard around the same time and analyzes their behavior over time.
This time-traveling tool helps you spot trends, understand when churn spikes, and tweak your strategies accordingly.
With cohort analysis, you gain valuable insights into the evolving behavior of your customers. This helps you to navigate through choppy churn waters with precision and adapt your course for maximum success.
These metrics are the navigational tools that help you steer clear of churn’s treacherous currents.
They form the backbone of your churn analytics strategy, guiding you to make informed decisions and setting a course for lasting customer relationships.
So, let’s go further in understanding when you should deploy your customer churn analytics strategy.
When to deploy customer churn analytics?
Deploying customer churn analytics strategically is crucial for effective retention strategies. The timing of deployment depends on the business’s specific circumstances and goals.
Here are key phases when deploying churn analytics proves beneficial:
- The early phase: Right from the start of a new business or project, laying the groundwork for churn analytics to spot red flags and build strategies.
- The growth period: As the business grows, deploying churn analytics becomes essential to navigate wisely, fine-tune strategies, and maintain customer loyalty.
- The turning point: When churn rates rise and challenges arise, churn analytics helps identify the causes and tweak retention strategies for customer retention.
- The exploration phase: Venturing into new markets or launching innovative products, churn can get unpredictable. New customer behaviors and expectations can throw you off course. This is when churn analytics acts like a compass. It guides you through the unknown by showing how changes affect churn.
Each business’s journey is unique.
The timing of deploying customer churn analytics depends on your specific circumstances and goals.
Customer churn analytics examples
Churn analytics isn’t limited to a single industry or business model; it’s a versatile metric with applications that span various sectors. Let’s explore how businesses across different industries leverage the churn analytics metric to their advantage:
- Financial Services: Measure the entire lifecycle of account holders, identifying those considering switching banks.
- Consumer Tech: Measure app churn, pinpoint reasons behind app abandonment, and implement improvements.
- Consumer Packaged Goods: Develop effective support models that ensure customer engagement, reducing the likelihood of churn.
- Healthcare: Calculate the value of patients lost to other providers, enhance experiences, and prevent attrition.
- Life Sciences and Manufacturing: Measure churn among buyers of devices and equipment, leading to refined strategies.
- Energy: Measure revenue at risk of being lost to other providers, optimizing strategies to retain customers.
- Retail and eCommerce: Predict high churn risks using this metric, implementing targeted retention efforts.
- Insurance: Predict a user’s likelihood to close a policy, and enable tailored interventions.
- Telecommunications: Detect instances where customers are considering switching carriers, enabling prompt responses.
- Media and Entertainment: Measure subscriber churn, and improve content and engagement strategies.
- Travel: Identify areas for improvement and tailor marketing strategies.
Churn analytics adapt to your unique business context, offering key insights that drive business growth.
Why is it difficult to predict churn?
While the idea of foreseeing future customer behavior is enticing, the reality is far from simple.
Much like the unpredictable waves of the sea, churn prediction is influenced by many factors that can overturn even the most well-crafted strategies.
Let’s navigate through why predicting churn is so tricky.
- Past ≠ Future
Relying solely on past data for churn prediction is a bit like using old maps to plan a journey – it might work, but it might not. The future might mimic the past, but it’s not etched in stone.
Unexpected events, like new competitors emerging or sudden market shifts, can upend old models, leading businesses astray.
- Figuring out individual trends
What if your churn analytics says there’s a 30 percent chance of a specific customer churning?
Here comes the hard part – what action should you take?
While large-scale trends might make sense for an entire population, applying them to individuals is like trying to predict the exact path of every wave in a storm.
Deciding how to react to this uncertainty can be tough, especially for customer service teams who need to turn numbers into actions.
- The limited scope
Think of trying to read a map with only a few landmarks marked.
Often, businesses apply churn analytics to a narrow set of data, which is like trying to navigate with just a fragment of the map.
For instance, focusing solely on the last interaction with a customer might give you a distorted perspective.
A call to cancel a subscription might seem like the cause, but it’s often a symptom of deeper issues that have been building up.
Today, businesses need to map out every high and low point of customer interactions. Only then you can uncover the real reasons beneath the surface.
With all this complexity, churn rate might seem difficult to understand for a lot of business owners. Let’s talk about it.
How to reduce customer churn rate with Putler?
High churn rate can feel like slamming the brakes on growth.
But fear not – a fix is within reach. It’s all about having the right strategy driven by the right data.
Imagine using insights to mend the gaps that make users exit. Well, that’s where Putler comes in – armed with the data to cut churn and boost retention.
Now, let’s spill the secret sauce and brainstorm some swift moves that can take your churn rate from high to low:
- Encourage annual contracts
Swap out monthly subscriptions for yearly plans. By understanding user behavior and tempting them with irresistible offers, you reduce churn. - Reduce the delinquency rate
Smooth sailing payments matter. Make sure online payments are seamless to dodge credit card hiccups and give users a seamless experience. - Improve communication
Keep the channels open. Welcome emails, empathy-laden grievance handling, and courteous conversations go a long way in taming churn. - Prompt customer support
When issues arise, be a quick responder. Transparency, speedy resolution, and dedicated teams can turn the tide in your favor. - Identify market needs and innovate
To outshine competitors, stay on the lookout for shifting market needs. Keep your offerings fresh with innovative features and services. - Incentivize loyal customers
Acknowledge loyalty with exclusive deals, special discounts, or upgrades. These perks boost motivation and retention among your prized customers. - Create a tailored approach
Customize your tactics for different customer groups – the loyal, the new, and those considering jumping ship. Tailor-made plans work wonders.
Reducing churn isn’t a myth; it’s a mission. Putler equips you with the tools to mend the sails, navigate the choppy waters, and keep your customers aboard.
But, do keep in mind that Putler’s churn analytics report is only based on Stripe, WooCommerce, EDD, Braintree, and Authorize.Net data.
Summing it up!
And there you have it – the compass to navigate the waves of churn.
As you’ve seen, churn analytics isn’t just about numbers; it’s your co-pilot in the quest for business triumph.
With Putler, you’re charting a course to smoother seas, guided by insights and strategies that ensure your success stays on course.
From plugging leaks to rewarding loyalty, Putler’s churn analytics arm you with strategies to keep your ship afloat.
So, whether you’re charting new waters or taming the storm, remember: reducing churn is the compass that guides you to smoother seas and greater success.
With insights in hand, let your business journey continue – waves conquered, sails steady, and success on the horizon.
Anchors aweigh!