
Thirty years ago, in the early days of the digital landscape, understanding user behavior was different—no emails for inquiries or YouTube tutorials, just a deliberate process involving mentors and books.
Fast forward to today, with a wealth of information at our fingertips, everything has changed.
With the advent of AI (artificial intelligence) and ML (machine learning), we can now use real-time data insights to get predictive analysis and personalized user experience. It acts as a guide for our steps toward understanding user behavior.
And, in this age, decoding user behavior is crucial for business success. User Behavior Analytics (UBA) goes beyond tracking clicks, it looks at the detailed ways customers engage.
This guide serves as your roadmap for mastering customer behavior analytics, demonstrating how to utilize it effectively for the success of your business.
To lay the foundation, let’s dig into the fundamentals of UBA.
What is User Behavior Analytics?
User Behavior Analytics (UBA) involves keeping tabs on user data and actions through monitoring systems. In simple words, it lets you understand how users engage with your product, eCommerce website, or app.
It goes beyond typical marketing analytics by concentrating on the behaviors and patterns that consumers exhibit when actively using your product.
Signups, activation rates, feature usage, effect, funnel drop-off for in-app purchases, and retention rates are all tracked and analyzed in this approach. For example, UBA can help you learn how changes in user interface design affect user engagement or learn about the preferences of specific user segments.
Businesses may become more product-led and customer-experience-driven by analyzing and acting on data produced by user behavior analytics.
Why is user behavior analytics important for businesses?
Unlike website analytics systems like Google Analytics, which largely focus on acquisition and marketing interactions, UBA focuses on existing users.
Actions based on UBA directly influence the customer experience, which is the foundation of success for any business.
This allows for making data-driven decisions about product development and marketing rather than depending on guessing. It’s the best way to improve the overall user experience and achieve business success.
- Amazon
Think of Amazon, the eCommerce behemoth. Amazon continuously refines its platform based on user behavior, offering a personalized shopping experience that keeps customers engaged and loyal.
In Amazon’s case, understanding user behavior means more than just suggesting products. It involves streamlining the entire shopping journey, from the ease of finding items to the simplicity of the checkout process.
By leveraging insights into how users navigate the platform, Amazon enhances not only the shopping experience but also the overall satisfaction of its diverse customer base.
- Netflix
Netflix is one of the favorite OTT platforms of people. If we dig deeper into their success, we will find out how user behavior data helped them to make better decisions.
Originally, it was just a DVD rental store, but this online platform has grown rapidly. During the COVID, it saw a massive growth in subscriptions.
But do you know how? It used its data to understand what its users liked to watch and then make personalized recommendations to keep people engaged.
Additionally, it also customized itself to serve the needs of different countries. For example, providing content in various languages, adjusting as per local preference, etc.
Overall, user behavior analytics helped Netflix make sure that its recommendations as right on the spot and that it can keep its viewers happy and loyal.
- DocuSign
DocuSign is another brand that used customer behavior analytics to improve its conversion rate. It has a freemium plan which there users love. But it wanted to shift its focus to paid plans.
Therefore, they did a funnel analysis to track their user journey and analyze their interaction with the brand. This helped them find features that drive upgrades for their company.
Then they made those features limited to use and this strategy worked. They were able to improve their paid users number.
- ClearCalcs
ClearCalcs is a software for engineering calculations. Years back, it was discovered that their paying customers were not activating their accounts.
This highlighted the need to improve customer satisfaction and retention.
Later they used cohort analysis to understand the activation which revealed that the users were facing difficulty in onboarding.
With the use of Userpilot, they were finally able to streamline their onboarding flows, including initial steps to use the software.
Results? Higher retention rate and better engagement.
- Pictory
Pictory is an AI-powered video editing tool. They wanted to find a solution to drive growth by understanding their users.
They started by segmenting their users based on location, industry, job title, and other factors to identify high-value customers.
They then spend days focusing on these valuable customer segments.
They tailored their marketing and product strategies to serve their needs and were able to improve their conversion rate and higher customer lifetime value.
For businesses, tapping into user behavior insights guides their strategic decisions.
It allows companies to tailor their offerings, improve interfaces, and ultimately provide a customer experience that stands out in the competitive landscape.
Benefits of analyzing user behavior
Insights derived from customer behavior analytics can significantly transform your brand. Let’s delve into these strategic advantages:
- Distinctive Differentiation and Growth
Studying user behavior helps you make a unique and tailored user experience. This not only boosts customer satisfaction but also helps your business grow.
- Agile Development and Innovation
Analyzing user feedback helps identifying the most valuable features and areas for improvement. This ensures your product upgrades are data-driven and aligned with the users’ needs.
Moreover, understanding how users react to changes lets you speed up development and innovation. It keeps your product or service fresh, dynamic, and competitive.
Overall it leads to a more intuitive and user-friendly product.
- Smart Decision-Making
A thorough understanding of how users behave helps you validate ideas before a full-scale launch. This helps you minimize the chances of investing in the wrong features and makes your innovation smarter.
- Enhanced User Trust and Loyalty
User behavior insights don’t just boost satisfaction; they build trust and loyalty. When users feel that their experience is personalized and tailored just for them, they’re more likely to stick around, becoming long-term fans of your brand.
- Overall Improvement of Performance Metrics
Customer behavior analytics contribute to an overall improvement in key performance metrics, like performance testing ensure optimal functionality. It fine-tunes strategies for better outcomes—more money, happier customers, and improved customer loyalty.
-
In addition to these overarching benefits, here’s a deeper look at why user behavior analytics is a game-changer:
- Proactive Customer Support
Understanding user behavior helps not only solve but also prevent problems. Being proactive in addressing potential issues highlighted by user behavior fosters exceptional customer support, cultivating a positive brand image.
- Reducing Bias in Decision-Making
For marketers, behavioral analytics serve as a reality check, helping to overcome cognitive biases. It encourages a more objective understanding of user behavior, steering clear of preconceived notions and ensuring data-driven decision-making.
- Enhanced Conversion Rates and Revenue Streams
Figuring out where users struggle can make your business way more effective. This insight allows for strategic adjustments, resulting in improved conversion rates and increased revenue streams, ensuring a more profitable and efficient operation.
- Continuous Iteration for Design and User Experience
Whenever you add something new, user behavior shows you how users interact with new features or changes. The process of refining your product or service never stops. This enables an iterative approach to design and user experience improvements.
- Swift Identification and Resolution of Friction Points
User behavior info helps you catch problems early. This makes sure businesses can maintain customer satisfaction and safeguard their reputation.
- Improved Marketing
User behavior analysis provides deep insights into your customer preferences and likings. It also helps craft highly targeted campaigns that resonate with specific segments.
Overall it helps marketers optimize their customers’ journeys and ensure that their strategies align with the user needs, ultimately increasing engagement rates.
- Boosted Sales
UBA helps streamline lead qualification and boost their efficiency.
By identifying potential leads based on their engagement and reaction, sales teams can focus their effort on the prospects who are most likely to convert.
Also, it has enabled personalized outreach allowing sales representatives to tailor their patches and increase the conversion rate.
- Targeted Content Creation
Customer behavior analytics can help tell you which type of content resonates with your target audience.
It helps identify the best content format, topic, and channels so that you can optimize a content strategy and produce engaging and relevant materials.
For example, if your product is doing good on Instagram you can make more content related to that and increase your brand awareness and engagement levels.
All these benefits make analyzing user behavior a key to boosting your business, but first, you need to know what key metrics you need to keep an eye on.
Key metrics for collecting user behavioral data
Here are key metrics to capture and analyze for comprehensive insights –
- Churn Rate – It is the percentage of users lost during a specific period. Losing users is a natural occurrence, but effective management based on churn rate can minimize the impact.
- MRR (Monthly Recurring Revenue) and ARR (Annual Recurring Revenue) – MRR and ARR are the monthly and annual recurring revenue generated by your product, respectively. Monitoring these metrics provides a clear picture of your product’s financial health over different time frames.
- Returning Customers – This is the number of customers who come back for repeated interactions. It indicates the level of satisfaction and loyalty among your user base.
- Customer Lifetime Value – CLTV or CLV is the total revenue anticipated from a customer throughout their entire relationship with your product. It lets you assess the long-term value a customer brings to your business, guiding strategic decisions.
- Average Revenue Per Paid User (ARPPU) – ARPPU is the average revenue generated per user who pays for your product or services. This metric highlights the average contribution from paying users, aiding in pricing and marketing strategies.
- AOV (Average Order Value) – This key metric tells you about the average value of each transaction or order placed. It indicates spending patterns, assisting in optimizing pricing and promotions.
But before you start digging deeper into these metrics, it’s crucial to be aware of common mistakes that businesses may encounter in the process.
Common mistakes when analyzing user behavior
Avoid these pitfalls when diving into user behavior analytics:
- Relying on vanity metrics
Setting vague metrics like increased revenue without clear actionable steps can hinder progress. Align goals with specific Key Performance Indicators (KPIs) for profitability.
- Not validating assumptions
Make it a practice to validate assumptions regularly. Relying on assumptions without validation can lead to inaccurate analyses and misguided decisions.
- Overloading with new features
Launching too many features simultaneously complicates analysis. Each feature requires a thorough evaluation, and an excessive load can blur the overall picture.
- Improper event instrumentation
Establishing and enforcing data governance rules is crucial when instrumenting events. A solid implementation is fundamental for successful tracking customer behavior analytics.
- Tracking too many events initially
Focus on key events initially (around 20 to 30) to gauge impact. Additional events can be added later for a more streamlined analysis.
- Limited team involvement
Analytics isn’t exclusive to product teams and data scientists. Democratize data access to involve teams like UX/UI design, marketing, sales, support, and leadership in understanding the user journey.
- Relying on surface-level tools
Auto-tracking or marketing tools provide only surface-level insights. User analytics tools focus on the product experience and buyer’s journey for sustained growth.
Finally, remember to choose tools that integrate seamlessly across your tech stack to avoid creating data silos and ensure efficient data management.
A user behavior analytics software that excels in this regard is Putler. Let’s understand how it can facilitate your path towards analyzing user behavior better.
How to analyze user behavior with Putler?
You already know that analyzing user behavior is a crucial step toward refining your business strategy.
Putler simplifies this process with its intuitive features. Here’s a step-by-step guide on how you can leverage Putler for effective user behavior analysis:
Subscription Analytics
A crucial aspect of user behavior analytics is getting subscription analytics right.
And this is where Putler can be of massive help. This tool provides specialized analytics for – churn rates, ARR, MRR, active subscriptions, paid subscriptions, churned subscriptions, ARPPU, and LTV. These analytics can help you optimize subscriptions for maximum profitability.
Data Integration
You can seamlessly connect 17+ data sources and keep an eye on them, all at once.
Aggregate customer data from your eCommerce stores – WooCommerce, Amazon, Etsy, eBay, etc., payment gateways – PayPal, Stripe, Braintree, Razorpay, and more, or other data streams. You can effortlessly integrate and monitor all relevant data from one unified platform.
Dedicated Dashboards
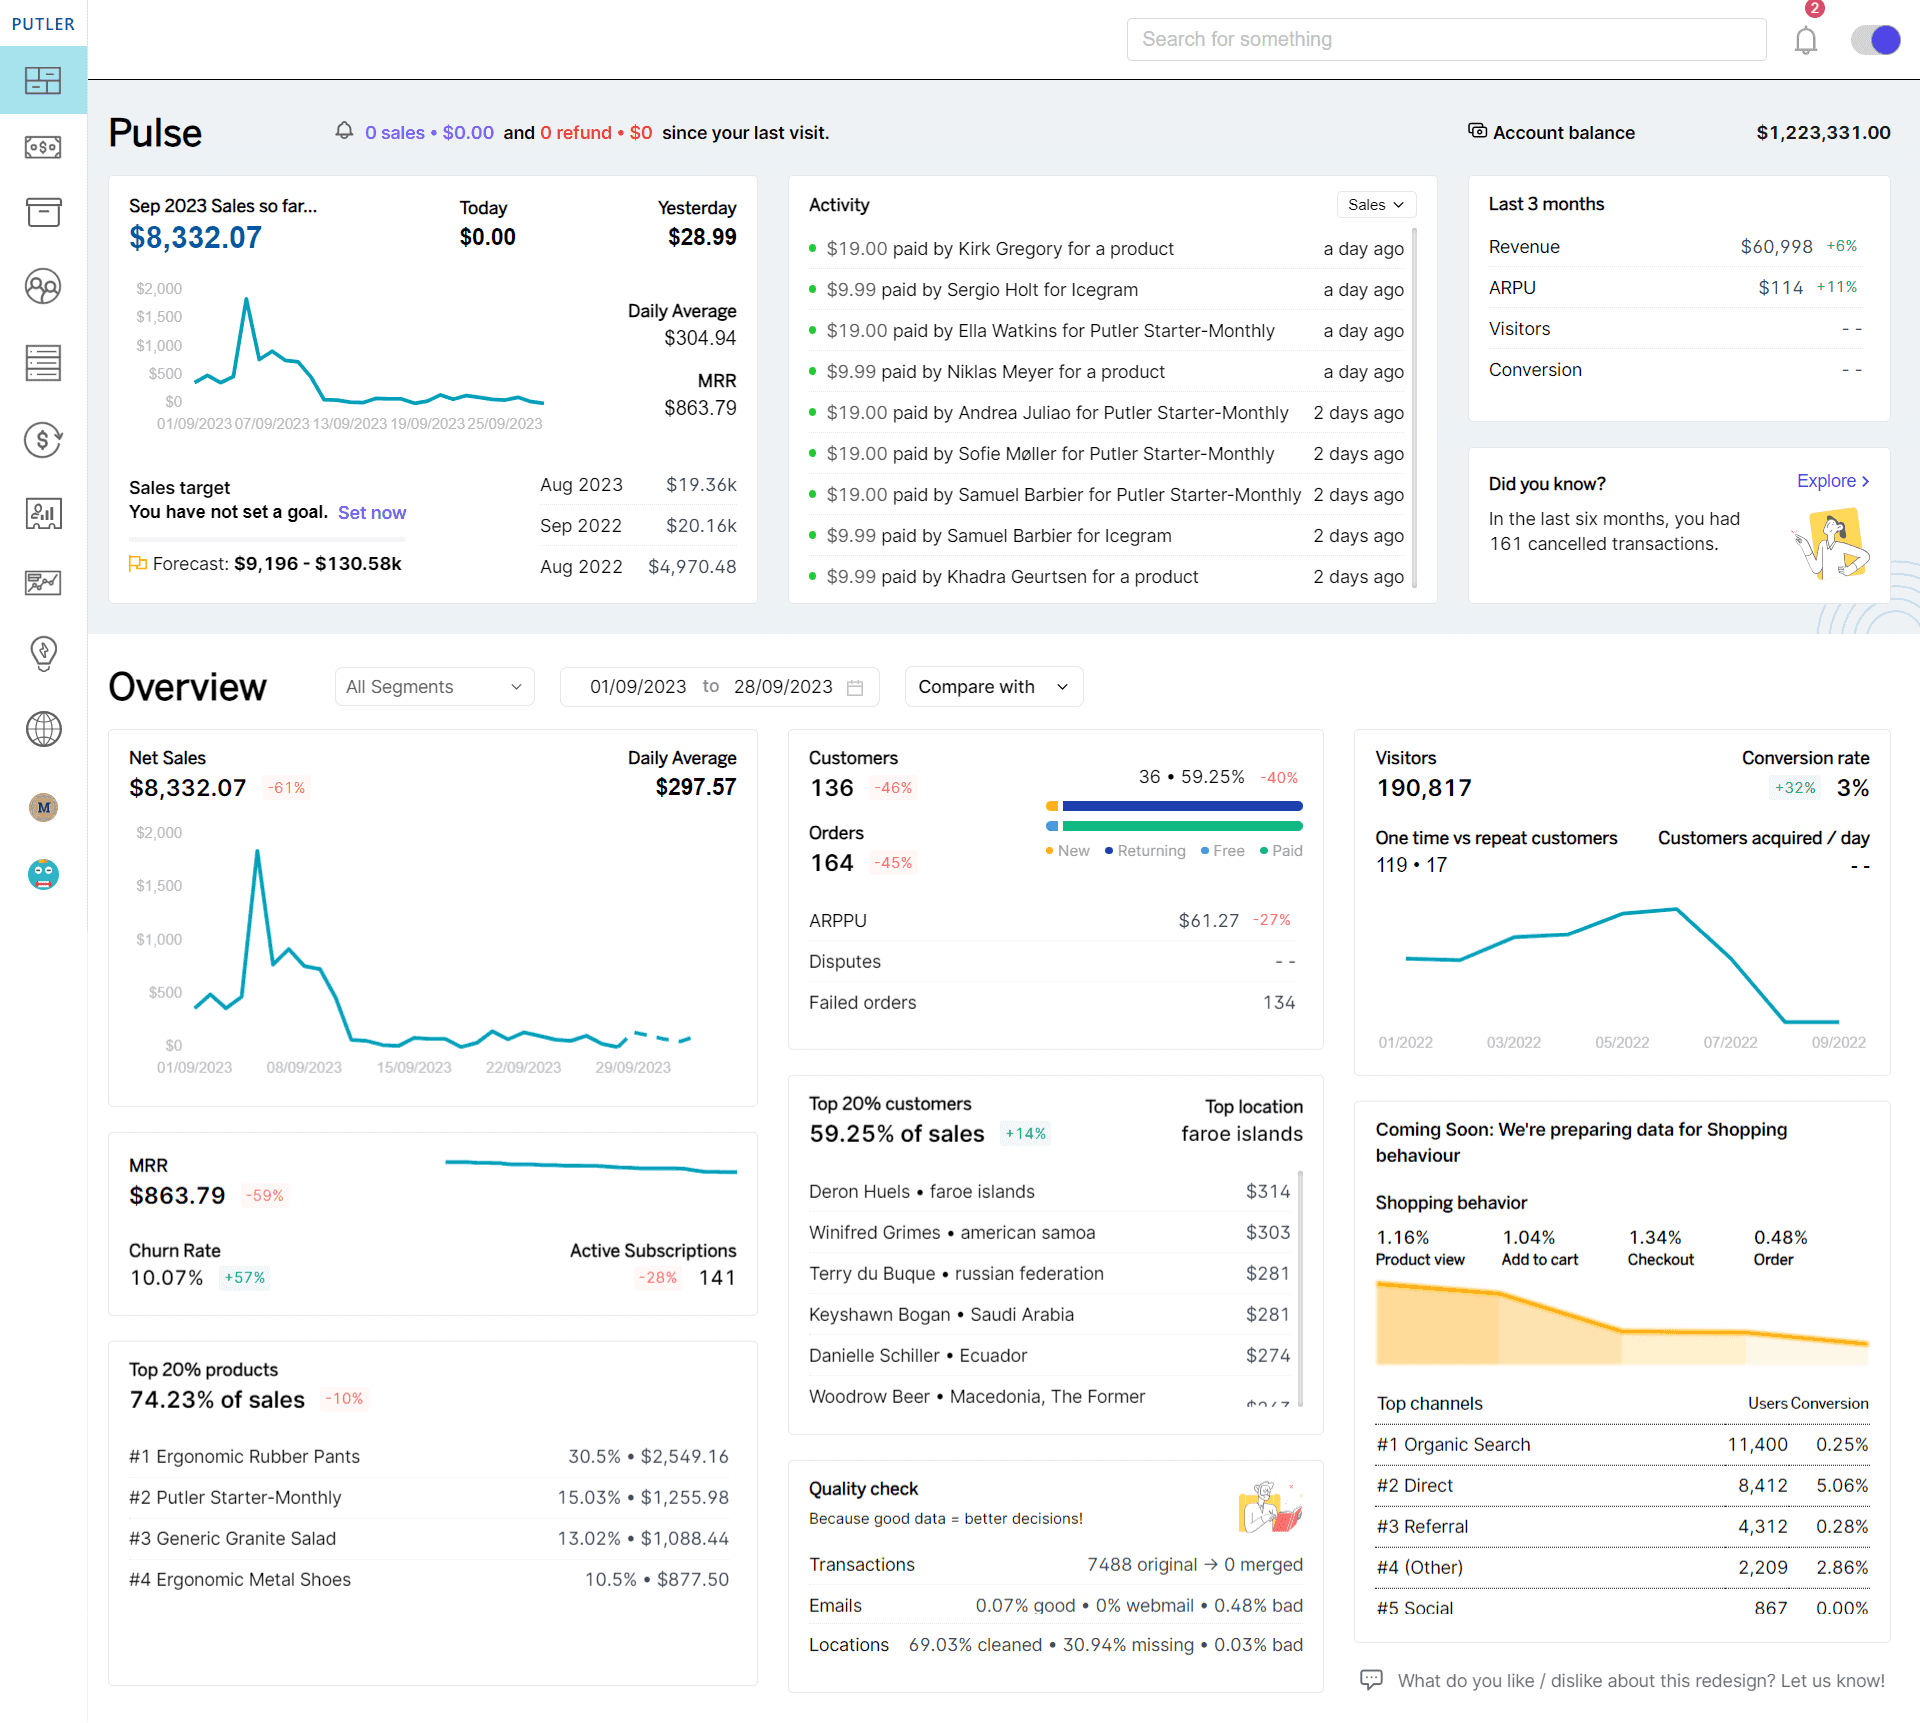
Forget the headache of data confusion.
Utilize Putler’s 8 dedicated dashboards for sales, products, customers, transactions, subscriptions, audience, forecasts, insights, and web analytics, plus an all-in-one home dashboard. These dashboards organize data and highlight the areas that can actually improve your business performance.
Real-time Reports
Access real-time reports instantly, staying on top of current trends and user activities.
Putler ensures that you have the most up-to-date information about your customers for informed user behavior analytics based decision-making.
RFM Segmentation
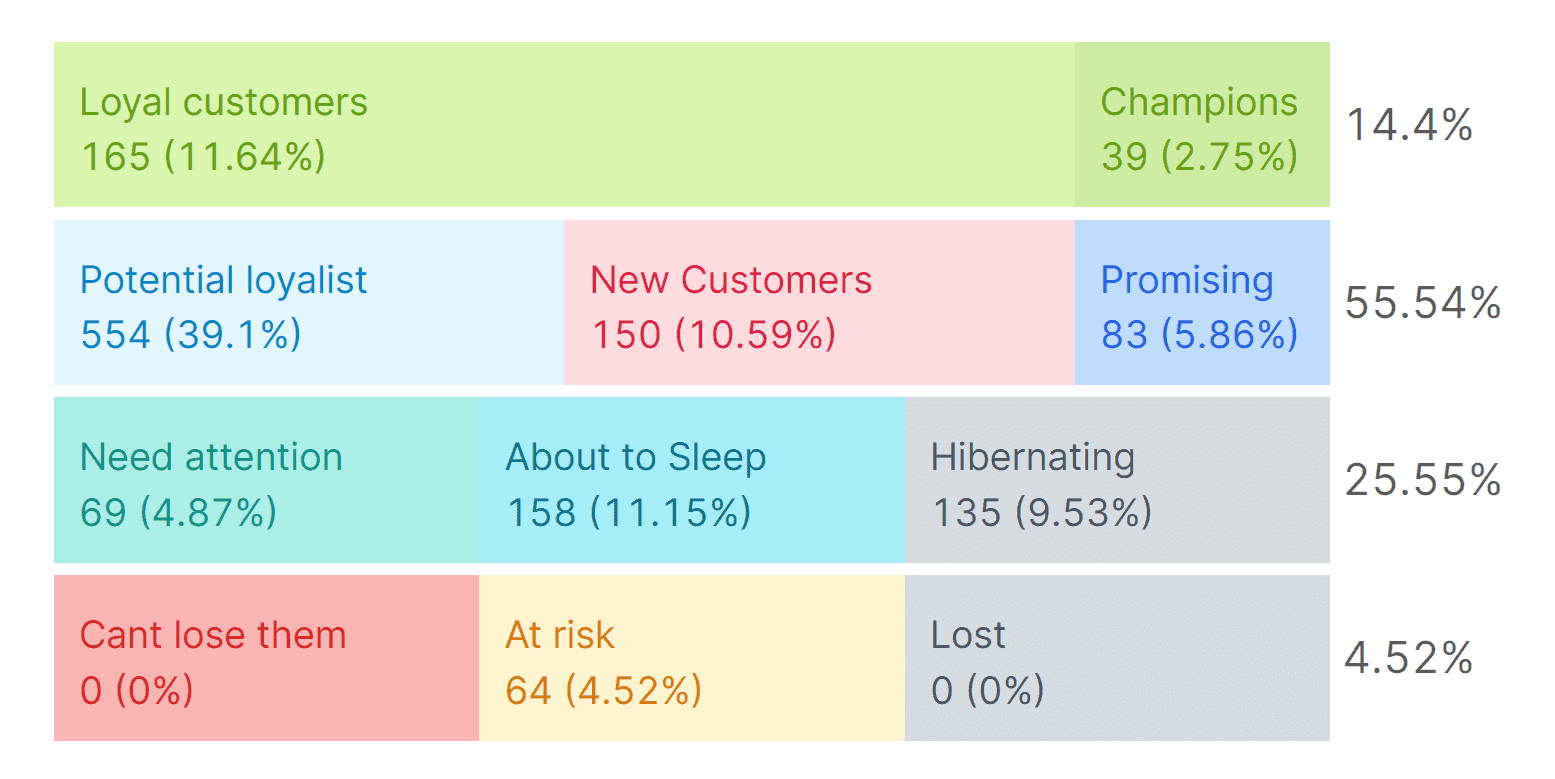
Putler’s RFM Segmentation feature is all you need to get the most out of purchase behavior.
Putler automatically categorizes your customer data and presents them to you in different segments, providing you with an eagle-eye capability to understand users’ purchase behavior to the core. With this capability, you can effortlessly identify patterns among different user groups to target your strategies effectively.
Revenue and Sales Tracking
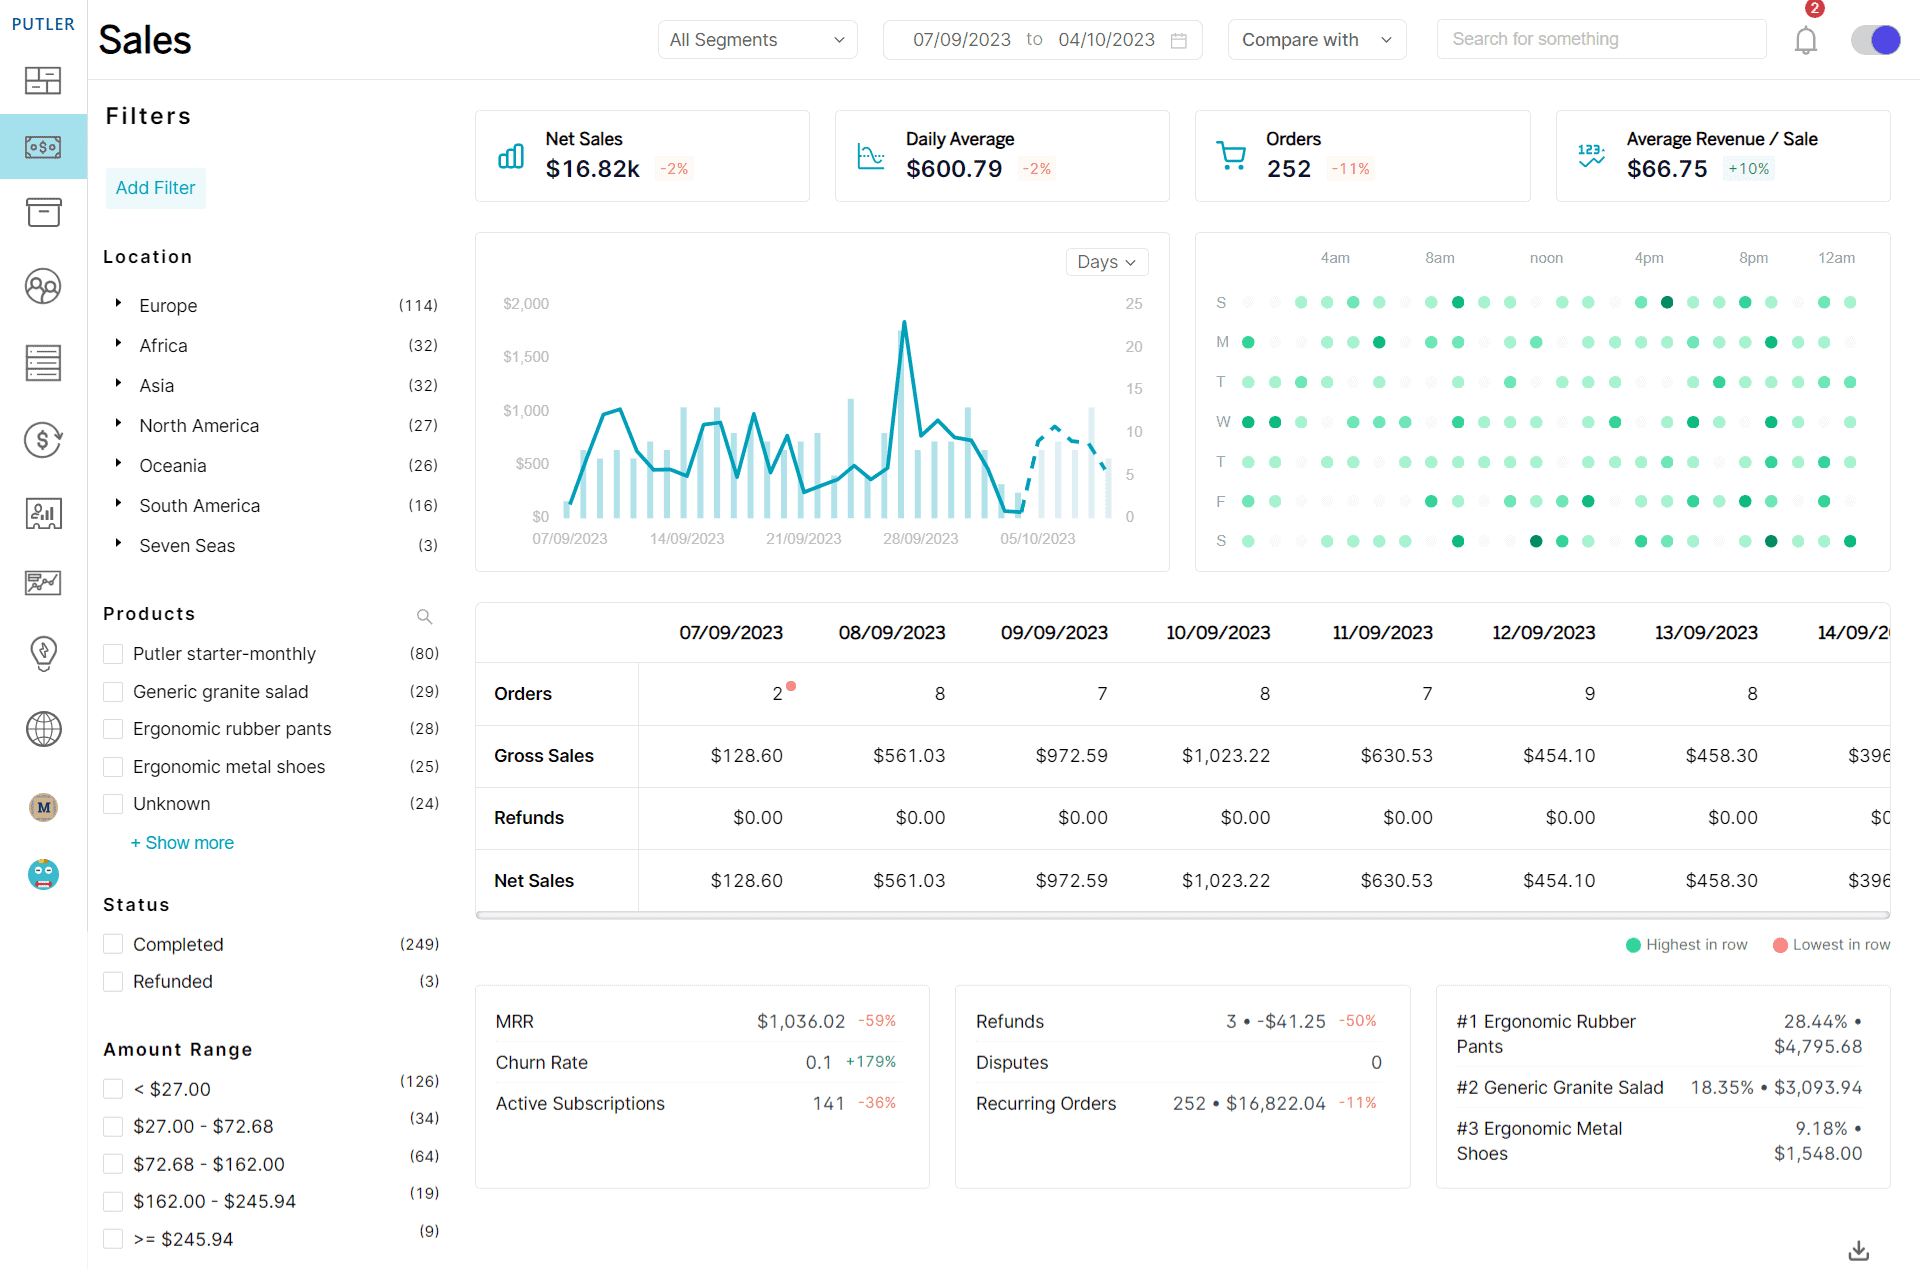
With the abovementioned dedicated dashboards, you can seamlessly track your revenue, products, and sales.
Gain a detailed view of your financial performance, identifying the top 20% of best buyers, as well as 20% of best products based on their contribution to your overall sales.
Goal Tracking
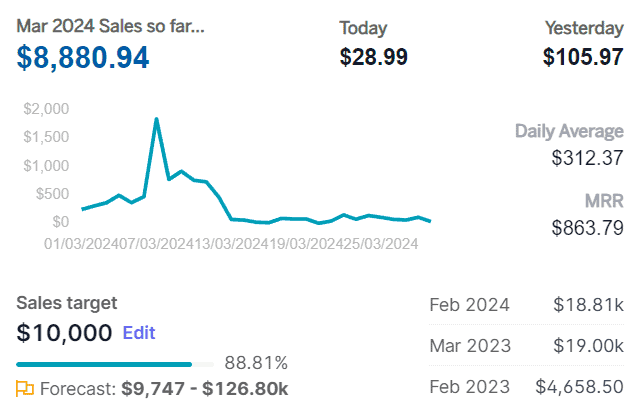
Tracking predefined goals lets you monitor your performance against benchmarks. You can also track progress and adjust strategies to meet or exceed your objectives. And, the best part about Putler is you can see your desired MRR goal right from the Home Dashboard.
Predictive Analytics
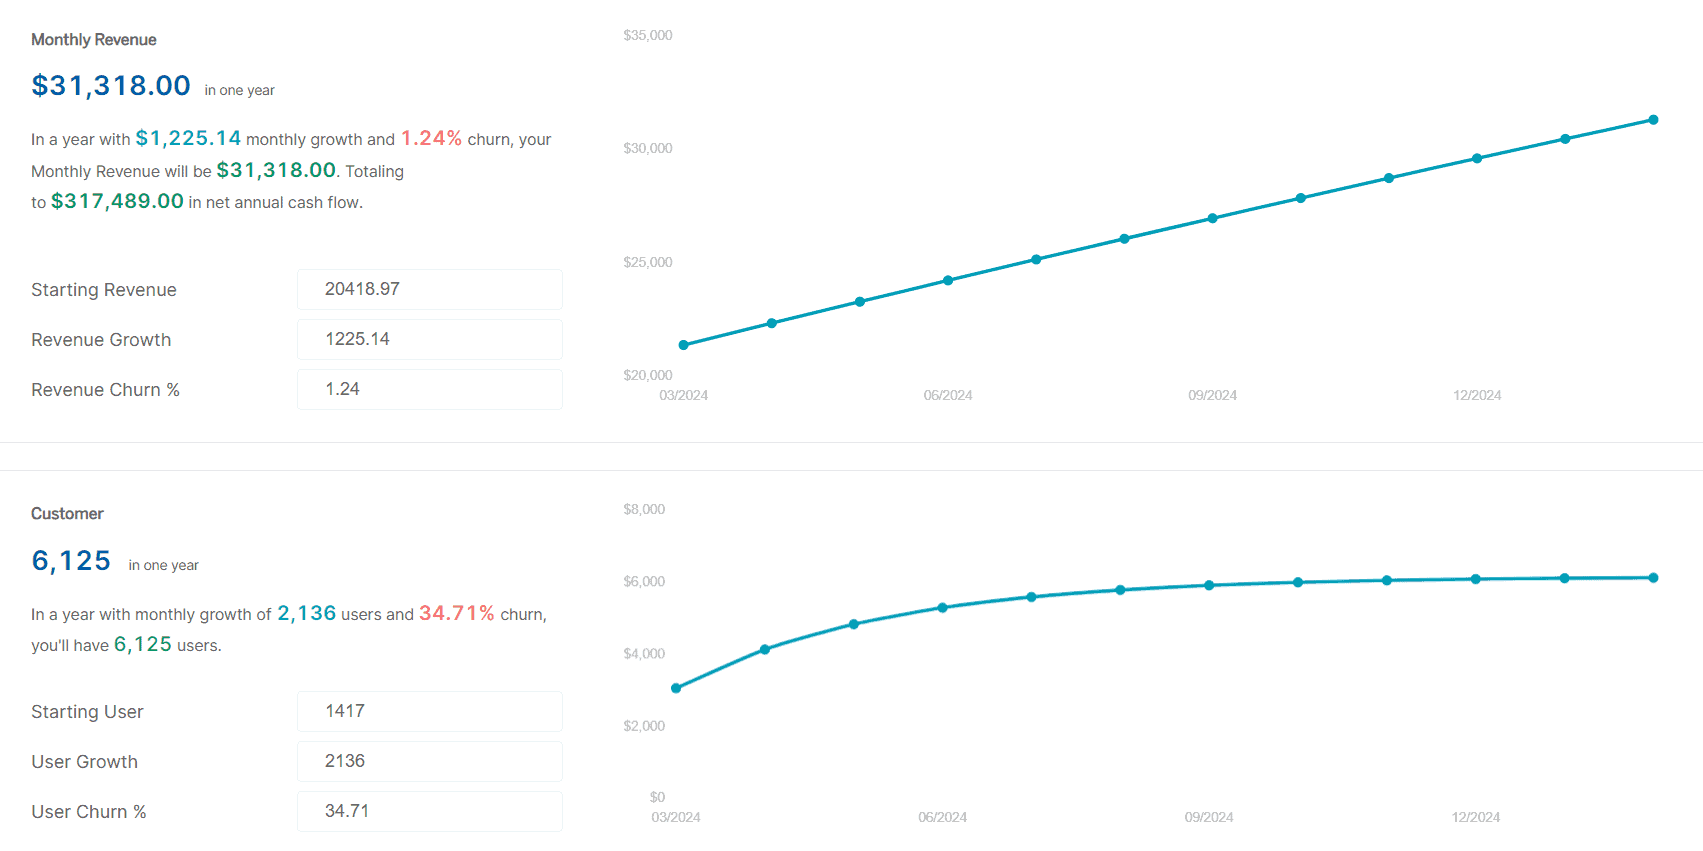
Putler’s predictive analytics capabilities provide accurate future forecasts of sales based on past interactions. This feature can help you anticipate customer needs and customize your marketing strategy to improve customer retention.
By analyzing the historical data, Putler accurately predicts the users who are likely to change and therefore you can enable the proactive measures to retain them.
Additionally, it also identifies emerging behavior trends and anomalies to provide a deeper understanding of user patterns and potential issues.
Product Recommendations
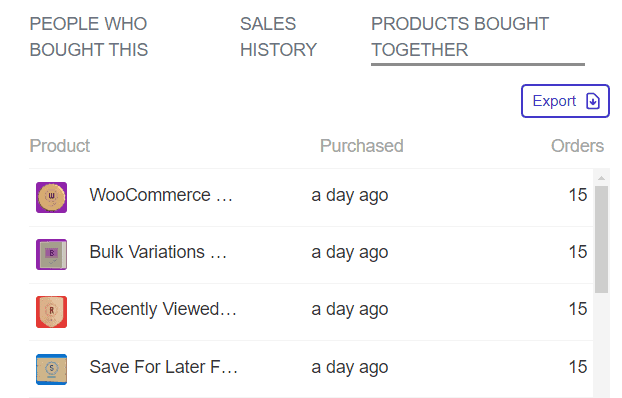
Putler uses its AI analytics capabilities, such as product recommendations and bundle suggestions based on user behavior and past interactions.
On the Products dashboard, you can click on the individual product card to find out the products customers are purchasing with another product so that you can make effective bundles.
By following these steps, you can delve into the intricacies of user behavior, make data-driven decisions, and optimize business strategies.
Conclusion
So, there you have it—the nuances of user behavior and its pivotal role in achieving business goals.
Successful strategies thrive on understanding how users behave. Insights from user behavior analytics act as a helpful guide. It directs businesses to make informed decisions and provide better experiences for customers.
Decoding user behavior isn’t just a tool; it’s the compass steering businesses toward a horizon of sustained growth and prosperity.
FAQs
How does user behavior analytics work?
User Behavior Analytics works by collecting and analyzing data generated during user interactions with digital platforms. This process typically involves the use of advanced algorithms and machine learning to identify patterns, anomalies, and trends in user behavior.
UBA tools track various metrics such as sign-ups, activation rates, feature usage, and retention rates. By examining these insights, businesses can understand user preferences, predict potential issues, and optimize their products or services to align with user expectations.
How do you measure user behavior in analytics?
Measuring user behavior in analytics involves tracking and analyzing key metrics that reflect how users engage with a product or service. Some essential metrics include:
- Churn Rate: Percentage of users lost during a specific period.
- MRR (Monthly Recurring Revenue) and ARR (Annual Recurring Revenue): Financial health indicators.
- Returning Customers: Number of customers who repeatedly interact with the product.
- Customer Lifetime Value (CLTV): Anticipated total revenue from a customer over their entire relationship.
- Average Revenue Per Paid User (ARPPU) and Average Order Value (AOV): Metrics indicating user spending patterns.
Analyzing these metrics provides a comprehensive understanding of user behavior and allows businesses to make informed decisions to enhance user satisfaction and overall performance.
How do I choose the best behavior analytics tool?
Choosing the best behavior analytics tool involves considering several factors:
- Features: Look for tools with a comprehensive set of features, including user tracking, segmentation, and real-time reporting.
- Integration: Ensure the tool seamlessly integrates with your existing tech stack to avoid data silos and enable efficient data management.
- Ease of Use: Select a tool with an intuitive interface and user-friendly dashboards for easy navigation and understanding.
- Data Security: Prioritize tools with robust security measures to protect user behavior analytics data from breaches.
- Customization: Opt for tools that allow customization to meet the specific needs of your business.
- Support and Training: Choose a tool with excellent customer support and training resources to assist in implementation and ongoing usage.
Considering these factors will help you choose the best one among the plethora of user behavior analytics tools that aligns with your business goals and enhances your ability to understand and optimize user behavior.