For any business, it is important to understand your customers. Identifying the main pain points of your customers and providing them with a solution is the key to success.
While this may sound easy, business owners often struggle to execute it. They may face challenges in recognizing the problem, creating a solution, or effectively communicating the solution to their customers.
In this article, we will explain how our tool, Putler, provides essential customer analytics. Let’s take a closer look.
What is customer analytics?
Customer analytics is your window into the customer’s world. It’s about:
- Gathering data on customer behavior
- Analyzing their preferences and patterns
- Using these insights to make smart business moves
Now, the next question arises – why exactly does your business need customer analytics?
Let’s explore.
Why does your business need customer analytics?
You might be thinking, “I know my customers pretty well already.” But here’s the thing – customer analytics takes your understanding to a whole new level.
Here’s why it’s essential:
- Increased revenue: By understanding customer buying patterns and preferences, you can tailor your offerings and marketing strategies to increase sales and profits.
- Improved customer retention: Identify at-risk customers early and take proactive measures to prevent churn.
- Enhanced personalization: Create more targeted and relevant experiences for your customers, improving satisfaction and loyalty.
- Informed decision-making: Base your business strategies on concrete data rather than assumptions or guesswork.
- Competitive advantage: Gain insights that help you stay ahead of market trends and outperform competitors.
How does customer analytics work?
Customer analytics involves several key steps:
- Data collection: Gather relevant customer data from various sources such as purchase history, website interactions, customer service records, and social media engagement.
- Data processing: Clean and organize the collected data to ensure accuracy and usability for analysis.
- Analysis: Apply statistical techniques and analytical tools to uncover patterns, trends, and insights from the processed data.
- Visualization: Convert complex data and insights into clear, understandable visual representations like charts and graphs.
- Implementation: Use the derived insights to inform business decisions, improve strategies, and enhance customer experiences.
Customer analytics is not just about accumulating data, it’s about extracting actionable insights that drive tangible business improvements.
Putler’s Customer dashboard is your one-stop destination to analyse your customers
We understand the importance of understanding customers. We also understand the struggles that business owners go through. (PS. We own three businesses ourselves).
Considering both, we’ve built a customer dashboard that provides critical metrics that help gain in-depth information about your customers, segment them, and provide insights to provide better customer service and ultimately grow profits.
Take a look at Putler’s Customers dashboard below:
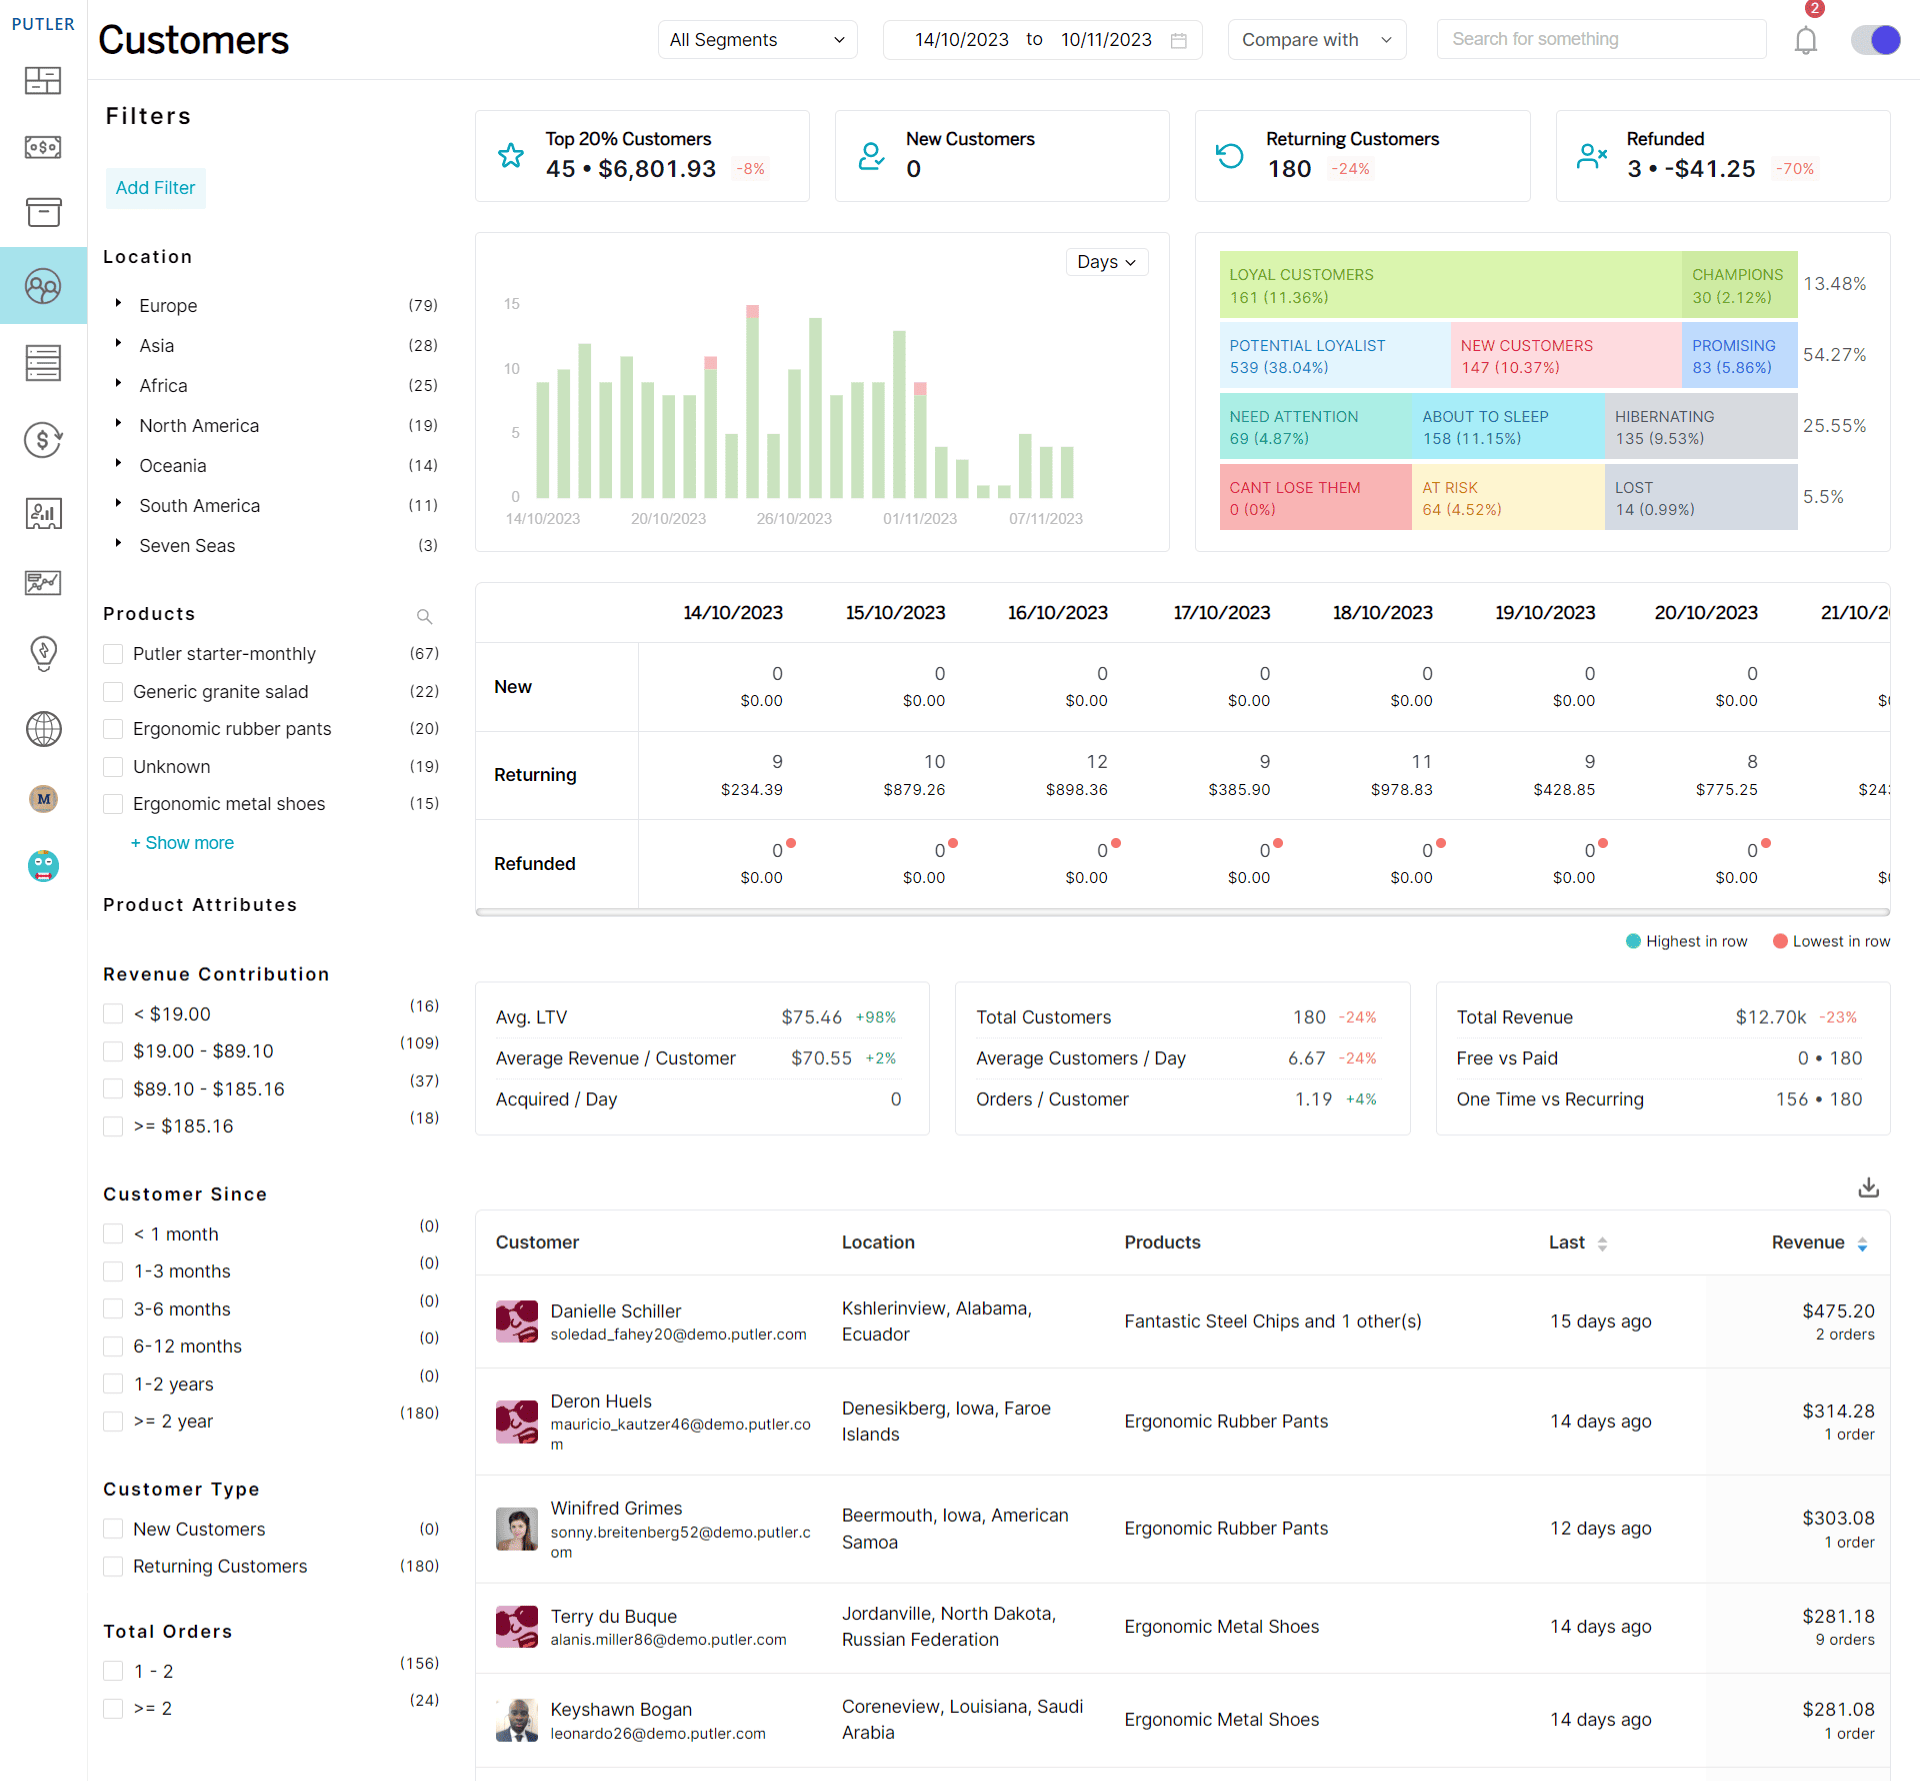
Customer Analytics KPI’s
We tried retaining all the good portions and KPI’s from the previous Customers dashboard but we also added a few more really useful ones.
Here are the customer based KPI’s you will get in the new customer analytics dashboard:
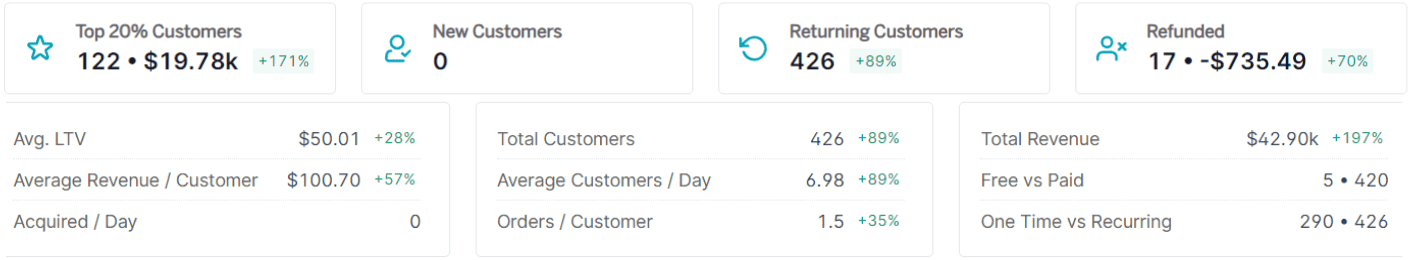
- Top 20% customers
- New customers
- Returning customers
- Avg LTV
- Avg revenue/customer
- Acquired/day
- Average customers/Day
- Order/Customers
- Total revenue
- Free trailers vs Paid
- One time vs recurring
Customer Analytics Graphs
This graph gives you the 3 things you want to analyse from your customer data.
- New customers
- Lost customers
- Returning customers
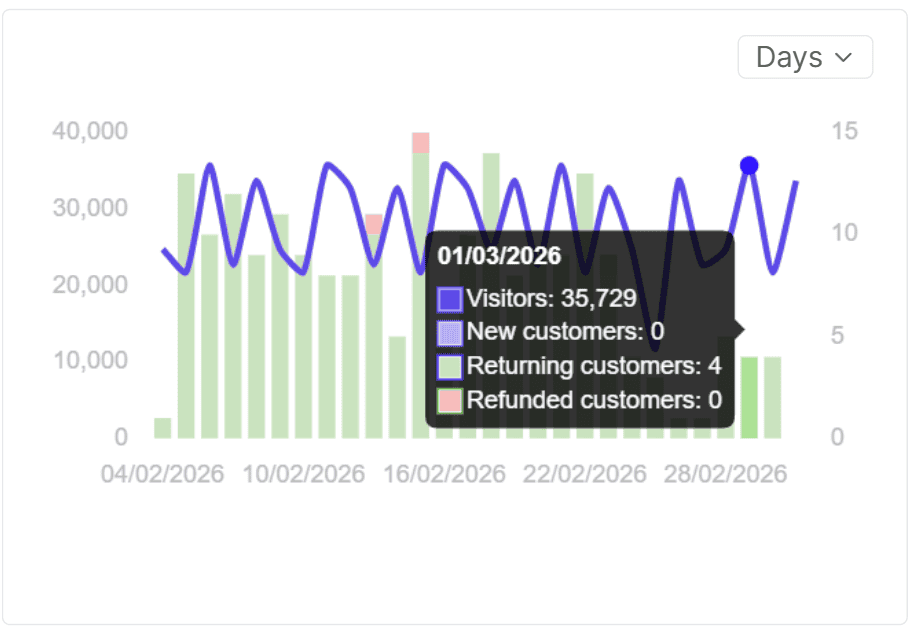
All these 3 things will be reflected for the date range you select using the date picker.

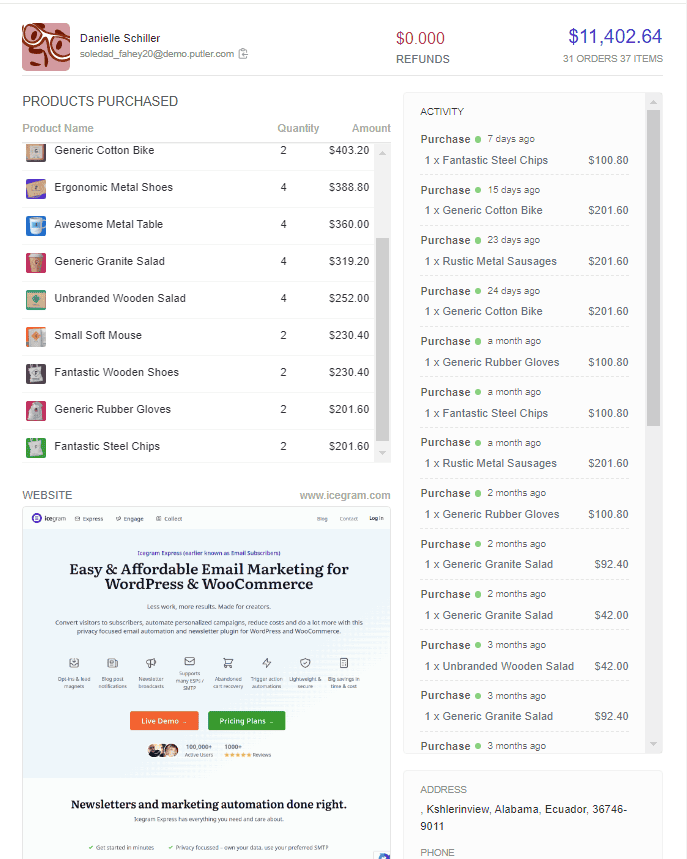
In-depth Customer Reports
KPI’s are amazing but seeing data in depth is the real deal. So the new customer analytics dashboard provides you with both a list as well as an in-depth report of your customers.
The in-depth reports gives you information like;
- Customer’s Personal information
- Revenue stat
- Total Sales
- Refunds
- Number of orders placed
- Store Activity
- List of products purchased
Facets
In the Customer dashboard, you can find 4 amazing facets namely;
- Country
- Product
- Total revenue contribution
- Customer since
Country facets: Filter customers by the country they live in. Putler’s country facets filter out countries that have the majority of your customers. Using this filter, you can evaluate which country gives you how much revenue and then make marketing decisions like sending out language-specific emails, page translations, organizing country-specific festive offers, etc.
Product facets: Similar to the country facet, Putler filters out customers as the products in your store. It also arranges it in descending order that is the product which was purchased by the majority of your customers to the least. You can use this filter to send out product-specific emails, upsell emails, etc.
Total revenue contribution: This facet filters customers based on the revenue they contribute to your business. It is an advanced facet that can help you segregate customers on revenue margins and help you make strategic marketing decisions, send laser-targeted emails, and much more.
Customer since: This filter will help you bucket out customers based on the time they entered your business. Every customer is on a different journey path in your business. There are some who are with your business for years, some for over a year, and some recent. Using this filter to get to know groups of customers that are on the same journey path. You can use this information to send our more personalized emails and make them feel valued.
Find out how to use Facets to grow your business
Customer Segments

Similar to Sales dashboard, you can apply multiple filters and create any segment of your choice using this new feature.
Strategies to use Segments better
RFM Analysis
RFM Analysis is one of the most trusted ways to segment customers based on recency, frequency and monetary value of the purchase of a customer.
And though RFM sounds complex, Putler gives you results within seconds.
You simply select the date range you want to segment customers for and then click on the RFM segment of your choice.
All the customers that belong to that date range will get loaded in the grid below.

Benefits of this revamped RFM chart:
- Calculated on runtime a.k.a Live RFM
- More accurate results
- Works with filters and segments
- Improved customer retention rates
- Increased customer lifetime values
Top hacks to use this dashboard
HACK 1: Increase sales by pitching relevant products to customers
This one is a marketing standard and it works like a charm. Why? Two reasons-
The customer has already bought something from you so he trusts you. Second, you are pitching something relevant making it even more irresistible.
How to implement this?
- Firstly, use the segment creator and create a segment with people who have purchased product name= XYZ.
- Once all the customers who have purchased this item gets listed, think about what product on your store could be relevant for them. For example, suppose these people have bought a mobile from your store. Pitching them a mobile cover is relevant.
- Once you figure your respective relevant product, export the list of customers and send them an email pitching the relevant product.
HACK 2: Plan a smart flash sale
I call this smart because it is targeted. And I call it flash sale cause it is time-limited.
Generally, people run a flash sale for all customers on the entire website. But be smart, target customers and then increase scarcity by keeping it time limited.
How to do this?
- Target a particular region. Let’s say you love New York. Use the segment creator and create a segment of people who have bought from New York.
- Export the list of New Yorkers.
- Now create a coupon and send them an email in true New Yorker style. Put in references that they will relate to and give them the coupon code in the email itself.
- Increase urgency by stating the coupon will be invalid after so and so time.
HACK 3: Organize a meetup/ event closer to your customers
This tip is similar to tip number 2. But it aims at strengthening customer relationship and not sales directly. If you are an influencer or somebody in the coaching industry you know what impact socializing with clients can make for your business right?
Use the same principle and do it using Putler.
How?
- Find the top country using the new Country facet.
- All the customer falling in this country will be loaded. Now pick a city you will like to arrange a meetup for from the cities listed in the customer drill down.
- Then use the segment creator and say city name = this selected city. All customers of this city get loaded. Export this list.
- Either have a meetup/ event of a simple webinar for these guys and know them better.
This tip will be gold while planning your next event. It will give you clarity on where your customers are at and help you schedule events better. So do use it.
Final words
Knowing your customers isn’t just an advantage, it’s the key to survival in today’s market. As Peter Drucker said, “What gets measured gets managed.”
By diving into customer analytics, you gain the insight needed to make smarter choices, improve your products, and provide better service.
Tools like Putler make this process simple, but the real power lies in how you use the data. The businesses that understand their customers will lead the future.
Want better customer analytics for your business?
Take Putler’s 14 day free trial. No coding or credit card required.