In the last five years of this information age, Software-as-a-service (SaaS) has evolved to a greater extent and is even expected to grow exponentially this year and beyond.
However, at this time, we should also keep in mind that with fresh innovations emerging all the time, the competition is also becoming more fierce than ever before.
So, if you’re running any type of SaaS business that has a monthly/quarterly/yearly subscription pricing strategy and are looking to accelerate growth and success, leveraging the power of subscription reports is the only way to gain a real competitive edge. That’s where SaaS reporting enters the fold.
A SaaS report also called subs reports gives a complete overview of your subscription business and helps you understand what works and what doesn’t work for your business.
So, without further ado, let’s explore the importance of SaaS reports and the six key metrics that facilitate the business to achieve better performance and, ultimately, profit.
Why is SaaS Reporting important?
Without SaaS reporting, you cannot identify where your company stands in the crowd.
But, if you know how to read and respond to metrics, and KPIs, SaaS reporting can help you in a couple of ways:
- Stay in control of your business.
- Develop future forecasts and marketing plans, guide budget planning, and improve decision-making.
Advantages of using Subscription Reports
Let’s dive deeper into the topic, we all know that running a successful SaaS business involves analyzing the product, the customers, and financial results.
So, with subs reports, SaaS businesses can focus accurately on the below four essential areas and compete in today’s constantly evolving market.
Track revenue
Revenue is an essential metric for businesses to survive. Although every company has seasonal fluctuations in revenue, analyzing your revenue flow involves more than just looking at the ups and downs.
So, having an accurate subs report will help you understand and pay attention when there is a drop in revenue that is out of normal. Similarly, significant revenue increases may provide insights into how to keep that revenue growing.
Find user conversion rate
With a SaaS report, you can find out where most of your target audience is coming from and which segments of your users are more likely to convert.
Additionally, with that information, it becomes easier for you to target the right demographic in the places where they are most likely to find your business.
Identify customers churn rate
Customer churn generally occurs when a customer decides not to continue purchasing products/services from an organization and ends their association.
With the proper SaaS reporting, you can quickly identify those weak spots in your sales pipeline and address them before you lose many customers.
Understand customer satisfaction
Customer satisfaction is essential to the success of a SaaS business because it hugely increases the opportunities for a customer to return to do more business.
Using the SaaS report, you can identify and address who is happy and unsatisfied with your product.
Moreover, using the information, you can adjust your marketing plans, sales techniques, and other internal operations that meet their needs.
Key Metrics for SaaS Reporting
Now that you understand the importance of the SaaS reporting, let’s explore the most essential SaaS key performance indicators (KPIs) that you need to pay attention to measure success:
ARPU
The Average Revenue Per Unit is shortly called ARPU. The best SaaS dashboard features average revenue per unit (ARPU) metrics. By gaining access to this insightful SaaS dashboard information, you can understand the aspects that may be obstructing your ARPU while formulating strategies to improve your bottom line in an innovative, sustainable way.
Conversion rate
Conversion rate is a crucial key metric that helps you determine whether your sales funnel needs improvement and measures the success of your tweaks.
Additionally, this metric helps you while calculating how many visitors you need on your site to reach specific revenue goals..
Churn rate
Measuring customer churn rate is especially an important KPI for any SaaS business because it allows you to determine the reasons why a customer stopped using your product/service during a specific period. Furthermore, it gives you a realistic overview of the performance of your customer retention strategies.
MRR and ARR
Like ARPU, your Monthly Recurring Revenue(MRR) and Annual Recurring Revenue (ARR) helps you estimate the amount of revenue your current customers generate for you each month and annually, regardless of whether you have several pricing tiers or just one.
CAC
CAC refers to Customer Acquisition Cost- meaning the amount of money your company spends on acquiring a particular customer.
Measuring this metric helps you to make strategic financial adjustments to your business model and improve overall operational efficiency.
LTV
LTV stands for Lifetime Value of Customers. It means the total amount of money that a customer spends with your company over their lifetime, beginning with the day they sign up until the day they leave.
Remember, the customer’s lifetime value should be at least five or six times greater than the cost of acquiring that customer.
Subscription Analytics Tools for SaaS
From the above discussion, it is clear how important are SaaS reports for making important decisions about your subscription business.
So, to help you get started, here are some of the subscription analytics tools to monitor your SaaS business efficiently.
ProfitWell
If you’re running a subscription business, ProfitWell is one of the best data analytics SaaS reporting tools with unique features.
It helps you track trials and attribution, churn rate, and cohorts to boost retention and proactively monitor engagement to determine which users are likely to convert or churn.
Pricing: ProfitWell Metrics:$0/ month; contact them for paid plan information.
Grow
Grow is one of the most influential and capable business intelligence and reporting tools for SaaS companies.
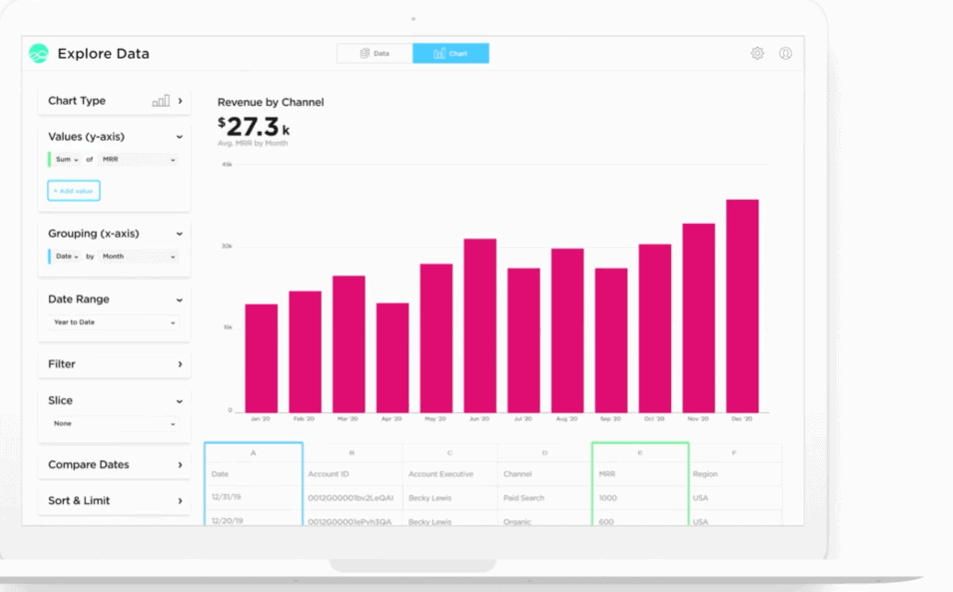
With this SaaS reporting tool, you can easily connect with CRM, marketing, and financial data sources — and the focus on visualization makes it easier to make sense of all the numbers.
Pricing: Free Trial, Contact them for pricing information
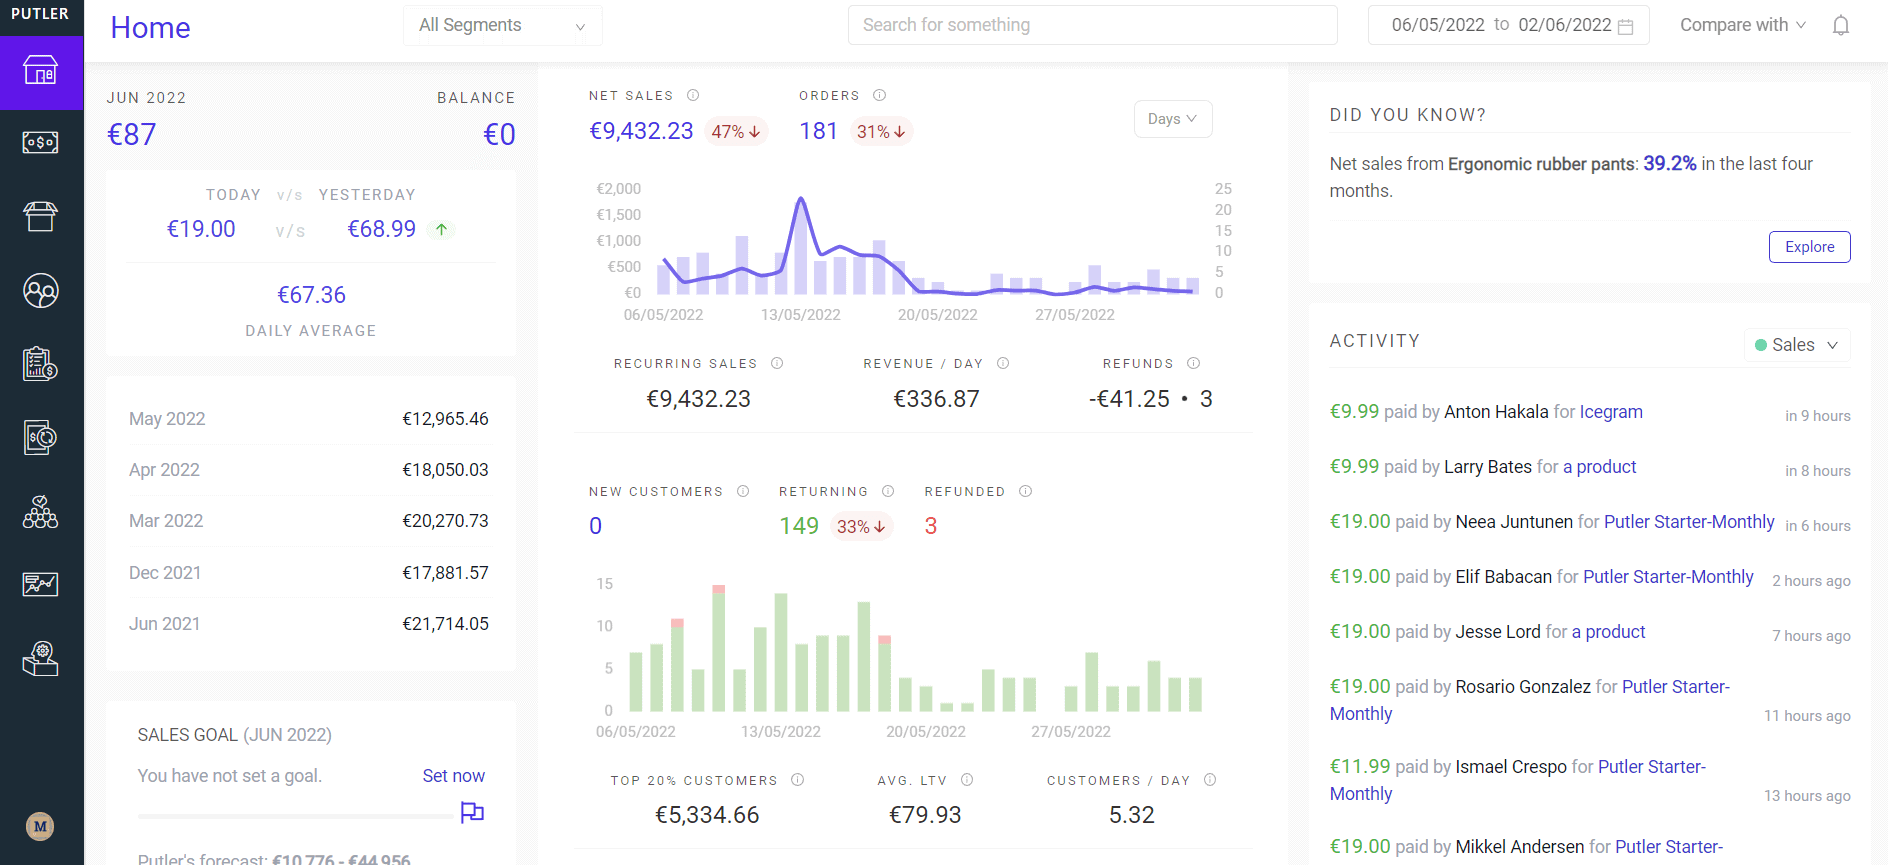
Putler
One of the unique and revolutionary multi-channel analytics and reporting tools designed for different types of businesses like SaaS, online retailers, distributors, startups, and accountants is Putler.
With Putler, you not only understand the overall business health but also allow your business to discover new opportunities through in-depth reports on Products, Customers, Orders, and your Website Traffic.
Pricing: Putler offers you three different pricing plans- Starter: $20/month, Growth: $50/month, and Scale: contact sales.
Zoho Analytics
Zoho Analytics is one of the best SaaS reporting tools that allow you to analyze, collaborate and share reports in real-time with the team, export reports for online access, and schedule them as mails.
Pricing: Basic: ₹960/month billed yearly, Standard: ₹1,900/month billed yearly, Premium:₹4,200/month billed yearly, and Enterprise: ₹15,850/month billed yearly.
So, there you have it, 4 of the SaaS analytics tools to get started. We recommend you to look into the tools, their features and pick the one that suits your requirements.
What makes Putler a better choice than other SaaS reporting tools?
- Both for eCommerce and SaaS businesses – Most tools such as ProfitWell, Grow, and Zoho Analytics aren’t designed for e-commerce businesses but Putler supports SaaS as well as e-commerce stores, online marketers, and non-SaaS businesses.
- SaaS metrics for leading gateways – Putler provides SaaS reports for all leading gateways like Stripe, EDD, WooCommerce, Braintree, Authorize.net. Other SaaS tools mostly cater to only Stripe subscriptions.
- Data aggregation – Puter also acts a data aggregator and helps you take the right decisions based on all your data. It consolidates 17+ data sources from payment gateways, eCommerce shopping systems, and Google Analytics in minutes and gives a detailed report of your business.
- Key SaaS metrics in one place – Puter offers you many metrics, KPIs, and statistics that you can use to track your progress like MRR, ARPU, active subscriptions, new subscriptions, ARR, churned subscriptions, and LTV.
- Beyond reports – Along with reports, Putler also provides useful marketing features like segmentation, forecasting, goal tracking etc
Amazed? Let’s take a closer look at Putler.
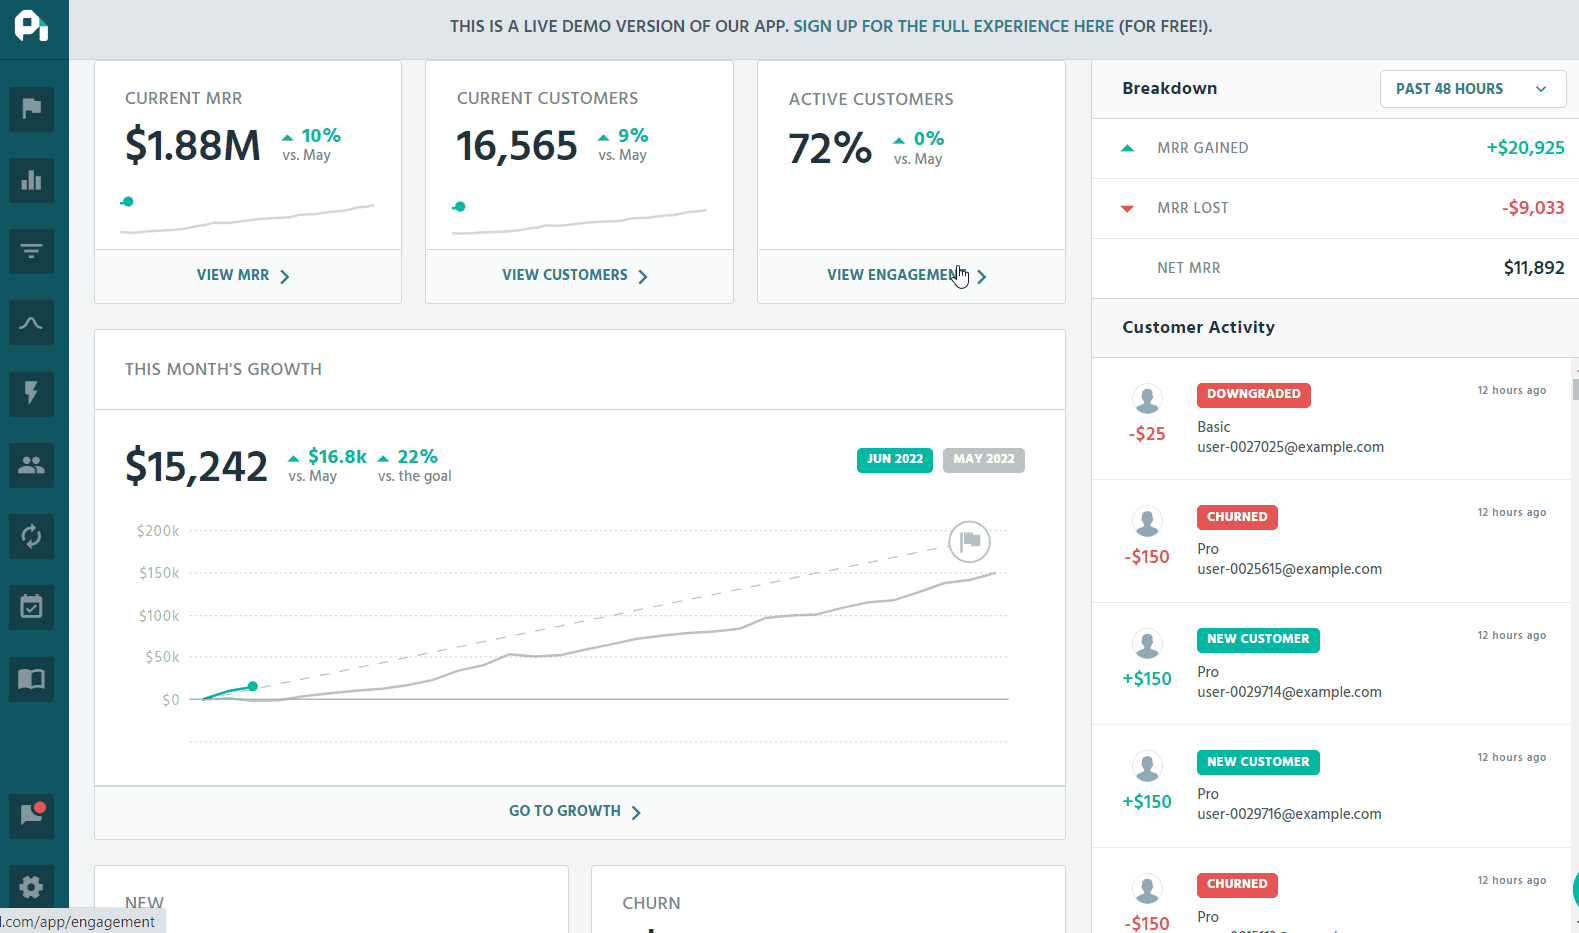
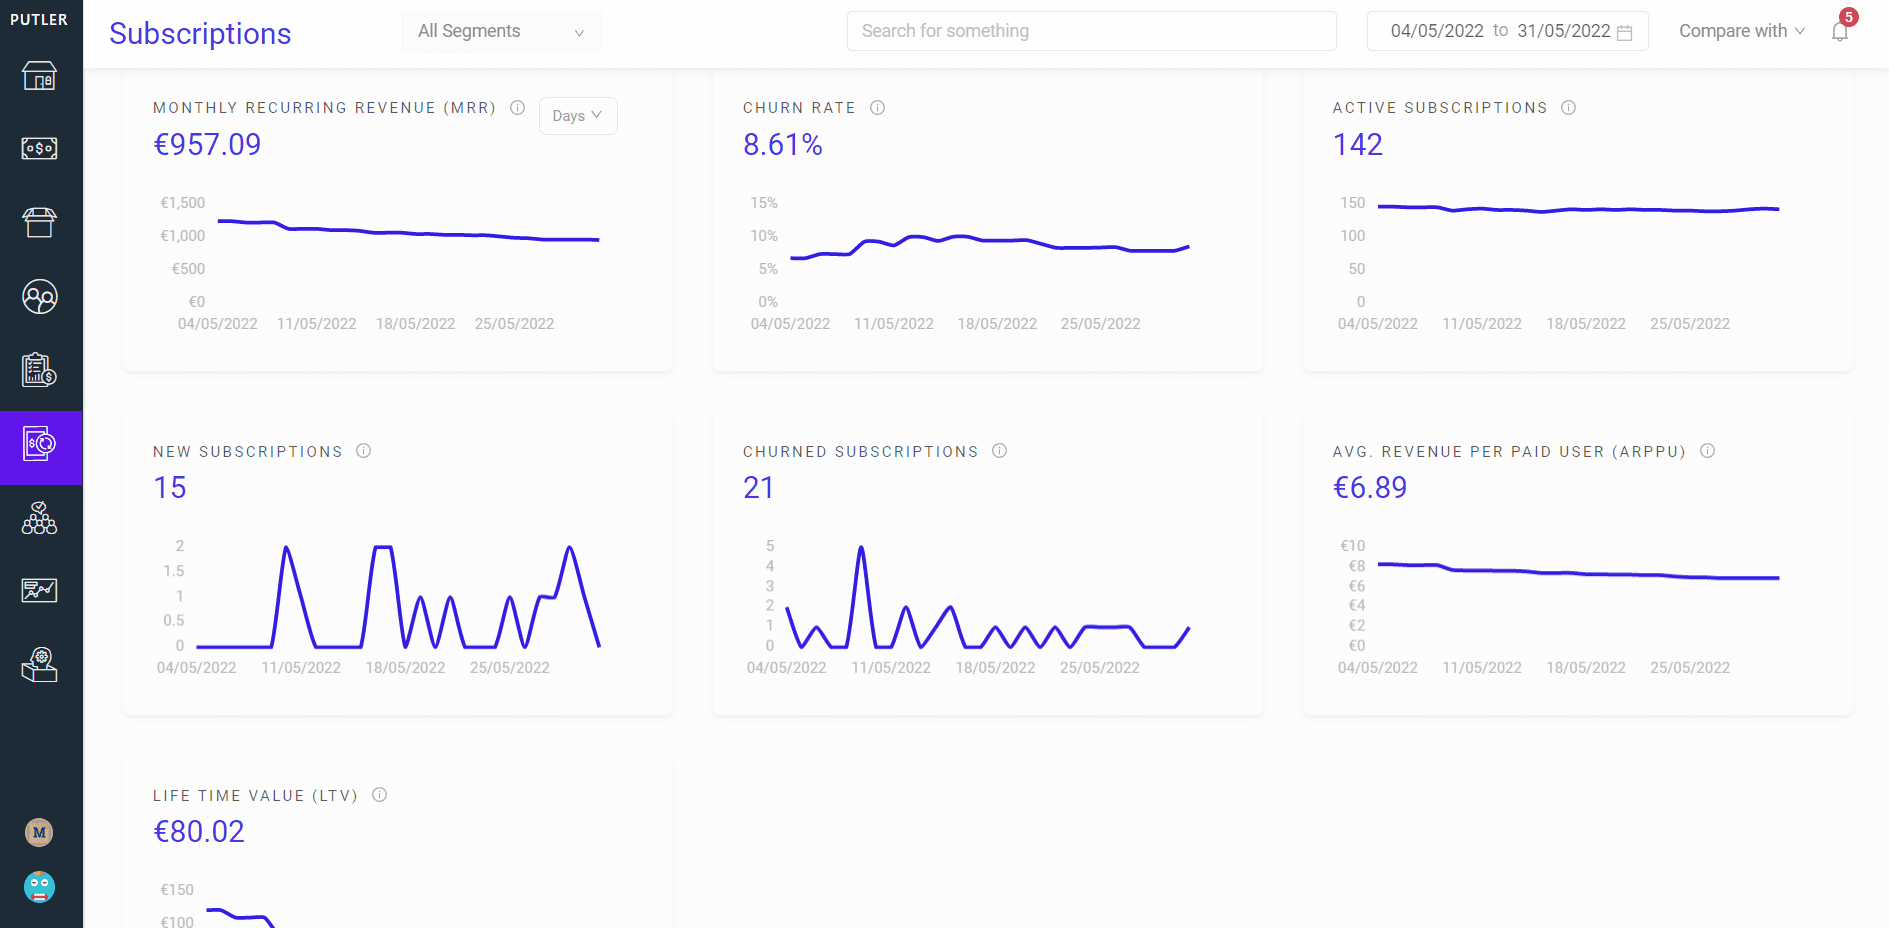
Detailed look of Putler’s Subscription Dashboard
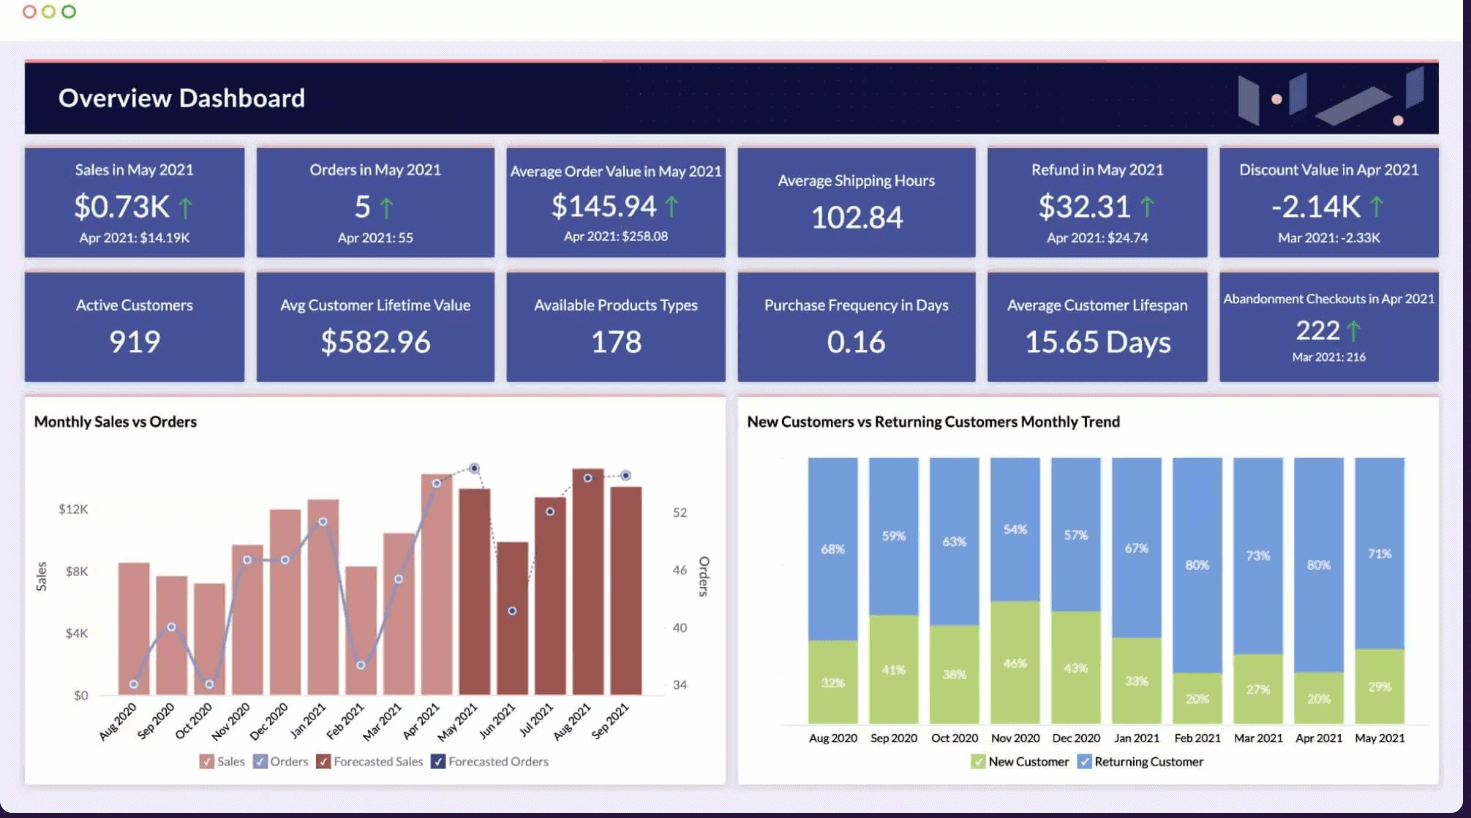
Putler has an intuitive data analytics dashboard that provides reports and metrics around almost everything- Products, Customers, Sales, Orders, Transactions, Subscriptions, and Website Audience.
As this blog is specifically around SaaS metrics, here’s a look at the Subscription dashboard within Putler
Similar to the Subscription dashboard, Putler has a dedicated dashboard for all key business verticals like Products, Customers, Sales, Orders, Website Traffic.
You can take a read more about Putler’s various dashboard here.
Additional benefits of using Putler
Beyond critical metrics, reports, and insights, Putler also offers several benefits, which are as follows,
- It can handle multiple currencies.
- Can handle multiple businesses from one place.
- It has the fastest search and saves hours of work.
- Can combine data from multiple data sources, remove duplicates, and show combined reports.
- It can be shared with the entire team with proper permissions.
- Can manage subscriptions, send money, issue refunds, segment customers, and find the most profitable time on your website.
- It helps you to export various reports in the form of CSV.
Over to you
We live in a world where Business intelligence has taken over humans. So, those who take advantage of the right tools, platforms, and metrics can improve every aspect of their business and emerge victorious – especially in the SaaS sector. It means that leveraging the power of SaaS analytics tools isn’t just an option – it’s essential for business growth.
If you wish to explore more about how SaaS dashboards can boost your business today, try Putler for a 14-day free trial. You will not regret it.
FAQs
How to calculate Customer Engagement?
Customer engagement can be calculated by measuring factors like website visits, social media interactions, email opens, and purchase frequency. For a detailed guide on customer engagement, check out this blog.
What is an ideal CAC to LTV Ratio for SaaS?
An ideal Customer Acquisition Cost (CAC) to Lifetime Value (LTV) ratio for SaaS companies typically falls in the range of 1:3 to 1:5, meaning that the lifetime value of a customer should be 3 to 5 times higher than the cost of acquiring that customer. However, the specific ratio can vary depending on the industry, business model, and growth stage of the SaaS company.
What is a KPI in SaaS?
A Key Performance Indicator (KPI) in SaaS (Software as a Service) is a measurable metric that helps assess the performance and success of a SaaS company or product. Common SaaS KPIs include customer retention, churn rate, monthly recurring revenue (MRR), and customer acquisition cost (CAC).
- Guide to KPI reporting – Definition, Examples, Templates & Tools
- WooCommerce Analytics: Complete Guide To Successful WooCommerce Reporting
- Best Business Reports: What sets Putler apart from other Reporting Tools?
well-written article.
Thank you for the appreciation, Sayana.