
Data is the lifeblood of decision-making. But the real question is, are you looking at the right data? Creating a KPI reports is more than just pulling numbers into a dashboard.
It’s about choosing the metrics that matter, ones that truly reflect your business goals and performance. In a sea of data points, how do you cut through the noise?
Let me walk you through the essentials of crafting a KPI report that doesn’t just inform but drives action. Let’s dive in.
What is a KPI report?
KPIs, or Key Performance Indicators, are measurable values that help you understand how well your business or team is achieving its goals.
Think of them as the “vital signs” of your business—numbers that give you a quick sense of whether things are on track or need attention.
KPI reports take this one step further. Instead of focusing on just one metric, a well-designed KPI report pulls together multiple KPIs that align with your key business objectives, so you can see the bigger picture at a glance.
Difference between KPIs and Metrics
KPIs and metrics, are two words often used interchangeably but with a subtle, crucial difference.
KPIs (Key Performance Indicators) are the vital few metrics that directly align with your business goals. They answer the big question: “Are we on track to achieve our objectives?” KPIs focus on outcomes, guiding your strategy and decision-making.
Metrics, on the other hand, are the building blocks. They measure activities, processes, or outputs. Not all metrics are KPIs, but all KPIs are metrics. Metrics track progress but don’t always tie directly to key business outcomes.
Example: Let’s say you run an e-commerce store.
- A KPI might be monthly revenue—because it ties directly to your goal of increasing profitability.
- A metric could be website traffic—useful for analysis, but alone, it doesn’t tell you if you’re hitting your revenue goals.
In short: KPIs focus on what matters most, while metrics measure everything else.
Why Are KPIs Important?
KPI reports are the secret weapon that transforms ambitions into concrete, measurable outcomes.
- Benchmark against competitors: By measuring KPIs, you can benchmark your performance against competitors, uncovering where you’re ahead and where you need to catch up.
- Track product performance: KPIs help you keep an eye on product performance, so you know if your latest feature is delighting users or driving them away.
- Identify weaknesses: KPIs expose operational weaknesses, helping you zero in on problem areas before they become costly mistakes.
- Make data-driven decisions: When KPIs are at the center of your strategy, you can make confident, data-driven decisions that move the needle on business goals.
- Align team efforts: KPIs align your entire team’s efforts around shared goals, making sure everyone is rowing in the same direction toward success.
Without KPIs, you’re navigating business blindfolded. But with them, you get the clarity and control needed to make smarter, faster, and more impactful decisions.
Types of KPI Reports
Depending on your business goals, you can set up various KPI reports. The most popular KPI templates include:
Financial
These help you keep an eye on the financial health of your business. They focus on revenue, profit margins, and expenses.
KPI examples: Gross Profit Margin, Net Profit, Operating Expenses Ratio.
Marketing
These measure the effectiveness of your marketing efforts. They track how well you’re attracting and converting customers.
KPI examples: Customer Acquisition Cost (CAC), Return on Ad Spend (ROAS), Lead Conversion Rate.
Sales
Sales KPIs track the performance of your sales team, helping you identify what’s driving revenue and where improvements are needed.
KPI examples: Monthly Sales Growth, Conversion Rate, Average Order Value.
Product
These measure how well your product is performing in the market, ensuring you’re delivering value to users.
KPI examples: Product Return Rate, Feature Adoption Rate, Customer Churn Rate.
Customer
Customer KPIs focus on customer satisfaction, loyalty, and retention. Happy customers stick around, and these metrics ensure you’re keeping them happy.
KPI examples: Net Promoter Score (NPS), Customer Retention Rate, Customer Lifetime Value (CLV).
SaaS
For SaaS companies, these KPIs track the health and growth of the subscription-based business model.
KPI examples : Monthly Recurring Revenue (MRR), Churn Rate, Customer Acquisition Cost (CAC).
Website Performance
These KPIs help measure how effectively your website is functioning as a tool to drive business, focusing on traffic, user engagement, and conversions.
KPI example: Bounce Rate, Average Session Duration, Conversion Rate.
Each of these KPIs serves a different function but all are designed to ensure you’re steering the business toward success.
How to create KPI reports (and Why It Can Feel Like Rocket Science)
Creating KPI reports is one of the most daunting tasks for any business leader. Why?
Because KPIs aren’t just numbers you pull out of thin air. They require deep data analysis, context, and insights from multiple sources.
It’s a lot. And most businesses struggle to build a comprehensive KPI report that provides clarity without overwhelming.
But there’s a solution: Putler.
Instead of cobbling together data from different KPI reporting tools, Putler brings all your KPI reports under one roof—automatically.
With 200+ built-in metrics, you don’t need to spend hours figuring out what to track. Let’s walk through the powerful KPIs Putler offers, so you can get real insights at the click of a button.
Key Performance Indicators You Can Easily Track in Putler
Putler simplifies KPI tracking by providing ready-made reports across different verticals like sales, products, customers, SaaS, website traffic, and more. Here are some of the most critical KPIs you can monitor effortlessly:
Sales KPIs
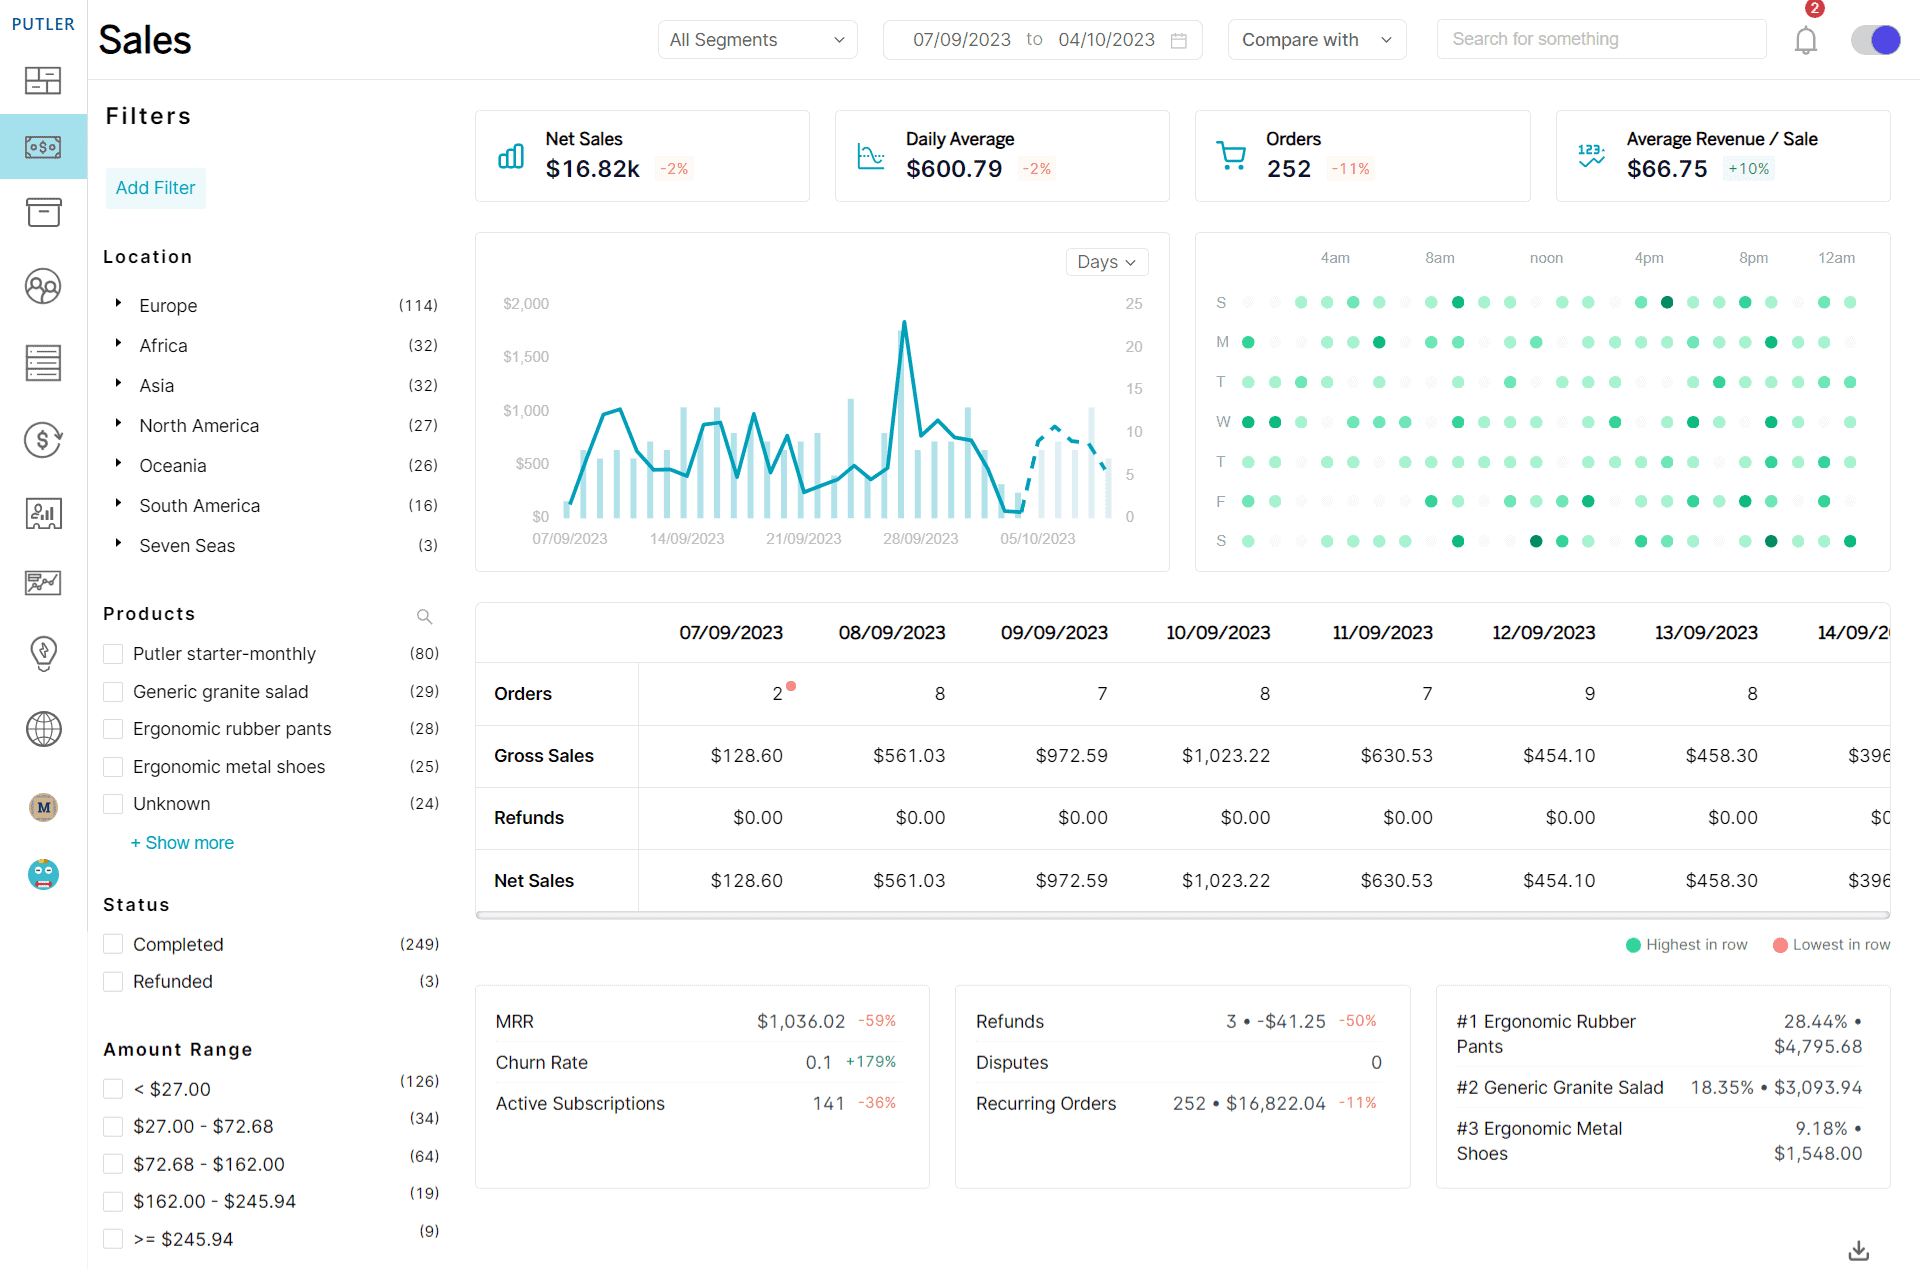
Sales are the lifeblood of any business, and tracking them effectively is crucial. Putler makes it seamless with KPIs that keep your entire team on the same page.
Some Sales KPIs tracked in Putler:
- Net Sales: Total sales after returns and discounts.
- Gross Sales: The raw sales number before any deductions.
- Average Sales: Average of daily sales.
- Forecasted Sales: See what your future revenue looks like based on past performance.
- Sales Heatmap: A visual representation of your sales peaks and lows.
Product KPIs
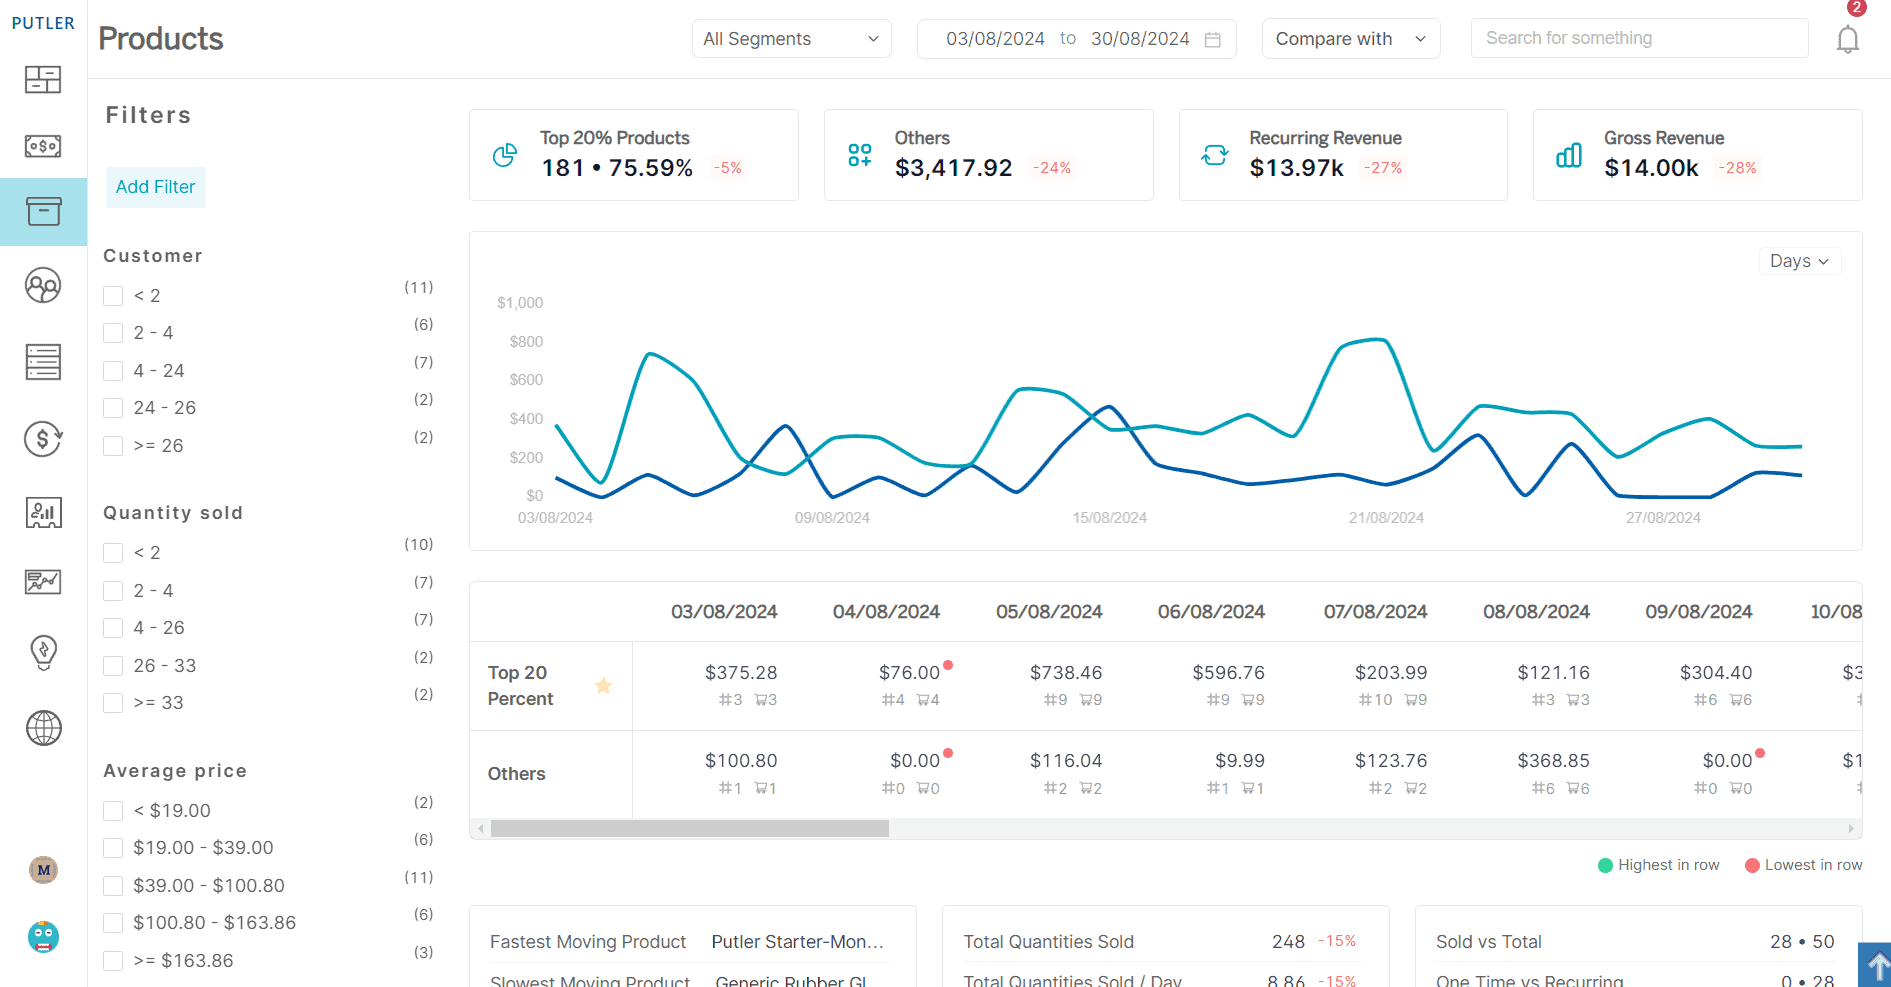
Monitoring product performance is essential to understand which items are driving revenue. Putler gives you a range of insightful metrics:
- Product Leaderboard: A ranked list of top-selling products.
- Top 20% Product Contribution: The best performers that bring in most of your revenue.
- Fastest Moving Product: Track products that are flying off the shelves.
- Slowest Moving Product: Identify items that need a boost or reconsideration.
- Products Frequently Bought Together: Discover customer buying patterns.
Customer KPIs
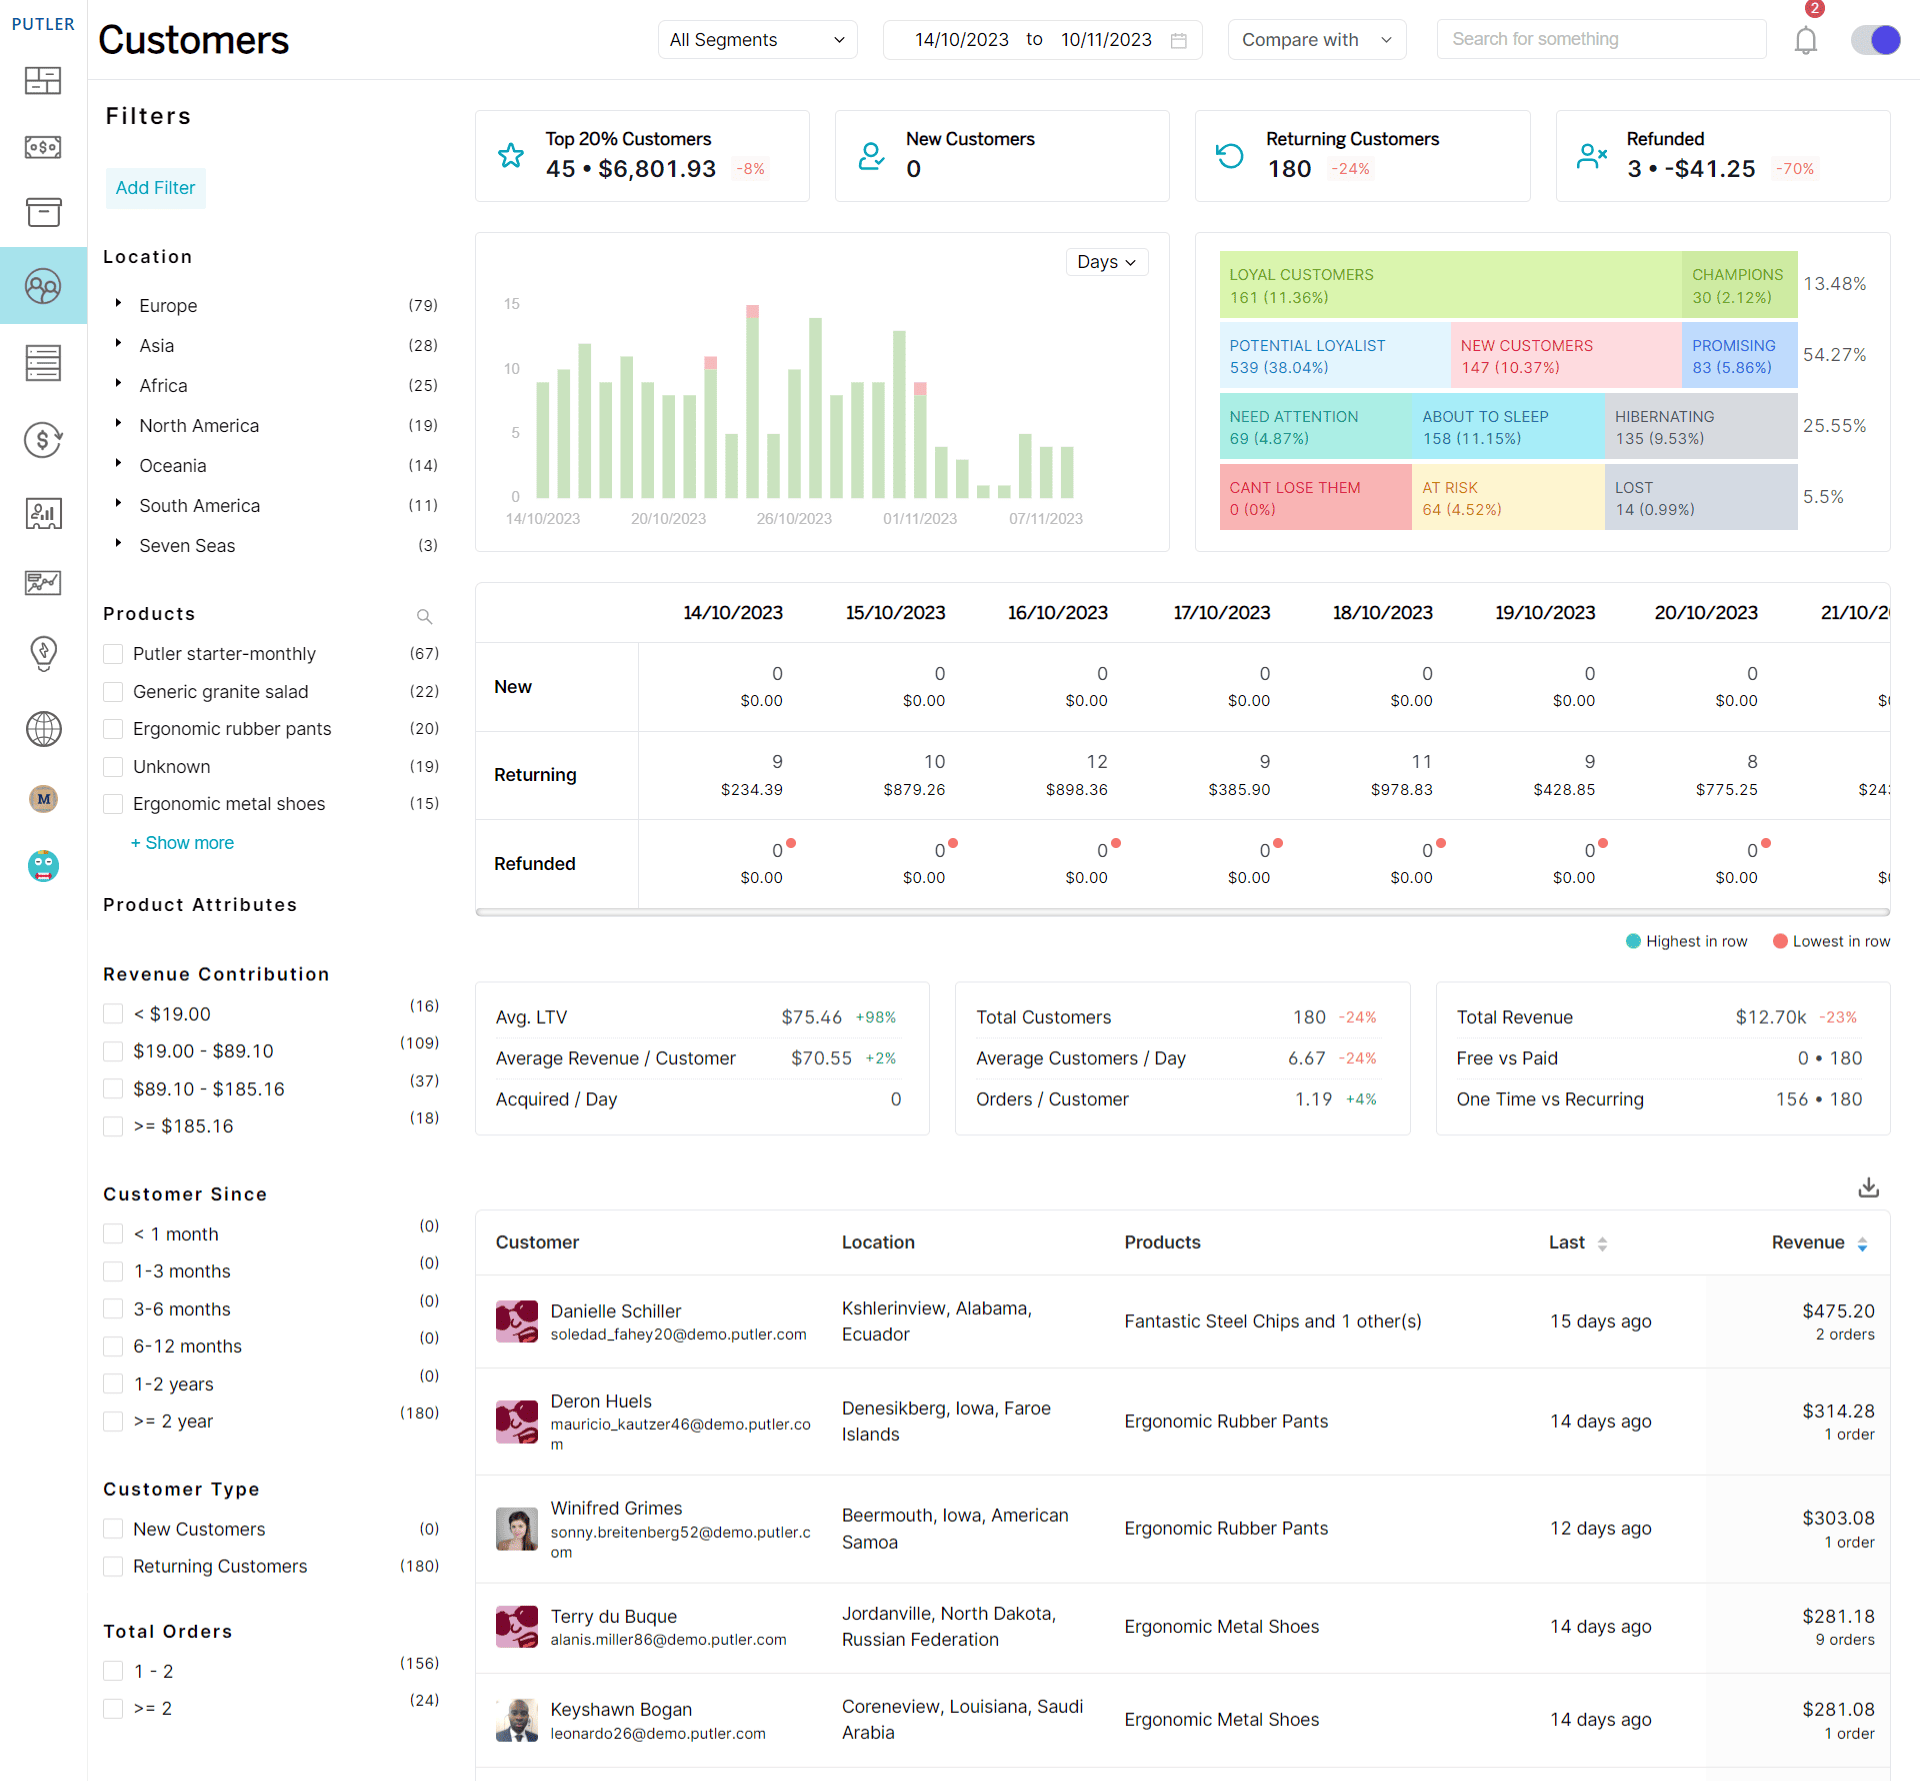
Customers are the heart of your business. Putler offers key customer-focused metrics to understand your audience better.
- Average LTV: Learn the lifetime value of your customers.
- Order/Customer: Measure how frequently customers place orders.
- Revenue/Customer: Find out how much each customer contributes.
- Refunded: Keep track of refunded amounts and customers.
- Purchase History: Get a detailed view of each customer’s buying habits.
- Customer Segments: Segment your audience into New, Returning, and Lost customers.
SaaS KPIs
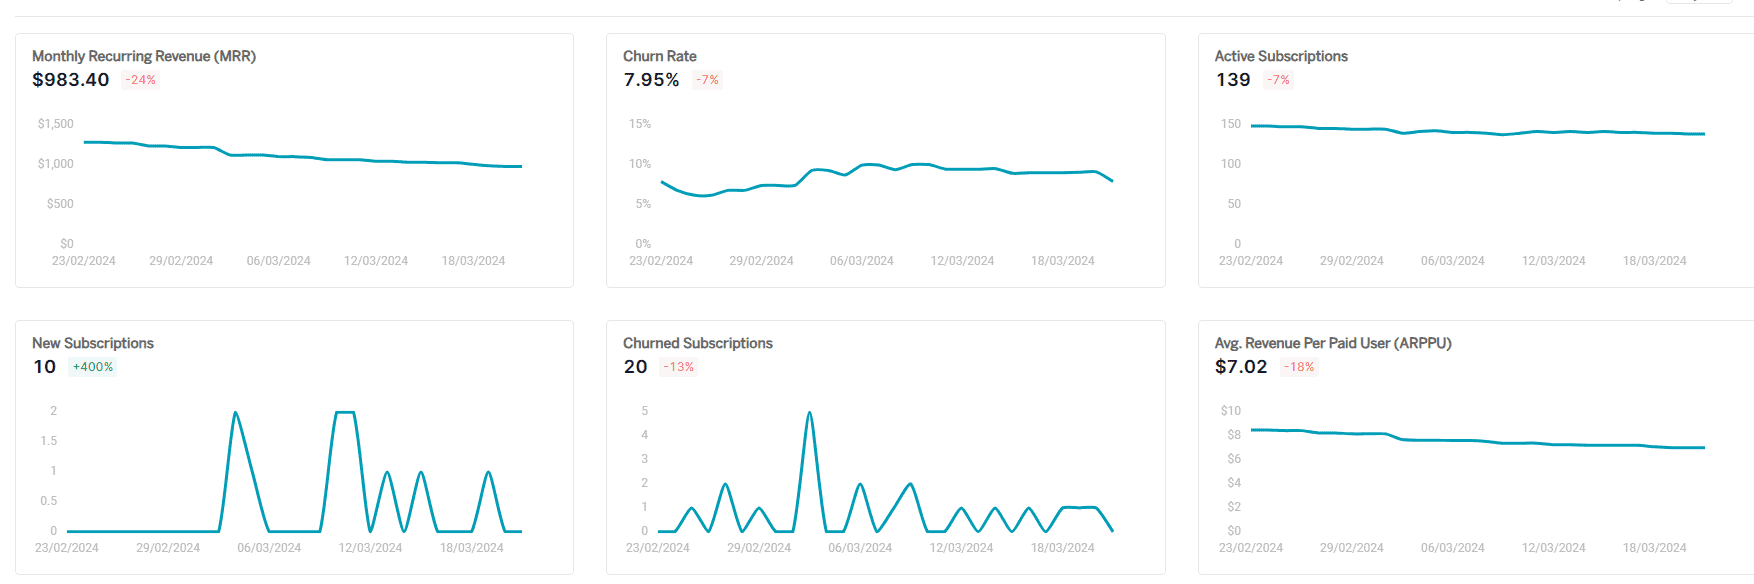
For SaaS businesses, Putler goes beyond basic metrics and offers in-depth insights that matter most for subscriptions.
- MRR (Monthly Recurring Revenue): A core metric for any subscription-based business.
- ARPpU (Average Revenue Per User): Understand how much each customer is worth monthly.
- Churn: Monitor how many customers you’re losing.
- CLV (Customer Lifetime Value): Project how much a customer will bring in over time.
- New Subscription: Track how many new subscribers gained in given period
Website Performance KPIs
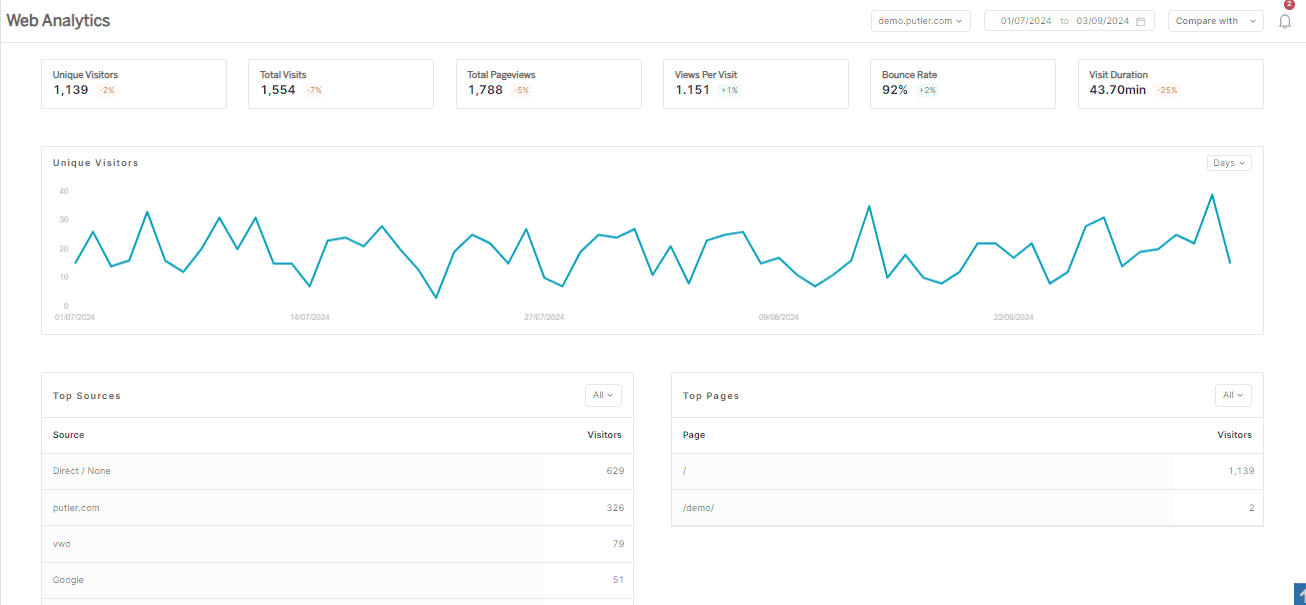
Putler integrates seamlessly with Google Analytics, letting you monitor critical website metrics without switching between tools.
- Unique Visitors: know how many distinct individuals are engaging with your content. First-timers? Regulars? Now you know.
- Bounce Rate: This KPI tells you when and where you’re losing potential conversions.
- Total Visits: Total visits show your overall traffic health and help you spot spikes, dips, and trends.
- Top Pages: Find out which pages are performing and which are sleeping. Prioritize accordingly.
Our final word
A KPI isn’t just a random number—it’s a reflection of your company’s core objectives, designed to measure what truly matters.
The trick is not just knowing your business goals, but translating them into meaningful metrics you can track. And, as with all things in life, there’s no “one-size-fits-all” solution. Different businesses need different KPI reports.
But if you’re looking to simplify the complexity and want one tool to track your KPIs seamlessly, Putler is your go-to. It’s packed with the most essential KPIs, easy to share with your team, simple to set up, and powerful enough to drive decisions.
FAQs
What is the difference between a KPI and a metric?
KPIs are specific metrics that are closely associated with the strategic objectives. In simple words, they help in measuring progress towards specific goals.
On the other hand, metrics are general measurements of performance. It is not associated with a particular goal.
For example, web traffic metrics are metrics. Whereas, the conversion rate can be a KPI for a company.
How often should I generate KPI reports?
The frequency of KPI reports depends on the business needs. So you can get a report daily, weekly, monthly, or quarterly.
A good rule can be monthly or quarterly. But you can track weekly or even daily if you can make some crucial changes.
What are some common challenges in KPI reporting?
Common challenges in KPI reporting can be:
- Data Accuracy
- Relevancy
- Interpretation
You can easily resolve them by:
- Ensuring data sources are reliable and accurate
- Regularly review and update KPIs
- Provide training for team members
- Use reporting tools for clear visualizations and better understanding