

“If you can’t explain an eCommerce metric in terms of dollars gained, it’s probably not worth tracking.” That’s what I learned after years helping online stores grow.
Most guides to eCommerce metrics hand you thirty definitions and leave you to work out which ones matter. This one does the opposite. It starts with the order you should track them in, gives you benchmarks to judge your own numbers against, and only then gets into definitions.
By the end you’ll know which eCommerce metrics and KPIs to track in your first 90 days, which ones to layer in after that, and what a good number looks like for each.
eCommerce metrics vs KPIs: what’s the difference?
eCommerce metrics are all the numbers you can track. KPIs are the handful tied directly to a goal you’re actively working on.
Revenue is a metric. Revenue growing 20% this quarter is a KPI. The difference isn’t academic. It decides what earns space on your dashboard.
A metric becomes a KPI the moment you attach a decision to it. Your 62% cart abandonment rate was just another number until you worked out that cutting it by 10 points would add six figures in annual revenue. Now it’s the thing your weekly meeting is built around.
Two things follow from that:
- You’ll track 25 eCommerce analytics metrics and act on maybe six
- The six change as your business changes, which is why the layering below matters more than the list
Which eCommerce metrics and KPIs should you track first?
Track eCommerce metrics in three layers, not all at once. Dashboard overload is real, and it kills the clarity that makes metrics useful in the first place.
Here’s the order I use.
Layer 1, your first 90 days: conversion rate, average order value, revenue, traffic sources, cart abandonment rate, revenue per visitor, and bounce rate. These seven answer three questions. Are people finding you? Are they buying? Is each visit worth anything?
Layer 2, once Layer 1 is stable: customer lifetime value, customer acquisition cost, retention rate, churn rate, repeat purchase rate, purchase frequency, and top customers. This layer decides whether your business model works at scale. A store with great conversion and terrible retention is running on a treadmill.
Layer 3, for stores past year one: gross and net margin, product margin, inventory turnover, stock-out rate, return rate, ROAS, and top-selling products. This is where the hidden profit lives for most established stores.
The goal isn’t a smaller dashboard for its own sake. It’s a dashboard where every number has a decision attached to it. If a metric doesn’t change what you do next, it doesn’t belong there yet.
To go deeper on the thinking behind this, read eCommerce analytics 101.
eCommerce metrics benchmarks: what good actually looks like
Benchmarks are the fastest way to know whether an eCommerce metric is a problem or just a number. Here’s what the 2026 data says across the eCommerce metrics with defensible public figures.
| Metric | Poor | Average | Good |
|---|---|---|---|
| Conversion rate | Below 1% | 1.8% to 3% | Above 3.2% |
| Cart abandonment | Above 80% | Around 70% | Below 60% |
| Customer retention rate | Below 20% | 30% to 31% | 45% to 55% |
| Annual churn rate | Above 80% | 70% to 75% | Below 60% |
| Repeat purchase rate | Below 15% | 15% to 30% | Above 30% |
| CLV to CAC ratio | Below 1:1 | 3:1 | 3:1 to 5:1 |
| Product return rate | Above 25% | 19% to 21% | Below 10% |
| ROAS | Below 2:1 | 4:1 | Above 5:1 |
Four things worth knowing about these numbers.
The global conversion average is disputed: depending on the dataset you’ll see 1.4%, 1.6%, 1.89%, 2.5%, or 2.9%, and each is correct for its own population. Littledata’s Shopify sample of 2,800 sites lands at 1.4%. IRP Commerce puts it near 1.7% in April 2026. Most other analyses converge on 2.5% to 3%. If you run a small to mid Shopify store, the lower figures are your real peer group.
Industry matters more than the global average: food and beverage leads at 4.5% to 6.11%. Luxury and jewelry sits at 0.87% to 1.46%. A 1% conversion rate is healthy in luxury and a serious problem in food.
Higher CLV to CAC isn’t automatically better: a ratio above 5:1 usually means underinvestment in acquisition rather than efficiency. You’re leaving growth on the table.
Retention numbers look brutal because they are: annual churn of 70% to 75% is normal in eCommerce. Most stores leak customers constantly, which is exactly why Layer 2 exists.
Key metrics for eCommerce: your first 90 days
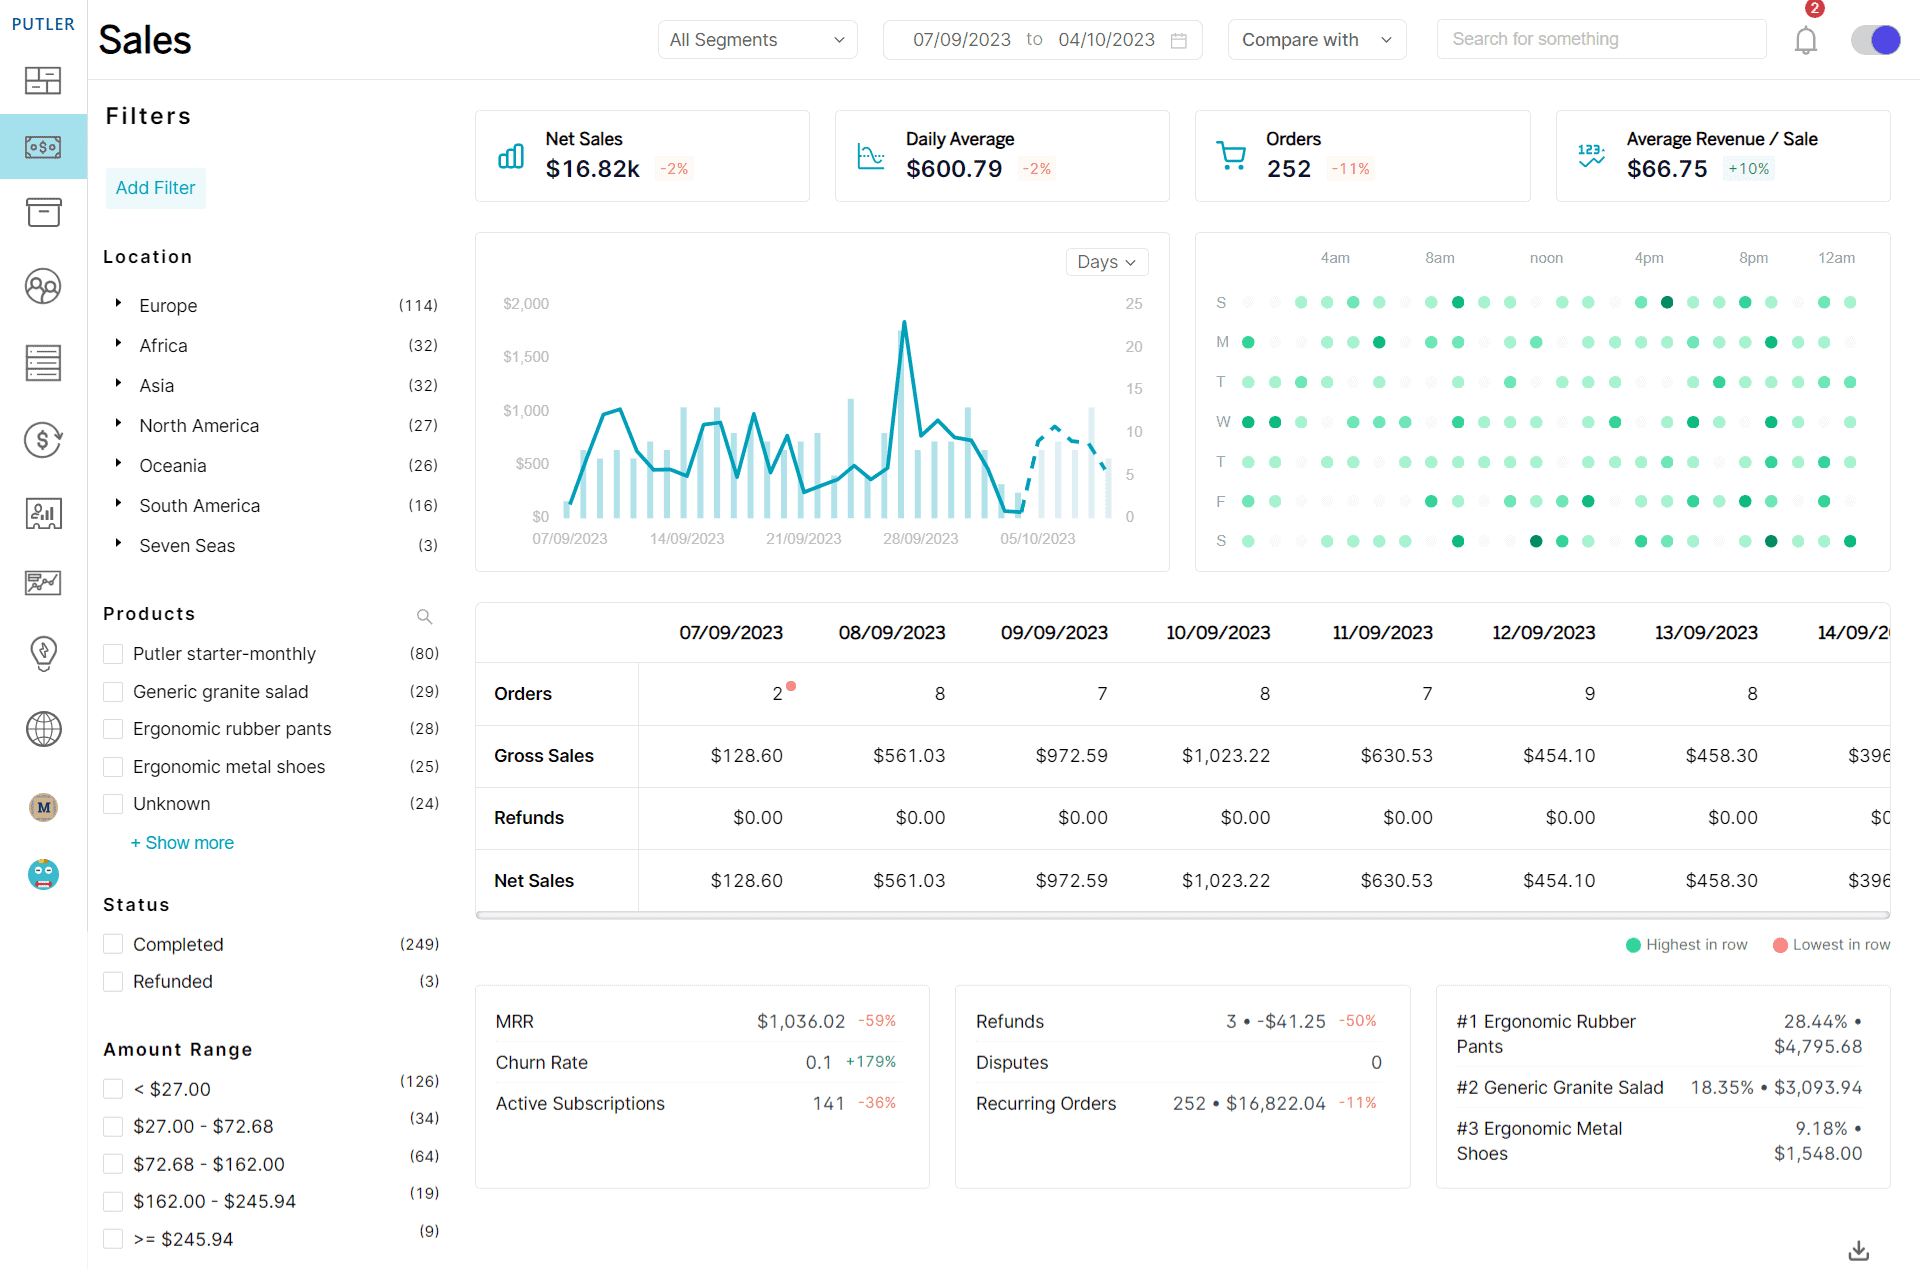
These seven eCommerce metrics tell you whether the fundamentals work. Track them before anything else, because every metric in Layer 2 and Layer 3 assumes these are already healthy.
Conversion rate
What it is: The percentage of visitors who complete a purchase.
Conversion Rate = (Conversions ÷ Total Visitors) × 100%Benchmark: 1.8% to 3% globally, though the figure depends heavily on your dataset. UK and Ireland stores should reference IRP Commerce’s live benchmark rather than the higher US-weighted figures. Above 3.2% puts you in the top 20% across industries.
Why it matters: It’s the single number that turns traffic into revenue. A half-point improvement is worth more than most traffic campaigns.
Average order value (AOV)
What it is: How much a customer spends per order.
AOV = Total Revenue ÷ Number of OrdersBenchmark: The global figure sits around $150. Shopify stores average $85.50. By vertical the spread is wide: food and beverage $42 to $55, beauty $67 to $72, fashion $86, home $142, electronics $312, luxury and jewelry $284 to $364. Desktop runs 15% to 25% higher than mobile.
Why it matters: Increasing AOV by 10% has the same revenue impact as increasing traffic by 10%, without spending anything on acquisition.
Revenue
What it is: Total money the store brings in before expenses.
Revenue = Price × Quantity SoldBenchmark: No universal benchmark exists here. Revenue only means something against your own trajectory and your cost base, which is why it sits alongside margin in Layer 3.
Why it matters: Without revenue you don’t have a business. You have an expensive hobby.
Revenue per visitor (RPV)
What it is: The average revenue each visitor generates.
RPV = Total Revenue ÷ Total VisitorsBenchmark: IRP Commerce recorded revenue per session at £1.69 in April 2026, up 9.7% year over year.
Why it matters: RPV accounts for conversion rate and AOV in a single number. A store can improve conversion while losing money if AOV falls at the same time. RPV catches that. Neither metric alone does.
Cart abandonment rate
What it is: The percentage of shoppers who add to cart and leave without buying.
Cart Abandonment Rate = (Abandoned Carts ÷ Total Carts Created) × 100%Benchmark: Around 70.2% globally. The biggest single cause is unexpected costs at checkout, responsible for roughly 48% of abandonment.
Why it matters: These are your most recoverable lost sales. The shopper already decided they wanted the product.
Traffic sources
What it is: The channels bringing visitors to your store, including direct, organic search, paid ads, referrals, and social.
Benchmark: Conversion varies sharply by channel. Referral and affiliate traffic converts highest at 4% to 5.4%. Email follows at 2% to 8% depending on list quality. Organic search averages 2.7% to 3%. Paid social sits lowest at 0.7% to 1.2%.
Why it matters: Channel mix explains more conversion-rate variance than most store owners expect. A store running heavy paid social with a 1.5% conversion rate may be performing perfectly well for its mix.
Bounce rate
What it is: The percentage of visitors who leave after viewing one page without interacting.
Bounce Rate = (Single-Page Sessions ÷ Total Sessions) × 100%Benchmark: IRP Commerce recorded 46.74% in April 2026, up from 38.63% a year earlier.
Worth knowing: GA4 replaced bounce rate with engagement rate as its primary signal and defines a bounce as the inverse of an engaged session. If you’re reading GA4, you’re looking at engagement rate whether you call it that or not.
Why it matters: High bounce usually means a traffic-to-page mismatch rather than a bad page. Check the channel before you redesign anything.
Customer eCommerce analytics metrics that decide whether you scale
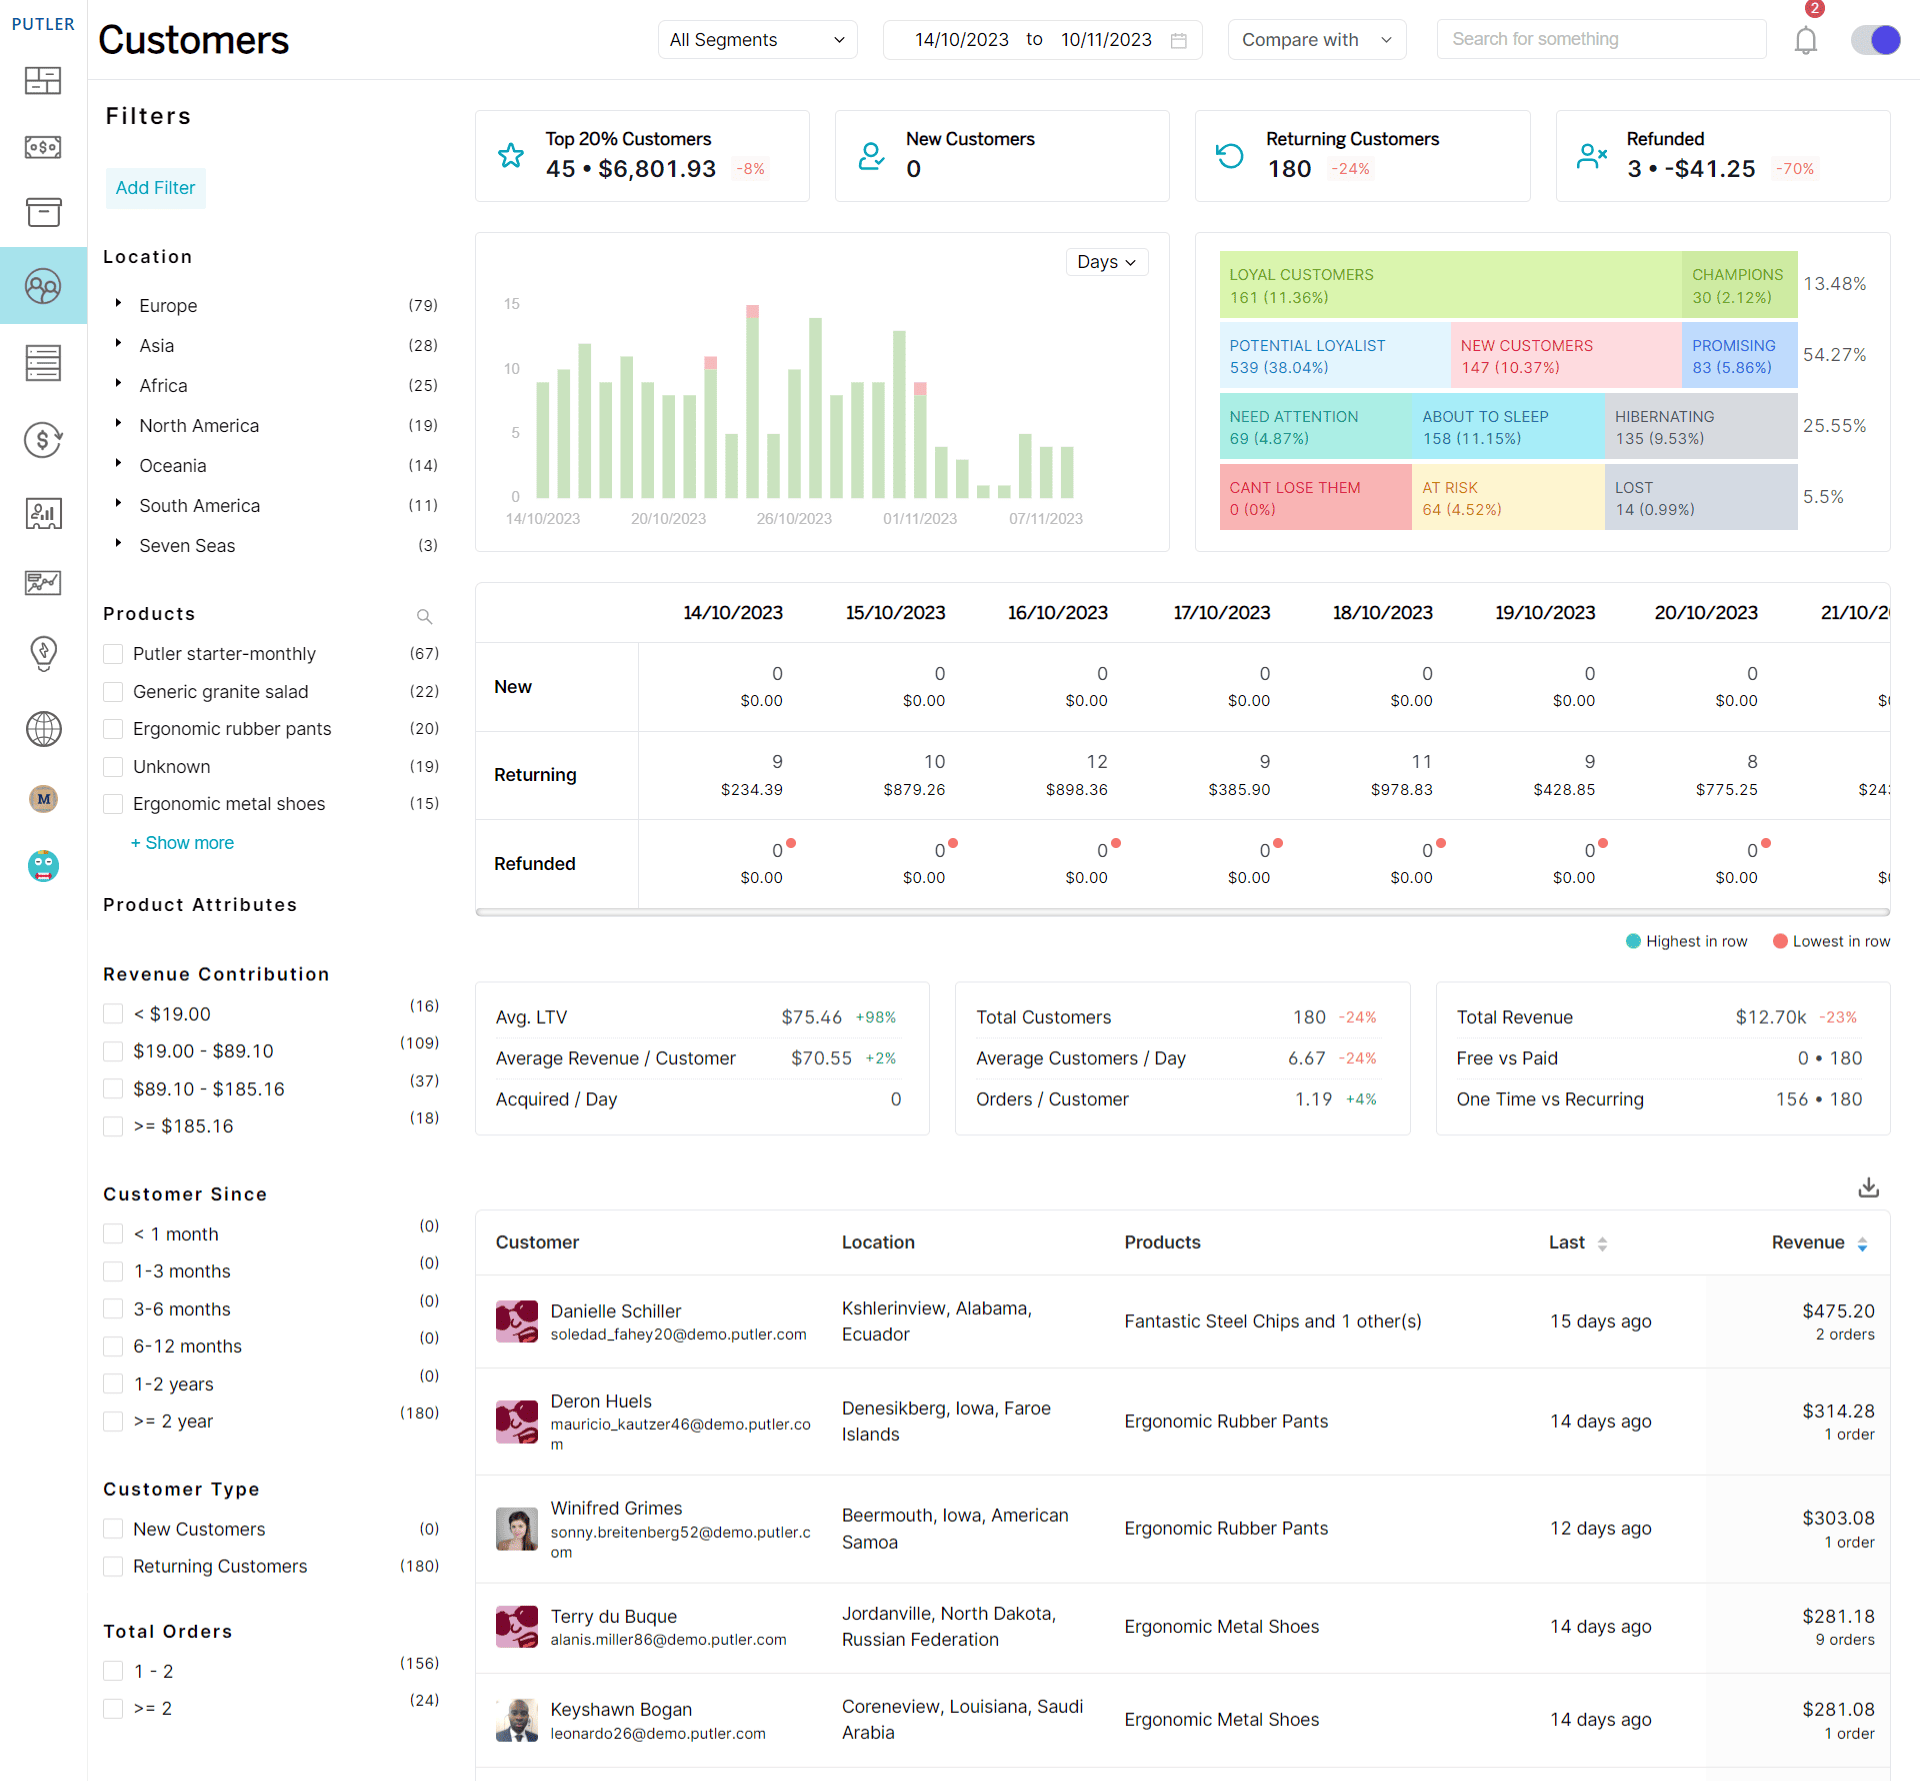
Layer 1 eCommerce metrics tell you whether the store works. Layer 2 tells you whether the business works. These eCommerce KPIs answer one question: does a customer earn back more than they cost?
Customer acquisition cost (CAC)
What it is: The total cost to acquire one new customer, including all marketing and sales spend.
CAC = Total Marketing and Sales Costs ÷ New Customers AcquiredBenchmark: The figures disagree sharply depending on what gets counted. Several 2026 analyses put average eCommerce CAC between $68 and $84, while Shopify’s Global Commerce Report puts the merchant-wide average at $318 once all acquisition costs are included. First Page Sage places consumer eCommerce around $274. The spread is about scope, not contradiction. The low figures count ad spend. The high ones count everything.
Worth knowing: eCommerce CAC is up roughly 40% since 2023. If acquisition feels harder than it used to, that’s not your imagination.
Why it matters: CAC alone tells you nothing. It only means something next to lifetime value.
Customer lifetime value (CLV)
What it is: The total revenue you can expect from a customer across the whole relationship.
CLV = Average Order Value × Purchase Frequency × Average Customer LifespanBenchmark: No single CLV figure is useful, because it scales with your AOV and category. The ratio below is the benchmarkable part.
Why it matters: CLV justifies your acquisition spend. A $75 CAC is excellent if customers spend $400 over their lifetime and fatal if they spend $80.
CLV to CAC ratio
What it is: The relationship between what a customer is worth and what they cost.
CLV:CAC = Customer Lifetime Value ÷ Customer Acquisition CostBenchmark: 3:1 is the widely cited target. Below 3:1, acquisition is often unprofitable. Above 5:1 or 6:1 usually signals underinvestment in growth rather than efficiency. Aim for a payback period under 120 days alongside it.
Why it matters: This is the single number that tells you whether scaling marketing will make money or accelerate losses. Track CAC and CLV separately and you can miss the relationship entirely.
Customer retention rate (CRR)
What it is: The percentage of customers who keep buying over a period.
CRR = ((Customers at End of Period - New Customers) ÷ Customers at Start) × 100%Benchmark: Average DTC eCommerce retention sits at 30% to 31%. Top performers reach 45% to 55%, and the difference comes mostly from having a coordinated post-purchase program rather than from better products.
Why it matters: A 5% improvement in retention can lift profits by 25% to 95%, according to research from Bain & Company. Acquiring a new customer costs five to 25 times more than keeping one.
Churn rate
What it is: The percentage of customers who stop buying in a period.
Churn Rate = (Customers Lost During Period ÷ Customers at Start) × 100%Benchmark: Annual eCommerce churn averages 70% to 75%. For DTC subscription models, monthly churn runs 6.5% to 8.5%, with below 6% considered strong and above 10% signalling a real problem.
Worth knowing: Churn and retention are inverse. If your CRR is 30%, your churn is 70%. Tracking both as separate KPIs is duplication.
Why it matters: High churn undermines every growth effort. It’s a leaky bucket, and no volume of new customers compensates.
Repeat purchase rate
What it is: How much of your order volume comes from returning customers.
Repeat Purchase Rate = Repeat Orders ÷ Total OrdersBenchmark: 15% to 30% is typical, with 25% to 30% considered strong.
Why it matters: Repeat customers convert at 4.5% to 6% against 1% to 2% for first-time visitors, and they spend more per order. They’re your cheapest revenue.
Purchase frequency
What it is: How often the average customer buys in a given period.
Purchase Frequency = Number of Orders ÷ Number of Unique CustomersBenchmark: No universal figure, because frequency is category-bound. Consumables run high, furniture runs low. Retention by category is the better proxy, with consumables at 35% to 45%.
Why it matters: Frequency is the multiplier inside CLV. Raising it lifts lifetime value without touching AOV or acquisition spend.
Top customers
What it is: Your highest-value buyers ranked by spend, frequency, or recency.
Benchmark: The 80/20 pattern usually holds, with roughly 20% of customers driving 80% of revenue.
Why it matters: This is a report rather than a metric, and it’s where retention effort should concentrate. Segmenting by recency, frequency, and monetary value tells you who to protect first.
Product and profit eCommerce metrics for established stores
Layer 3 eCommerce metrics are where the hidden profit lives. Most stores past year one leak margin somewhere in these metrics without noticing, because revenue keeps climbing and nobody checks the math underneath.
Gross and net profit margin
What it is: Gross margin is what’s left after product costs. Net margin is what’s left after everything.
Gross Margin = ((Revenue - COGS) ÷ Revenue) × 100%Net Margin = ((Revenue - All Expenses) ÷ Revenue) × 100%Benchmark: Gross margins typically run 30% to 60%, with wide vertical spread: beauty and personal care 65% to 85%, supplements 65% to 78%, apparel 50% to 65%, food and beverage 28% to 42%. Net margin sits at 2% to 5% for startups and 5% to 15% for established stores.
Worth knowing: There’s a threshold effect around 70%. Brands with gross margins above it are far more likely to reach and sustain eight-figure revenue. Below 65%, scaling gets hard because there isn’t enough margin left to fund acquisition and still show profit.
Why it matters: High revenue with thin margins means you’re working hard for very little reward.
Product margin
What it is: The profit on each individual product after cost of goods.
Product Margin = ((Sales Price - Cost) ÷ Sales Price) × 100%Benchmark: Use your vertical’s gross margin range as the floor. Any product sitting more than 10 points below your store average deserves a pricing or sourcing review.
Why it matters: A bestseller at 10% margin can quietly destroy the profit of a slower product at 60%. Your revenue ranking and your profit ranking are rarely the same list.
Inventory turnover ratio
What it is: How many times you sell and replace inventory in a period.
Inventory Turnover = Cost of Goods Sold ÷ Average Inventory ValueBenchmark: 6x to 12x per year is healthy for eCommerce, with 30 to 60 days of inventory outstanding as the target for most categories. Fashion spreads widely: 3x at the 25th percentile, 7x at the 75th. Consumer electronics runs around 3.5x.
Worth knowing: Improving turnover from 4x to 6x on the same sales volume frees roughly a third of the working capital tied up in stock. That’s one of the fastest cash-flow improvements available to a store.
Why it matters: Slow inventory ties up cash and racks up storage costs.
Stock-out rate
What it is: How often your products are unavailable to buy.
Stock-Out Rate = (Days Item Out of Stock ÷ Total Days) × 100%Benchmark: No clean public figure exists. Retail carrying cost runs 20% to 30% of inventory value, which is the counterweight worth remembering. Over-ordering to eliminate stock-outs has its own cost.
Why it matters: Stock-outs are lost sales you never see in your analytics, plus brand damage when they repeat.
Product return rate
What it is: The percentage of sold items customers send back.
Return Rate = (Units Returned ÷ Units Sold) × 100%Benchmark: 19% to 21% overall in 2026, roughly two to three times the brick-and-mortar rate of 5% to 8.9%. By category: apparel 25% with a range of 20% to 40%, footwear 18%, home and furniture 15% to 20%, electronics 10% to 11%, beauty 8%, supplements 7%.
Worth knowing: Returns cost more than the headline suggests. Each one costs $10 to $65 to process, and a 25% return rate can cut unit contribution margin by around 70%, not 25%, because you lose the margin plus reverse logistics and refurbishment.
Why it matters: Return rate is the metric most likely to be quietly destroying margin while revenue looks fine.
Return on ad spend (ROAS)
What it is: The revenue generated for every dollar spent on advertising.
ROAS = Revenue Attributed to Ads ÷ Cost of AdsBenchmark: 4:1 is the commonly cited target. Below 2:1 usually means campaigns need serious attention.
Worth knowing: ROAS targets only mean something against your margin. On a 30% gross margin, a 4:1 ROAS is close to break-even once you count COGS and fulfilment. Calculate your break-even ROAS before setting a target.
Why it matters: It’s the fastest read on whether ad spend is building the business or burning it.
Top-selling products
What it is: The products driving the most revenue or units over a period.
Benchmark: The 80/20 pattern usually applies here too, with a small group of products carrying most of the revenue.
Why it matters: This is a report rather than a metric, and it’s most useful cross-referenced with product margin. Your top seller by revenue and your top seller by profit are often different products, and the gap between those lists is where merchandising decisions get made.
Building your eCommerce metrics dashboard
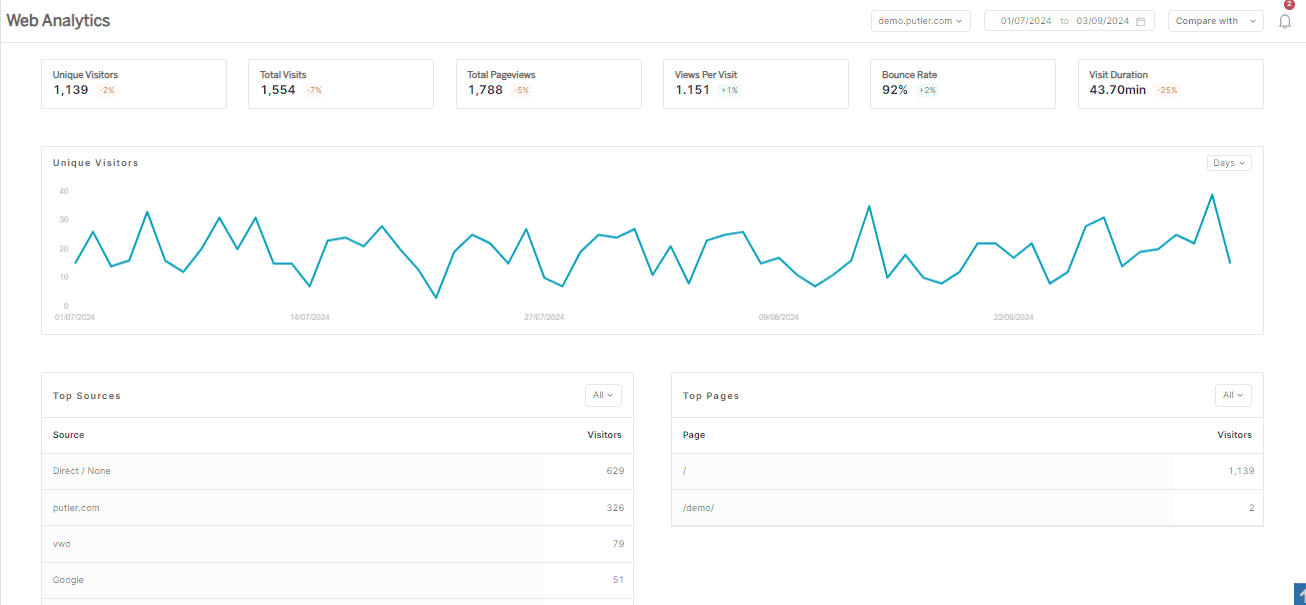
Tracking these eCommerce metrics individually is only half the job. The advantage comes from seeing them together, because most eCommerce metrics only mean something next to another one.
A few pairings worth watching:
- Conversion falling while bounce rises: almost always a traffic-mix problem, not a page problem
- AOV rising while purchase frequency falls: your product mix shifted, and CLV may be flat despite the AOV win
- Healthy ROAS on a thin gross margin: you may be buying revenue at a loss
- Return rate against product margin: the combination that decides whether a bestseller is actually profitable
How often to check each layer
Daily: sales, traffic, and any sharp spike or drop. This is an early warning system, not a decision-making layer. Acting on daily noise is how people talk themselves into changes that weren’t needed.
Weekly: conversion rate, cart abandonment, and channel performance. Enough data to see direction without day-to-day noise misleading you.
Monthly: CLV, CAC, retention, margin, and inventory turnover. These inform what you build, fund, and fix next quarter.
Why most eCommerce dashboards fall short
The problem usually isn’t the metrics. It’s that they live in different places.
Your payment gateway holds transaction data. Your store platform holds product and order data. Google Analytics holds traffic and behaviour. Sell across more than one channel and you multiply that by every channel you run. Assembling a single view means exporting from each source and reconciling by hand, usually monthly, usually late.
That’s the gap Putler closes. It pulls sales, customers, products, and transactions from your store, payment gateways, and analytics into one eCommerce metrics dashboard, so the pairings above are visible without a spreadsheet.
What changes in practice:
- Combined and per-source views: total revenue across every channel, or one channel at a time
- Customer segmentation: RFM analysis identifies your top customers instead of guessing
- Product-level profit: revenue and margin side by side, so the two rankings stop hiding from each other
- Forecasting: revenue and customer projections built on your actual history
- No manual exports: the monthly reconciliation step disappears
Putler starts at $20/month with a 14-day free trial and connects 17+ data sources including Shopify, WooCommerce, Stripe, PayPal, Etsy, and Amazon.
FAQs
What are eCommerce metrics?
eCommerce metrics are measurable values that track how your online store performs across sales, marketing, customer behaviour, and inventory. They turn raw data like order counts and visitor numbers into measurements you can act on.
What is the difference between eCommerce metrics and KPIs?
Metrics are all the numbers you can track. KPIs are the few tied directly to a goal you’re working on. Revenue is a metric. Revenue growing 20% this quarter is a KPI. A metric becomes a KPI when you attach a decision to it.
What are the most important eCommerce KPIs to track?
Conversion rate, average order value, customer lifetime value, customer acquisition cost, cart abandonment rate, and churn rate. Together these six show whether the store converts, whether customers are worth what you pay for them, and whether they come back.
What is a good eCommerce conversion rate?
Between 1.8% and 3% globally, though it depends on your dataset and industry. Food and beverage averages 4.5% to 6%, luxury and jewelry 0.87% to 1.46%. Above 3.2% puts you in the top tier. Benchmark against your category, not the global average.
What is a good CLV to CAC ratio?
3:1 is the standard target, meaning each customer returns three times what they cost to acquire. Below 3:1, acquisition is often unprofitable. Above 5:1 usually signals underinvestment in growth rather than efficiency.
What is the average eCommerce return rate?
Around 19% to 21% in 2026, two to three times the brick-and-mortar rate. Apparel is highest at about 25%, electronics 10% to 11%, beauty around 8%. Each return costs $10 to $65 to process.
How do I build an eCommerce metrics dashboard?
Start with the six to eight eCommerce metrics tied to your current goals rather than everything available. Connect your store, payment gateway, and analytics to a tool that consolidates them automatically. Then set a review cadence: daily for warning signals, weekly for trends, monthly for strategy.
How often should I check my eCommerce metrics?
Review eCommerce metrics daily for sales and traffic, weekly for conversion and channel performance, monthly for CLV, CAC, retention, and margin. Checking strategic metrics daily produces noise, not insight.
What metrics does Shopify track?
Shopify’s built-in analytics covers total sales, average order value, conversion rate, cart abandonment, and customer lifetime value. For multi-store consolidation, deeper segmentation, and subscription metrics, a dedicated analytics tool covers more ground.
Which eCommerce metrics matter most for your store
The right set of eCommerce metrics isn’t the biggest one. It’s the one where every number has a decision attached to it.
Start with Layer 1 until those seven are stable. Add the Layer 2 eCommerce metrics when you need to know whether the model scales. Add Layer 3 once you’re big enough that hidden margin leaks cost real money.
If you need help making sense of the numbers, Putler’s insights and analytics are there to help you grow.