


Amazon analytics tools are worth paying for when they answer a question your existing reports can’t answer well. Before adding another subscription, decide whether you need profit after costs, product and keyword research, advertising analysis, or combined reporting across stores.
The frustrating part is that these products often appear in the same comparison, even though they solve different problems. A keyword tracker won’t explain your payout, and a revenue dashboard isn’t automatically a complete profit-and-loss report.
This guide compares eight options by reporting job, cost, and limits. Article updated 23 October 2026. Prices and features are based on public vendor documentation; this is a documentation-based comparison, not a connected-account performance test. Putler publishes this guide and is included for its relevant reporting use case.
What can Amazon’s own reporting already tell you?
Start with the reports available in your Amazon account before buying another tool. Business Reports, Brand Analytics, and Profit Analytics serve different needs. Access requirements, cost inputs, and reporting delays matter, so check the specific report rather than treating Seller Central as one complete analytics product.
Use Amazon’s seller dashboard guidance to find the reporting options for your account. Business Reports help you examine sales and traffic; Brand Analytics addresses brand and shopping insights and requires a Professional account plus an eligible Brand Representative role for a brand enrolled in Brand Registry.
Amazon also has Profit Analytics. Its US documentation describes combining sales, returns, fees, ads, and seller-provided costs at product level. Native reporting isn’t limited to gross sales.
The limits still matter. Profit Analytics usually has a one-to-two-day data lag, some fee data can take longer, and some fees are excluded from its estimates; Payments remains authoritative for fee transactions and disbursements.
Check those boundaries before deciding a paid tool fills a gap. For more context on the report families, read the guide to Amazon analytics reports.
Which Amazon analytics tools fit your needs?
Choose by the reporting job and the plan that includes it. The comparison below separates profit analysis, research, advertising, and consolidated reporting. Prices use published US-dollar offers where available; annual equivalents require an annual commitment, and a refund guarantee is different from a free trial.
| Tool | Reporting job | Price or access to check | Important limit |
|---|---|---|---|
| Sellerboard | Amazon profit and cost reporting | Standard $19/month | Standard covers 3000 monthly orders |
| My Real Profit | Financial and advertising reporting | Core $47/month | Sales volume and account charges affect the bill |
| Helium 10 | Research suite and profit tools | Platinum $129/month | Profit features differ between tiers |
| Jungle Scout Catalyst | Research and connected sales analytics | Growth $79/month for Sales Analytics | Starter excludes Sales Analytics |
| SellerApp | Research and advertising | Limited $0 Freemium; Pro from $99/month | Free access is not the full paid platform |
| DataHawk | Marketplace data and BI | Custom annual pricing | Confirm scope and collection cadence |
| Putler | Connected-source revenue and customer reporting | From $20/month up to $10K monthly revenue | Not a complete Amazon profit-accounting tool |
| AMZ Tracker | Rank and listing monitoring | See current vendor pricing | Not a substitute for profit reporting |
These are use-case choices, not a ranking based on measured accuracy. The right Amazon reporting tool depends on the question you need to answer.
1. Check Sellerboard for Amazon profit and cost reporting
Best fit: sellers who want to examine Amazon sales alongside costs and operational expenses, rather than compare revenue alone.
What it reports: Sellerboard focuses on profitability and provides related inventory, reimbursement, and advertising tools. Use the profit view to investigate which products warrant a closer look, then check the underlying costs and transactions before changing prices or replenishment plans.
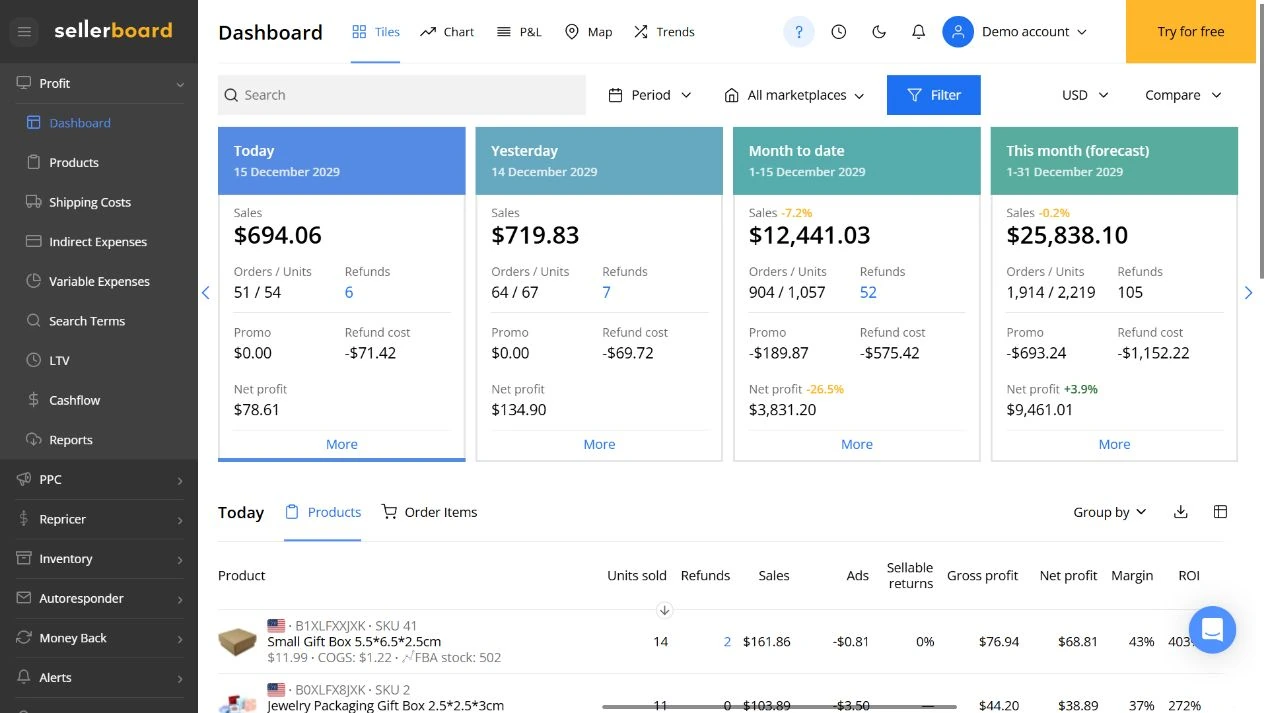
Cost and access: the official plans list Standard at $19/month for up to 3,000 monthly orders and Professional at $29/month for 6,000. Standard’s annual charge is $179, displayed as roughly $15/month; that rounded equivalent isn’t the amount to multiply by twelve. A one-month trial is advertised without a credit card.
Check before choosing: count orders for the accounts you intend to connect and confirm how your own costs enter the calculation. A dashboard can’t compensate for a cost you never supplied.
For merchant feedback beyond the vendor’s materials, read Sellerboard reviews on Capterra.
2. Compare My Real Profit for financial and advertising analysis
Best fit: Amazon businesses that want financial, advertising, and growth reporting in the same platform.
What it reports: My Real Profit combines these views so you can investigate sales and advertising alongside financial performance. Its existing demo illustrates Day-to-Day reporting; the displayed account is a demonstration, not results from a merchant featured in this guide.
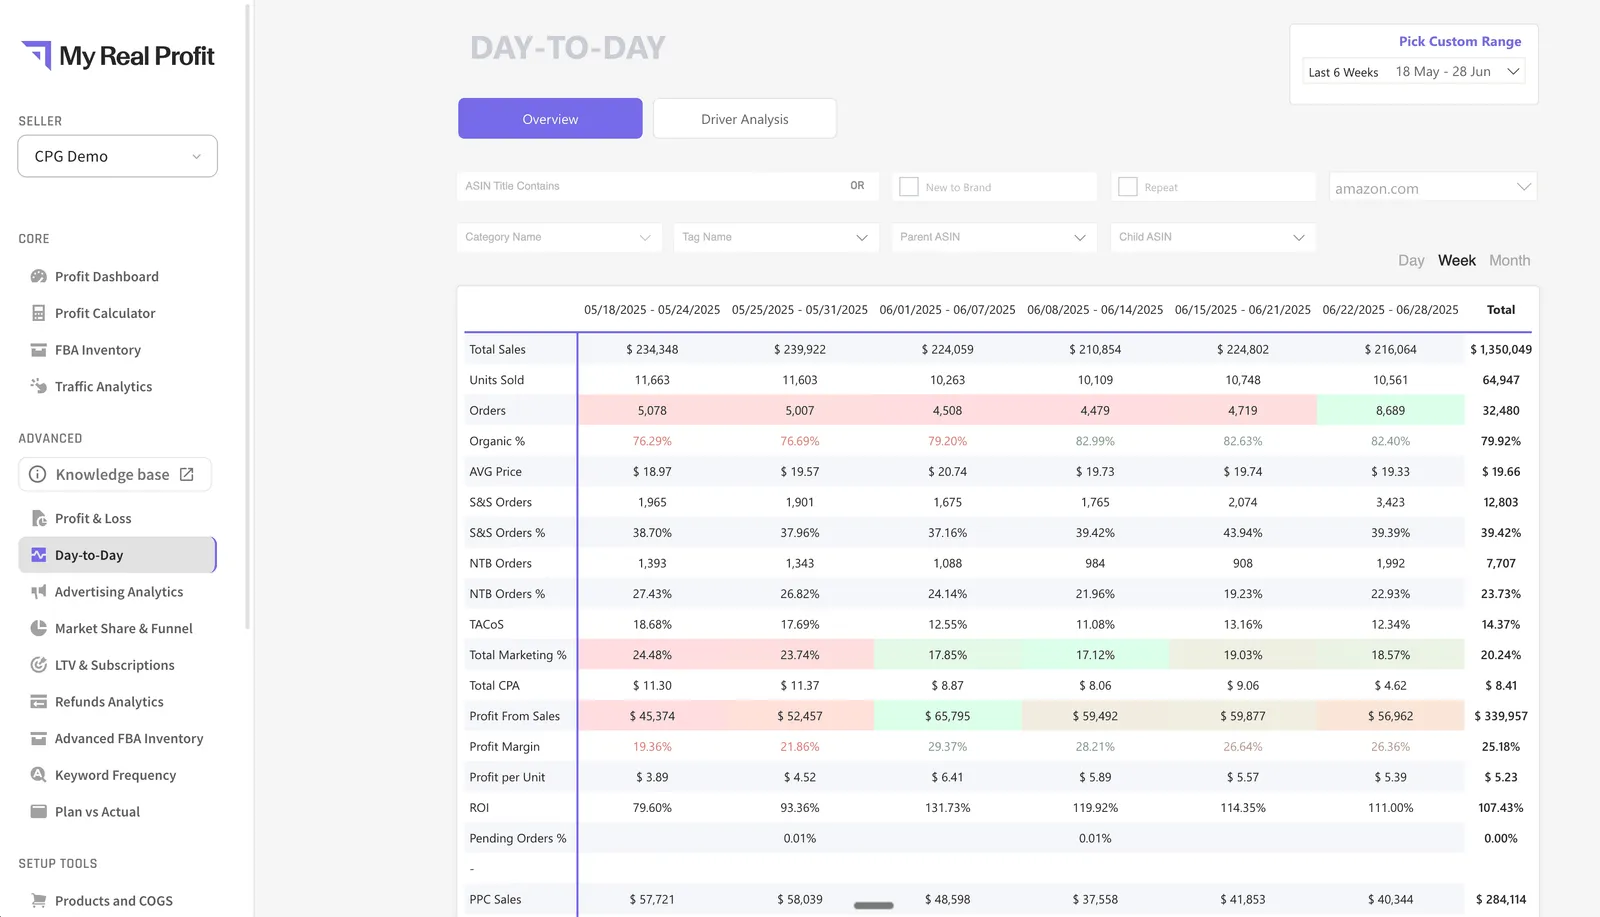
Cost and access: My Real Profit advertises a 21-day trial with no card. Its pricing page lists Core at $47/month and Advanced at $147/month, each including $100K in monthly Amazon sales, with $10 increments per additional $100K.
Check before choosing: compare account allowances as well as features. The published Core and Advanced account inclusions differ, so a higher feature tier doesn’t automatically include more accounts. Estimate volume charges before treating either headline price as your monthly bill.
You can also read My Real Profit feedback on Trustpilot.
3. Check Helium 10’s eligible reporting tier
Best fit: sellers who need product or keyword research as well as reporting, and can justify paying for a broader suite.
What it reports: Helium 10 combines research tools with profit and advertising features whose depth varies by plan. Compare the actual reporting modules you need, rather than assuming every paid subscription includes the same profit-and-loss (P&L) coverage.
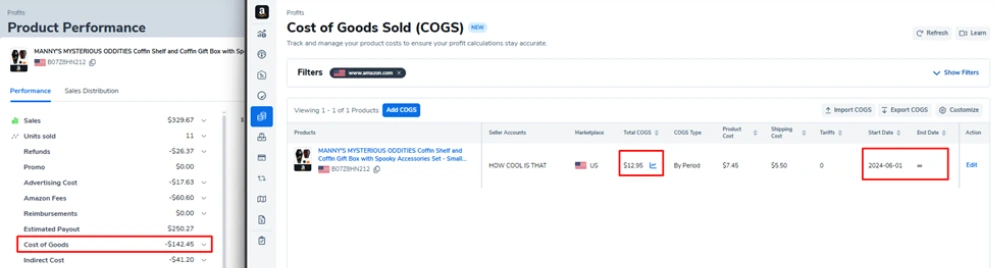
Cost and access: current pricing lists Platinum at $129/month, or $99/month billed yearly; Diamond is $359/month, or $279/month billed yearly. The plan cards distinguish limited profit reporting from fuller P&L features.
Check before choosing: Platinum’s annual equivalent means $1,188 for a year. That commitment is different from paying $99 for one month, and limited free access isn’t a free trial of every paid feature. The initial-payment seven-day refund policy has its own conditions.
Explore Helium 10 or read Capterra reviews after identifying the required tier.
4. Choose the right Jungle Scout Catalyst plan
Best fit: sellers who want research tools and connected sales analysis within Jungle Scout’s Catalyst offering.
What it reports: the useful distinction is between finding product opportunities and analyzing your own sales. For the latter, check Sales Analytics specifically; the lowest-priced subscription isn’t automatically the reporting plan you need.
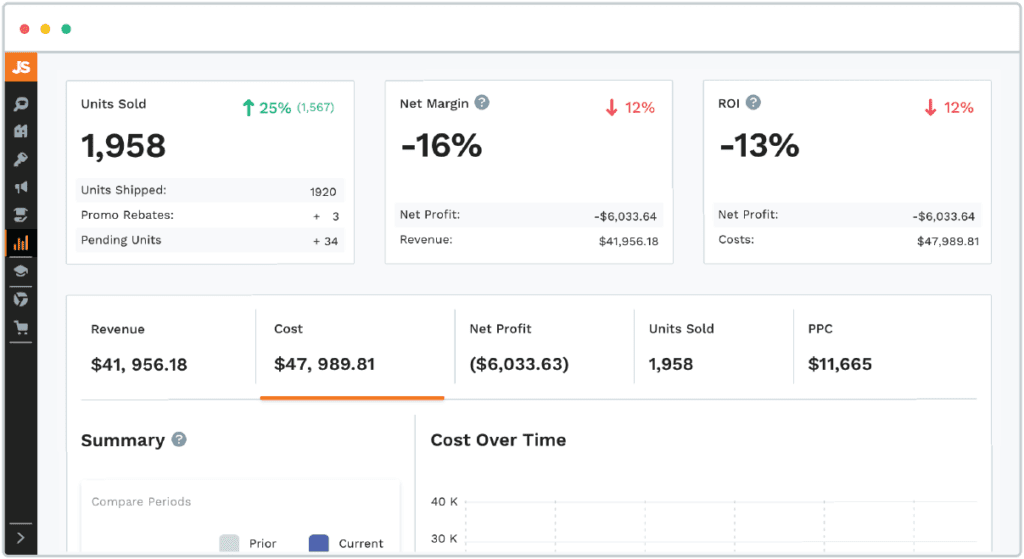
Cost and access: the Catalyst comparison lists Starter at $49/month or $348/year, and Growth Accelerator at $79/month or $588/year. Sales Analytics is excluded from Starter and included in Growth. Standard plans offer a conditional seven-day money-back guarantee, not a free trial.
Check before choosing: supply product costs before assessing profitability. The Analytics Performance documentation describes viewing one connected account at a time; don’t assume multiple connections mean one combined account view. Catalyst and the enterprise Cobalt offering also have different scopes.
Explore Jungle Scout and merchant reviews on Capterra.
5. Assess SellerApp for research and advertising
Best fit: sellers whose main questions involve product opportunities, keywords, and advertising, with a limited free starting point.
What it reports: SellerApp combines research and advertising tools. Decide whether you’re investigating a market, reviewing a campaign, or looking for automation, because those needs may take you to different paid features.
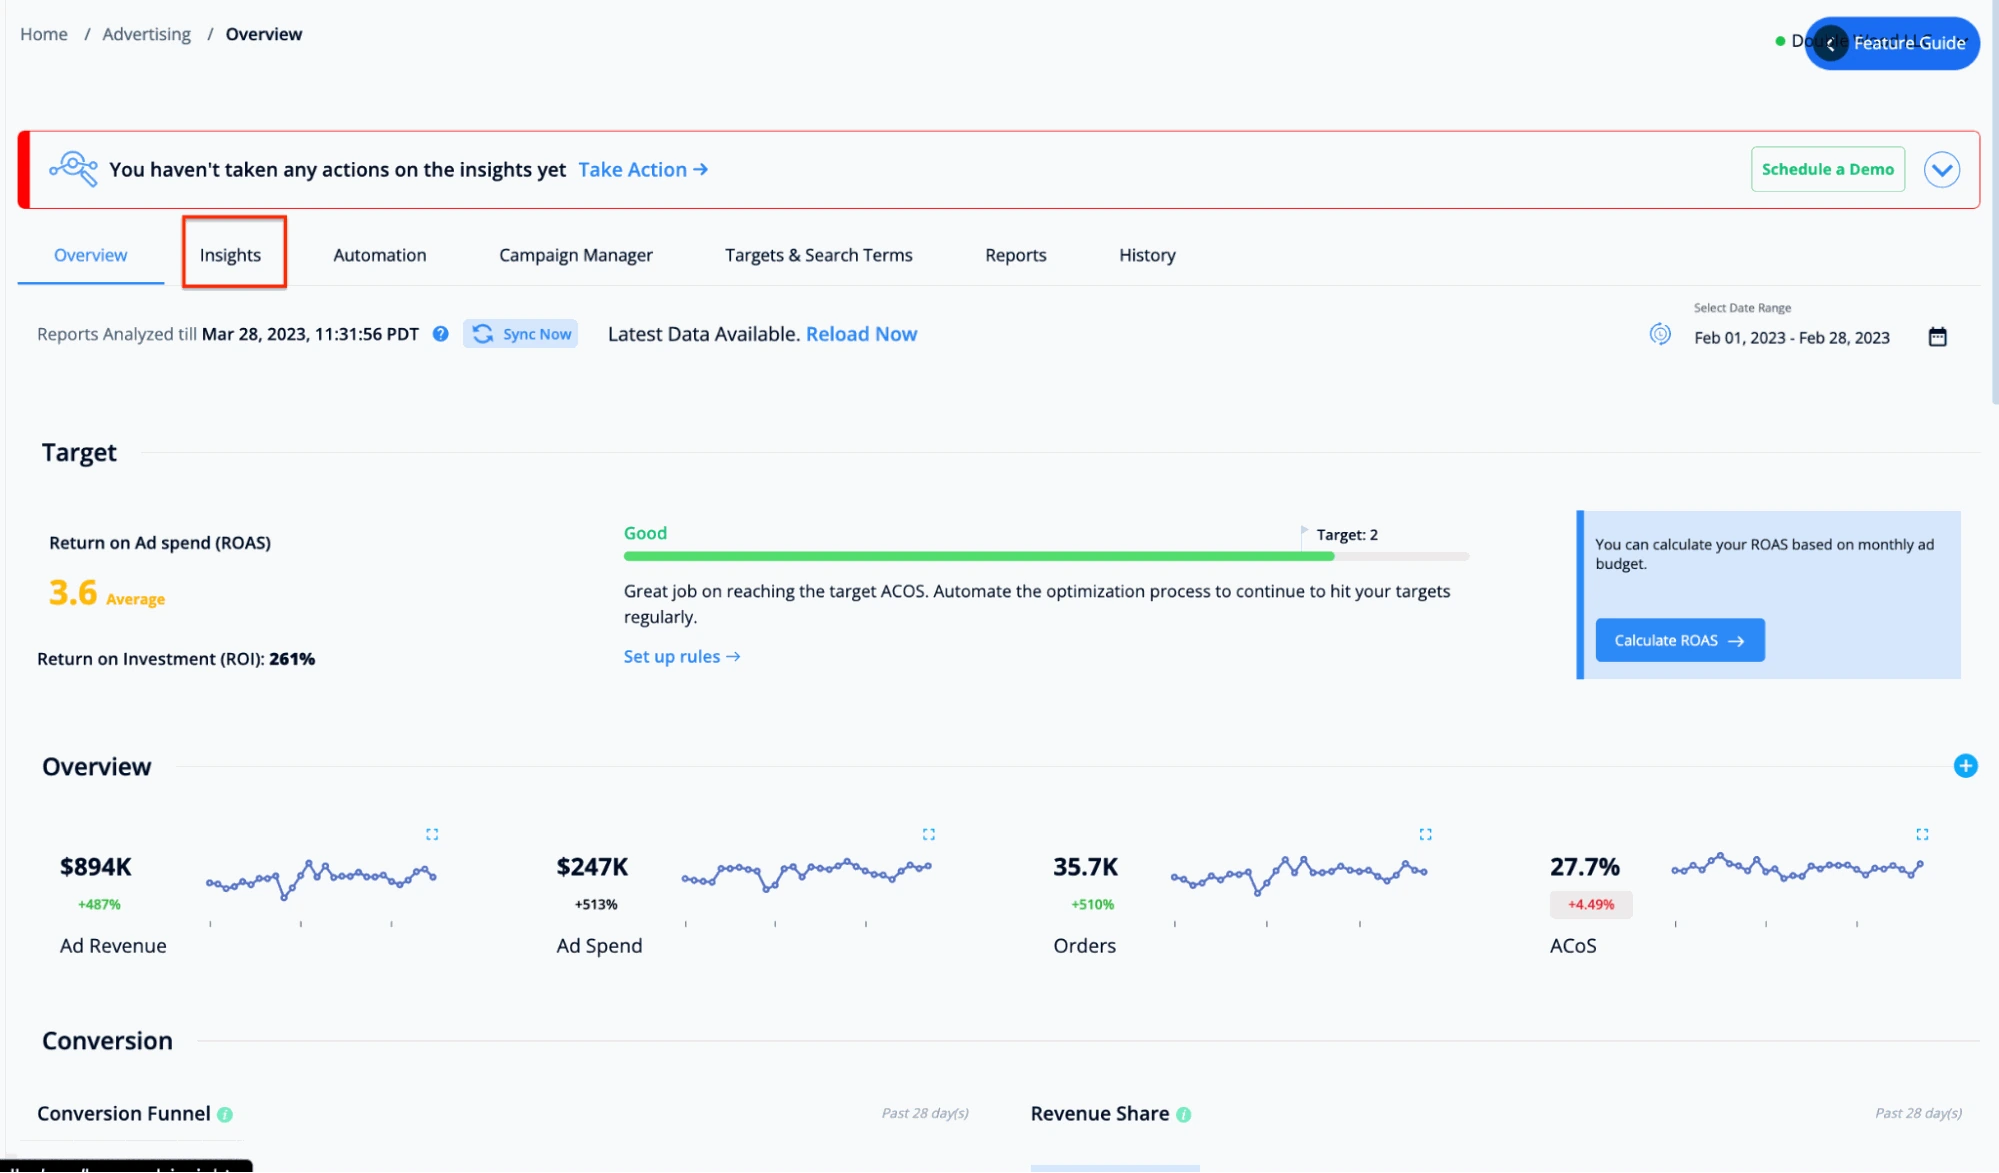
Cost and access: the self-serve pricing page lists a $0 Freemium plan and Pro from $99/month. Its advertised Smart price of $149/month applies to the first three months against a listed $250 regular price; requirements can affect the quote.
Check before choosing: Freemium is limited access, not every paid feature at no charge. Confirm your product coverage and advertising requirements against the plan; other official pages present conflicting paid-trial durations, so check the terms attached to your actual signup rather than assume a universal trial length.
Explore SellerApp and read Capterra feedback.
6. Evaluate DataHawk for marketplace data and BI
Best fit: brands and teams that need marketplace data feeding a wider reporting process. BI means business intelligence: combining data to answer business questions, often beyond a single dashboard.
What it reports: DataHawk focuses on marketplace data and analytics workflows. That scope can suit teams comparing product or market information with other business data; it also makes report design and data delivery part of the buying decision.
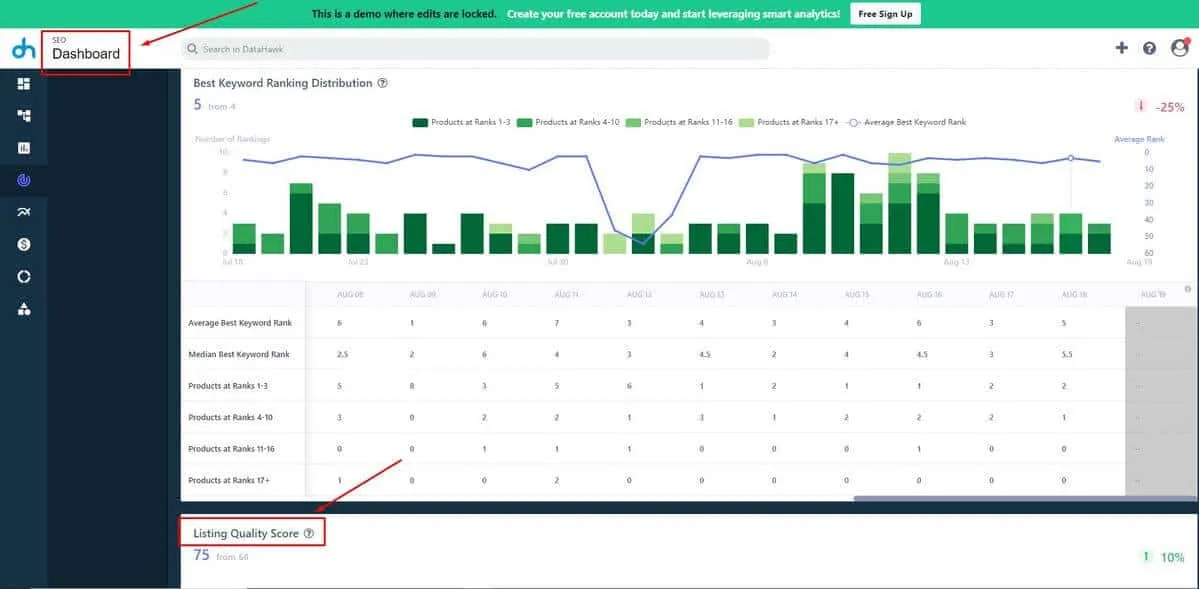
Cost and access: DataHawk pricing is custom and annual. Its Start for Free invitation doesn’t, by itself, establish a permanent free plan or a defined trial duration.
Check before choosing: ask which sources, history, exports, and update schedules the quote covers. The FAQ describes daily collection for tracked Amazon product identifiers (ASINs), so don’t assume every field is live. If you’re building broader ecommerce analytics, specify how the data reaches the reports your team uses.
Explore DataHawk or read Capterra reviews.
7. Consider Putler for connected-source reporting
Best fit: businesses that need to review revenue and customers across supported stores and payment sources, rather than manage Amazon keywords or advertising bids. Putler is our product.
What it reports: the data-source documentation supports an Amazon connection for sales, orders, refunds, and customer data. This is relevant when you manage multiple Amazon accounts or sell through other supported channels and want a broader business view.
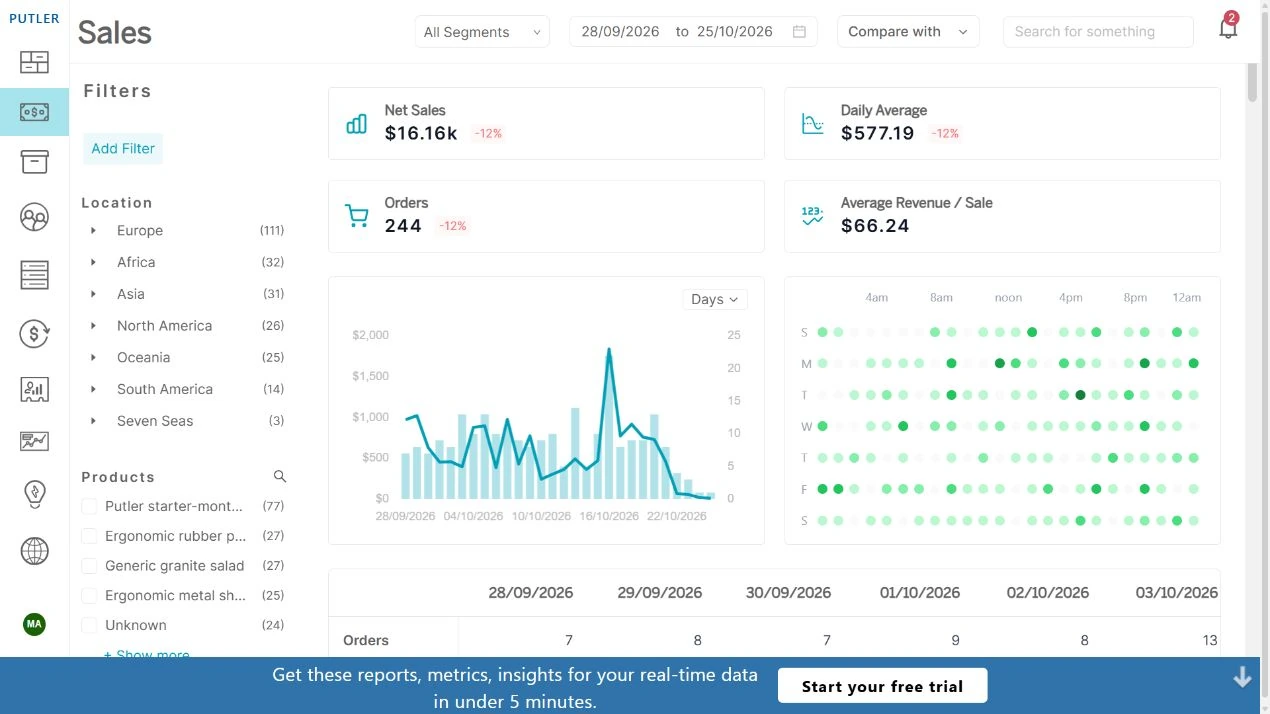
Cost and access: pricing starts at $20/month for up to $10K monthly revenue, with higher revenue tiers. The trial lasts 14 days and doesn’t require a credit card.
Check before choosing: don’t treat this as a complete Amazon fee-and-cost profit engine, keyword tracker, inventory controller, or PPC bidding system. Also check which customer fields your Amazon connection supplies before expecting complete buyer profiles or cross-store identity matching.
Read Putler reviews on Capterra alongside those reporting limits.
8. Use AMZ Tracker for rank and listing monitoring
Best fit: sellers whose immediate question is whether keyword positions or listings need attention, rather than how much profit remains after expenses.
What it reports: AMZ Tracker focuses on keyword-rank and listing monitoring, with alerts such as negative-review notifications. That makes it a narrower option than a financial reporting platform; use it for visibility questions rather than expect it to explain settlements or calculate a complete P&L.
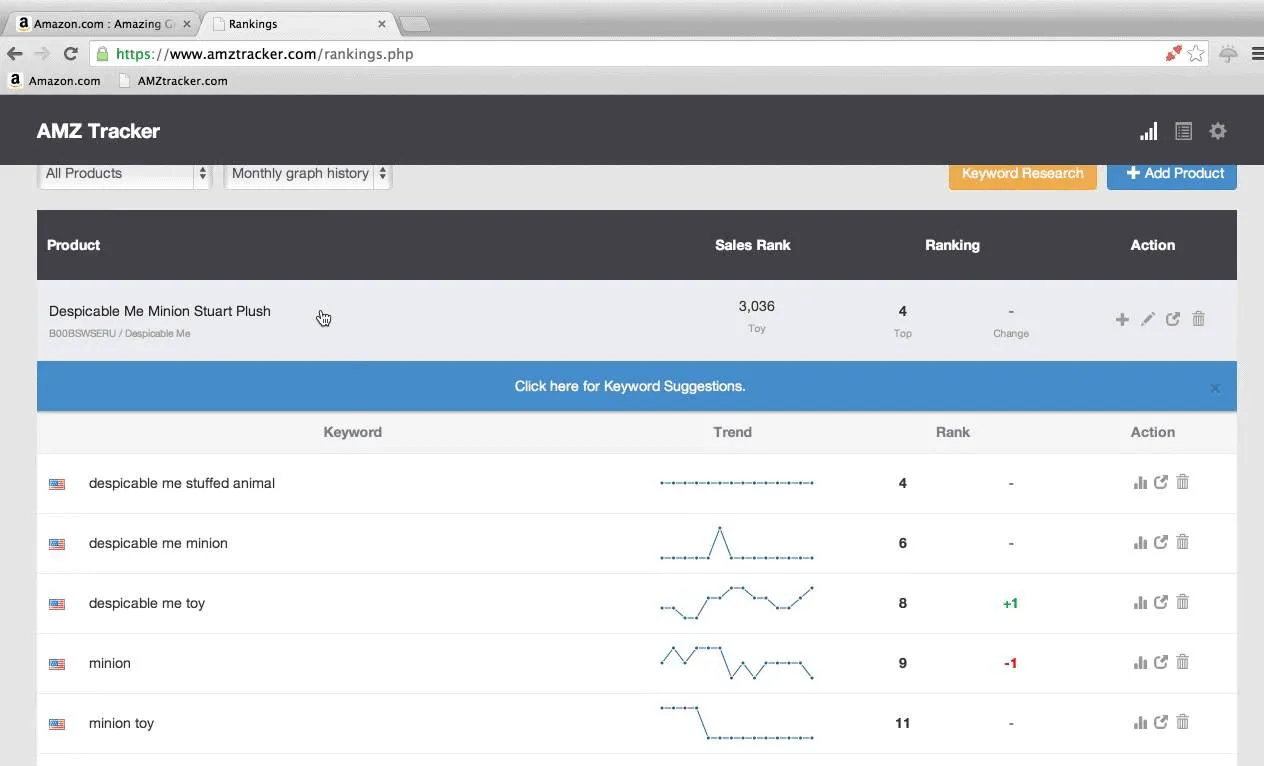
Cost and access: the official site advertises a seven-day trial. Check its current subscription options directly, because a reliable current numeric starting price wasn’t available in the public pricing material reviewed for this guide.
Check before choosing: confirm the keywords, products, history, and marketplace coverage included in your plan. If your real problem is profit after returns or advertising, begin with the native or dedicated profit-reporting options instead.
For another perspective, read AMZ Tracker reviews on Capterra.
What will your plan actually cost?
Estimate the bill using your own order volume, sales, account count, and required features. Two plans with similar headline prices can cover different workloads. The fictional examples below use published limits to show the arithmetic; they aren’t customer invoices, performance results, or a like-for-like ranking.
Suppose you process 3,200 Amazon orders per month. Sellerboard Standard’s 3,000-order allowance is too small; its $29/month Professional plan, covering 6,000 orders, becomes a candidate. You still need to check the other requirements before subscribing.
Now suppose you generate $500K in monthly Amazon sales and are comparing My Real Profit plans. Each includes $100K, leaving four additional $100K bands:
- Core: $47 + (4 × $10) = $87/month.
- Advanced: $147 + (4 × $10) = $187/month.
Those amounts exclude extra-account charges. The account allowances differ, so check them separately rather than carry the Core allowance into Advanced.
Write down the plan you qualify for, not just the lowest price you saw. During a trial, also note the time spent supplying costs and checking results; that work is part of the decision even when it doesn’t appear on the invoice.
How should you choose an Amazon analytics tool?
Write one reporting question, check whether your existing reports answer it, and trial only the missing capability. Then verify inputs and compare the same dates and definitions. This keeps your test focused on a useful decision instead of rewarding whichever dashboard has the most charts.
- Name the decision. For example, investigate product profit after costs, campaign performance, keyword position, or combined store revenue. These need different data, so define success before comparing subscriptions.
- Check native coverage. Inspect the Amazon reports available to your account and note the exact gap. You may need a better process or supplied cost data before you need another platform.
- Specify your workload. List marketplaces, accounts, monthly orders, sales, required users, and reporting history. This helps you compare eligible plans and spot charges that a starting price leaves out.
- Test the inputs. Check product costs, returns, ads, fees, and reporting dates relevant to the job. If you need to export Amazon orders for validation, use the same period in each report so you can investigate differences fairly.
- Trace a small sample. Follow a sale, a refund, and an adjustment through the relevant records. Timing, currency, and included costs can explain differences; a mismatch alone doesn’t prove that either tool is wrong.
- Keep only useful overlap. You can combine a research tool with a reporting tool, but each should answer a distinct question. Before renewal, check whether the second subscription changes a decision or merely repeats a chart.
If you use sales forecasting, keep the projection separate from completed sales and profit. A forecast is a planning estimate, not money already earned.
For businesses weighing Amazon against Shopify, decide whether the question concerns marketplace performance or the whole business before choosing the reporting setup. Once you have a reliable view, use it to prioritize ways to increase Amazon sales.
Get answers to common buying questions
Does Amazon have its own analytics tools?
Yes. Amazon provides sales and traffic reporting, Brand Analytics for eligible brands, and Profit Analytics described in its seller documentation. These have different purposes and access conditions. Inspect the reports available to your account before buying another subscription for the same job.
Are any Amazon analytics tools free?
SellerApp advertises a limited permanent Freemium plan, and Helium 10 references limited free access. Trials end; money-back guarantees require a payment and have conditions. Native Amazon reports also have account and eligibility requirements, so avoid treating every option as universally free.
Which tools help calculate profit after fees and ads?
Start by comparing Amazon Profit Analytics, Sellerboard, and My Real Profit against your required costs and reports. Eligible suite features may also help. Supply the relevant costs and check exclusions, adjustments, and timing; revenue minus a few visible expenses isn’t necessarily your complete business profit.
Does the cheapest Jungle Scout plan include Sales Analytics?
The Catalyst plan comparison checked for this guide excludes Sales Analytics from Starter and includes it in Growth Accelerator. Compare the price of the plan containing the feature you need, rather than use Starter’s research-plan price as the cost of connected sales reporting.
How do you choose analytics for multiple stores or accounts?
Check both connection allowances and report behavior. A tool may connect several accounts but show one at a time, while another combines supported sources. Verify volume charges and customer-data availability too; multiple connections don’t guarantee one consolidated report or complete cross-store buyer profiles.
Test the report you need before subscribing
Bring one unanswered question and a small set of records to the trial or demonstration. Ask to see that question answered with the plan, account coverage, and inputs you’ll actually use. That’s a stronger reason to pay than a long feature list.