

Churn rate is the percentage of customers, or revenue, a business loses over a set period. It looks like one simple number, but it feeds CLTV, revenue forecasts, and how much a business can afford to spend on acquisition.
This article explains the churn rate meaning, gives the churn rate formula for each type with worked examples, and shows how to read benchmarks without comparing a monthly figure to an annual one. It also covers what to do once you calculate churn rate for your own business.
What is churn rate?
Churn rate is the share of customers, or recurring revenue, that leaves during a set period, usually a month or a year. Customer churn, or customer attrition, counts people. Revenue churn counts money.
The churn rate meaning comes down to one question: how much did you lose while you were busy adding new customers? A leaky bucket is the usual metaphor, and it earns its place. A store that adds 100 customers a month and loses 100 has not grown at all.
The number matters for three reasons:
- Acquisition costs more than retention: Winning a new customer is 5x-25x more expensive than keeping an existing one, according to HBR.
- Retention moves profit: HBR also cites Bain research showing that a 5% increase in retention lifts profits by 25% to 95%.
- Acquisition keeps getting pricier: eCommerce customer acquisition costs rose about 60% over five years through 2024, according to SimplicityDX data that Invesp’s acquisition vs retention roundup cites.
Churn also shapes CLTV and customer retention rate. Together, these numbers drive revenue forecasts and growth plans.
Churn rate formula: how to calculate churn rate
Churn rate comes in several types, and each type has its own formula. The steps to calculate churn rate stay the same for all of them: pick a period, count what you started with, count what you lost, and divide.
Customer churn rate
Customer churn rate, or user churn rate, is the percentage of paying customers who cancel during a period.
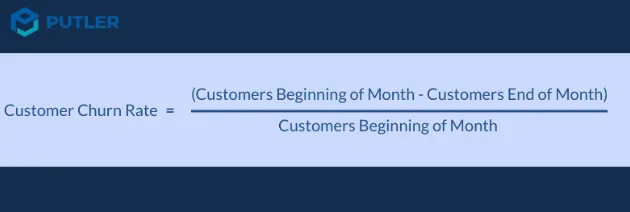
A 10% monthly customer churn rate means 10% of the paying customers you had at the start of the month have cancelled by its end. Customers who joined mid-period stay out of the formula.
Worked example: A store starts the month with 100 paying customers, and 5 cancel. The rate is (5 ÷ 100) × 100 = 5%.
A 5% monthly rate looks small, but it compounds. Over a year, it removes about 46% of the original customers, as the conversions below show.
Revenue churn rate
Revenue churn rate is the percentage of recurring revenue lost to cancellations and downgrades during a period.
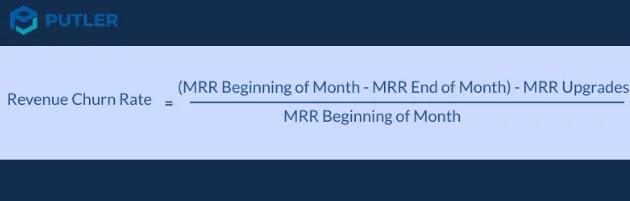
Worked example: A store starts the month with 100 customers paying $100 each, so MRR is $10,000. During the month, 5 customers downgrade to an $80 plan and 5 cancel.
- Downgrade loss: 5 customers × $20 = $100
- Cancellation loss: 5 customers × $100 = $500
- Total MRR lost: $600
The result is ($600 ÷ $10,000) × 100 = 6%.
The same month shows 5% customer churn and 6% revenue churn. The gap exists because the downgrades cost revenue without costing a single customer.
Monthly vs annual churn rate
Monthly churn uses the customers at the start of the month. Annual churn uses the customers at the start of the year. The formula stays the same, and only the period changes.
Annual example: A company starts the year with 52,000 customers and loses 3,000 of them. Its annual customer churn is (3,000 ÷ 52,000) × 100 = 5.77%. It also starts the year with $501,000 in recurring revenue and loses $44,408, so its annual revenue churn is 8.86%.
Revenue churn runs higher than customer churn here. That means the customers who left, or the plans that dropped, carried more revenue than the average customer. A pricing or plan review is the place to start.
Do not multiply a monthly rate by 12 to get the annual rate. Churn compounds, so the conversion looks like this:
- 1% monthly: about 11.4% annual
- 2% monthly: about 21.5% annual
- 3% monthly: about 30.6% annual
- 5% monthly: about 46.0% annual
Probability churn rate
This version looks forward instead of back. It estimates how likely a customer is to churn in the next period, using signals such as falling activity, failed payments, or support complaints.
The standard rate tells you what already happened. A probability score tells you who to contact first.
Churn rate vs retention rate
Retention rate is the mirror image of churn rate. For the same period and the same customer group, the two add up to 100%.
A 5% churn rate means 95% retention.
Voluntary vs involuntary churn
Voluntary and involuntary churn have different causes, so they need different fixes.
- Voluntary churn: The customer decides to cancel. Common causes are dissatisfaction with the product, pricing concerns, or a switch to a competitor. This type points to product or experience problems.
- Involuntary churn: The customer loses access without choosing to leave. A failed payment, an expired card, or a billing error is usually the cause, and the customer never intended to cancel.
Recurly’s July 2026 benchmarks put SaaS churn at 3.22%, split into 2.16% voluntary and 1.06% involuntary. In eCommerce, churn runs higher at 4.25%, with 2.87% voluntary and 1.38% involuntary. Recurly reports these as annual rates. In both industries, roughly a third of churn is involuntary.
That third is the cheapest churn to win back. Vitally’s summary of the 2025 Recurly Churn Report says fixing involuntary churn can lift revenue by 8.6% in year one.
The fixes are mechanical: automatic card updaters, retry logic for failed charges, and dunning emails. Those run in the billing tool or the payment gateway. Putler reports the churn numbers, but it does not process payments, so retries and dunning emails stay with the billing tool.
Churn rate benchmarks by industry and company size
A good churn rate depends on the billing period, the company size, and the business model. Compare a monthly figure to monthly benchmarks and an annual figure to annual ones, or the comparison means nothing.
- SaaS (Recurly, annual): Recurly’s July 2026 data gives a median annual churn rate of 3.22% for SaaS, with top-quartile companies at 1.78% or below.
- eCommerce (Recurly, annual): The same data puts eCommerce at 4.25%.
- By company size (UserMotion): In a survey of about 1,000 B2B SaaS companies with MRR between $100K and $1M, small businesses averaged 7.5%, mid-sized companies 5.2%, and large organizations 3.8%.
UserMotion does not state whether those figures are monthly or annual, or where the size cutoffs sit, so treat them as directional. The two sources also draw on different samples, so their numbers will not line up.
UserMotion’s numbers do show the usual pattern: larger companies churn less, benefiting from stronger vendor relationships and higher switching costs. Early-stage businesses should expect a higher rate and work to bring it down over time.
Net negative churn and why it matters
Net negative churn happens when revenue gained from existing customers through upgrades, expansions, and add-ons exceeds revenue lost to cancellations and downgrades. The customer base grows in value even as some customers leave.
ChartMogul’s version also counts reactivation MRR on the gain side. If the result falls below zero, the business has net negative churn.
Worked example: Starting MRR is $10,000. Cancellations remove $500 and downgrades remove $100. Upgrades and add-ons add $800. Net MRR churn is ($600 − $800) ÷ $10,000 × 100 = −2%, which is net negative churn.
According to ChartMogul’s SaaS Benchmarks Report (2023 edition), 40% of SaaS businesses with ARR between $15M and $30M have negative churn. The way there is a pricing model with expansion built in, such as usage-based tiers, seat-based pricing, or add-ons that grow with the customer.
How churn rate affects other SaaS metrics
Churn rate sits underneath most subscription metrics, so a change in churn moves the others.
- Monthly recurring revenue (MRR): Every cancellation and downgrade subtracts from MRR, so churn sets the ceiling on how fast MRR can grow.
- Customer lifetime value (CLTV): Higher churn shortens customer lifetime and cuts CLTV. A simple estimate divides average revenue per customer by the churn rate, using the same period for both. A $100 monthly plan with 5% monthly churn gives $2,000 and an average lifetime of 20 months (1 ÷ 0.05).
- Customer acquisition cost (CAC): Churn does not change what one customer costs to acquire. It raises how many customers the business must acquire just to stay flat, which stretches the payback on every acquisition dollar.
- Net negative MRR churn: Lower churn makes negative net MRR churn easier to reach, because expansion has less loss to cover.
The revenue-only CLTV estimate ignores gross margin. Multiply average revenue by gross margin for a profit-based figure.
Churn rate for eCommerce and subscription stores
Most churn rate guides assume a SaaS product on a single monthly plan. eCommerce and subscription stores rarely look like that.
- Mixed billing periods: Monthly, quarterly, and annual plans sit in the same customer base. Annual customers can only churn at renewal, so a single monthly figure distorts them.
- Plan changes: Upgrades, downgrades, and reactivations move revenue without changing the customer count.
- Free users: Free trials and free plans pad the customer count with people who never paid. Count paying customers only.
- Several gateways: A store that sells through Stripe, PayPal, and WooCommerce has subscription data in three places, and each gateway reports only its own cancellations.
- One-time buyers: Without a subscription, no customer cancels. Churn shows up as silence instead.
That last case is non-subscription churn. A customer counts as churned after a stretch of inactivity, and the store sets that window from its own repurchase cycle. Subscription churn ends with a cancellation. Non-subscription churn ends with a customer who stops buying.
Churn analysis turns the rate into a decision. It splits the number by cohort, plan, and acquisition source to show where the loss concentrates. Putler’s guide to churn analysis covers all three churn types, plus cohorts and the metrics worth tracking.
Steps to take after you calculate churn rate
A high churn rate is a signal, not a verdict. Even strong businesses lose customers, and each step below lowers the number.
- Find the reason: Read exit surveys, cancellation reasons, and support tickets. Look for patterns by plan, acquisition source, and signup month. One clear pattern beats a hundred scattered comments.
- Fix onboarding: Check whether cancellations cluster in the first weeks. If they do, shorten the path to the first useful result with clear guidance, personal help, and early wins.
- Keep customers engaged: Reach out before a customer reaches for the cancel button. Regular check-ins, useful tips, and product updates give customers reasons to stay.
- Act on feedback: Customer feedback shows where the product falls short. Fix the recurring complaints first, then tell customers you did.
- Reward loyalty: Long-term customers respond to special features, faster support, or a thank-you that costs little.
- Learn from cancellations: Ask every departing customer why. The answers improve the product and sometimes win the customer back.
- Recover failed payments: Set up card updaters, retry logic, and dunning emails in the billing tool to stop involuntary churn.
Get an accurate churn rate with Putler
Putler calculates user churn rate and revenue churn rate from the payment gateways and eCommerce platforms you connect, so nobody rebuilds the formula in a spreadsheet every month. Its subscription metrics cover Stripe, PayPal, WooCommerce, and Authorize.Net data, among other sources.
Putler measures user churn rate over the last 30 days: customers who cancelled in that window, divided by the active paying customers 30 days ago. Revenue churn uses the same window and counts MRR lost to downgrades and cancellations. Putler also removes duplicate transactions that appear across connected platforms, so a payment does not count twice.
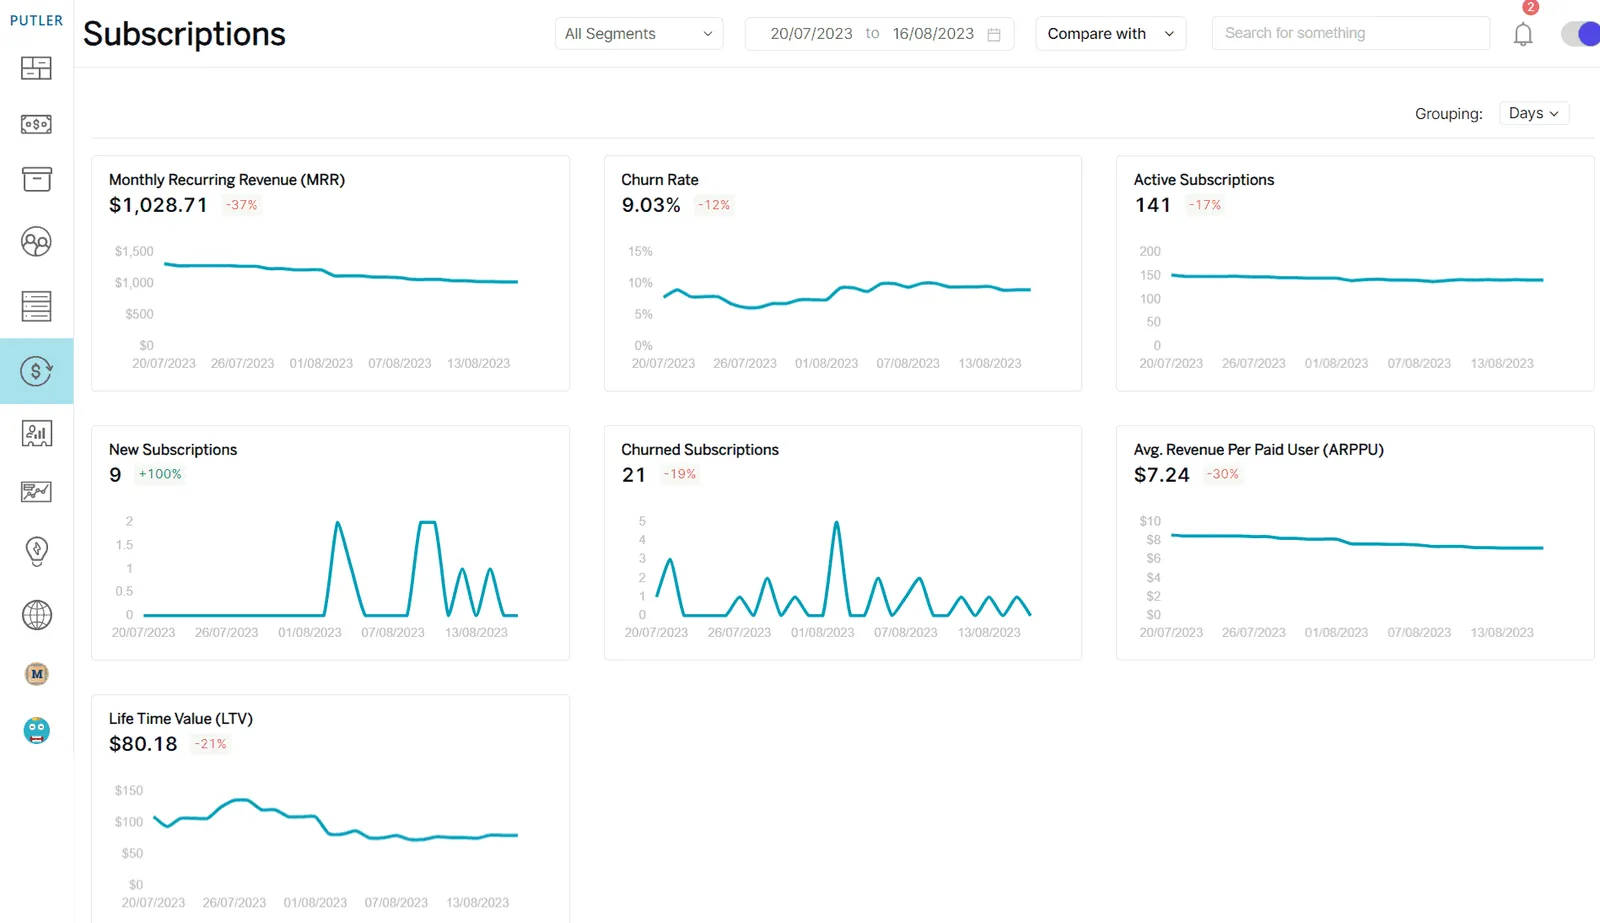
The limits are plain. Subscription metrics cover the platforms Putler supports for subscription reporting, so data from a source outside that list does not feed the churn numbers. Putler does not process payments, so retries and dunning emails stay with the billing tool.
Along with subscription metrics, you also get:
and a lot more…
Thousands of businesses use Putler to track sales, customers, and churn.
Conclusion: what to do about your churn rate
Churn will always exist. The goal is to understand it, calculate it correctly, and keep it low enough that growth outpaces the losses.
Pick one churn rate definition, track it monthly, and act on the signals before they turn into cancellations. To watch customer behavior and keep a check on your churn rate, use Putler.
FAQs
What is a good churn rate?
It depends on billing period, company size, and business model. Recurly’s July 2026 data puts median SaaS churn at 3.22% (annual) and eCommerce at 4.25%. In a UserMotion survey, small businesses average 7.5% churn, mid-sized companies average 5.2%, and large organizations average 3.8%, though the source does not state the period. Compare monthly figures with monthly benchmarks and annual figures with annual ones.
What is negative churn?
Negative churn happens when revenue gained from existing customers through upgrades, expansions, and add-ons exceeds revenue lost to cancellations and downgrades. Revenue from new customers does not count toward it.
Does churn rate impact retention?
Yes. Retention rate is 100% minus churn for the same period and customer group, so 5% churn equals 95% retention. Every customer the business fails to retain counts as churn.
How do you calculate CLV from churn rate?
Divide average revenue per customer by the churn rate, using the same period for both: CLV = average revenue per customer ÷ churn rate. A $100 monthly plan with 5% monthly churn gives $2,000. Multiply the average revenue by gross margin first for a profit-based figure.
How do you reduce churn rate?
Split churn into voluntary and involuntary first. Fix failed payments with card updaters, retry logic, and dunning emails. For voluntary churn, find the reasons through exit surveys and cohort analysis, then improve onboarding, engagement, and the parts of the product customers complain about most.
What does a high churn rate mean?
A high churn rate means customers leave faster than the business replaces them. The cause can sit in the product, pricing, onboarding, support, or payment failures. Check whether the churn is voluntary or involuntary first, because the fixes differ.