

Ecommerce reporting tools help you turn store, payment, customer, product, marketing, and subscription data into decisions. The right tool depends less on the number of dashboards it offers and more on where your reporting problem begins.
A single Shopify store may already have enough native reporting, while a paid-acquisition team may need attribution. A multi-store business may need clean, consolidated revenue. A data team may want a warehouse and a flexible BI layer.
Those are different jobs. Treating every product below as a direct substitute would make the comparison less useful.
Putler publishes this guide and appears in the list. Its inclusion is disclosed so you can judge the recommendation alongside the evidence and the alternatives.
Compare the best ecommerce reporting tools at a glance
| Tool | Best fit | Starting price | Main job |
|---|---|---|---|
| Putler | Multi-source commerce reporting | $20/month | Consolidate commerce data |
| Shopify Analytics | Shopify-native reporting | Included with Shopify | Analyze one Shopify business |
| Triple Whale | Attribution and DTC measurement | Free plan | Measure marketing performance |
| Polar Analytics | Growing brands needing BI | $750/month | Managed ecommerce data stack |
| Daasity | Complex omnichannel brands | $1,499/month | Commerce data infrastructure |
| Glew | Broad multichannel analytics | Contact vendor | Ready-made commerce BI |
| Peel Insights | Retention and cohort analysis | $449/month annually | Analyze LTV and repeat buying |
| Supermetrics | Moving data into reports | $55/month | Automate data pipelines |
| Google Analytics 4 | Shopper and website behavior | Free | Measure onsite journeys |
| Data Studio (formerly Looker Studio) | Custom dashboards | Free | Visualize connected data |
Prices were checked on September 25, 2026. Vendor pricing can change, and usage tiers may affect the final cost.
How were these ecommerce reporting tools selected?
This comparison of ecommerce reporting tools focuses on the job each product performs. It considers current product documentation, integrations, setup model, reporting flexibility, customer and product analysis, marketing measurement, scalability, and published pricing.
The tools were compared using public documentation and pricing pages, not hands-on tests. Feature and price statements link to official vendor documentation where possible.
The list deliberately mixes native reporting, specialized analytics, unified commerce reporting, data integration, and BI. That makes it useful for choosing a category before choosing a brand. The numbers help you navigate the list and are not a ranking.
1. Putler: best for unified multi-source ecommerce reporting
Putler fits businesses whose main problem is fragmented commerce data. It connects supported stores, payment gateways, marketplaces, and analytics sources, then consolidates and cleans the records before reporting on them.
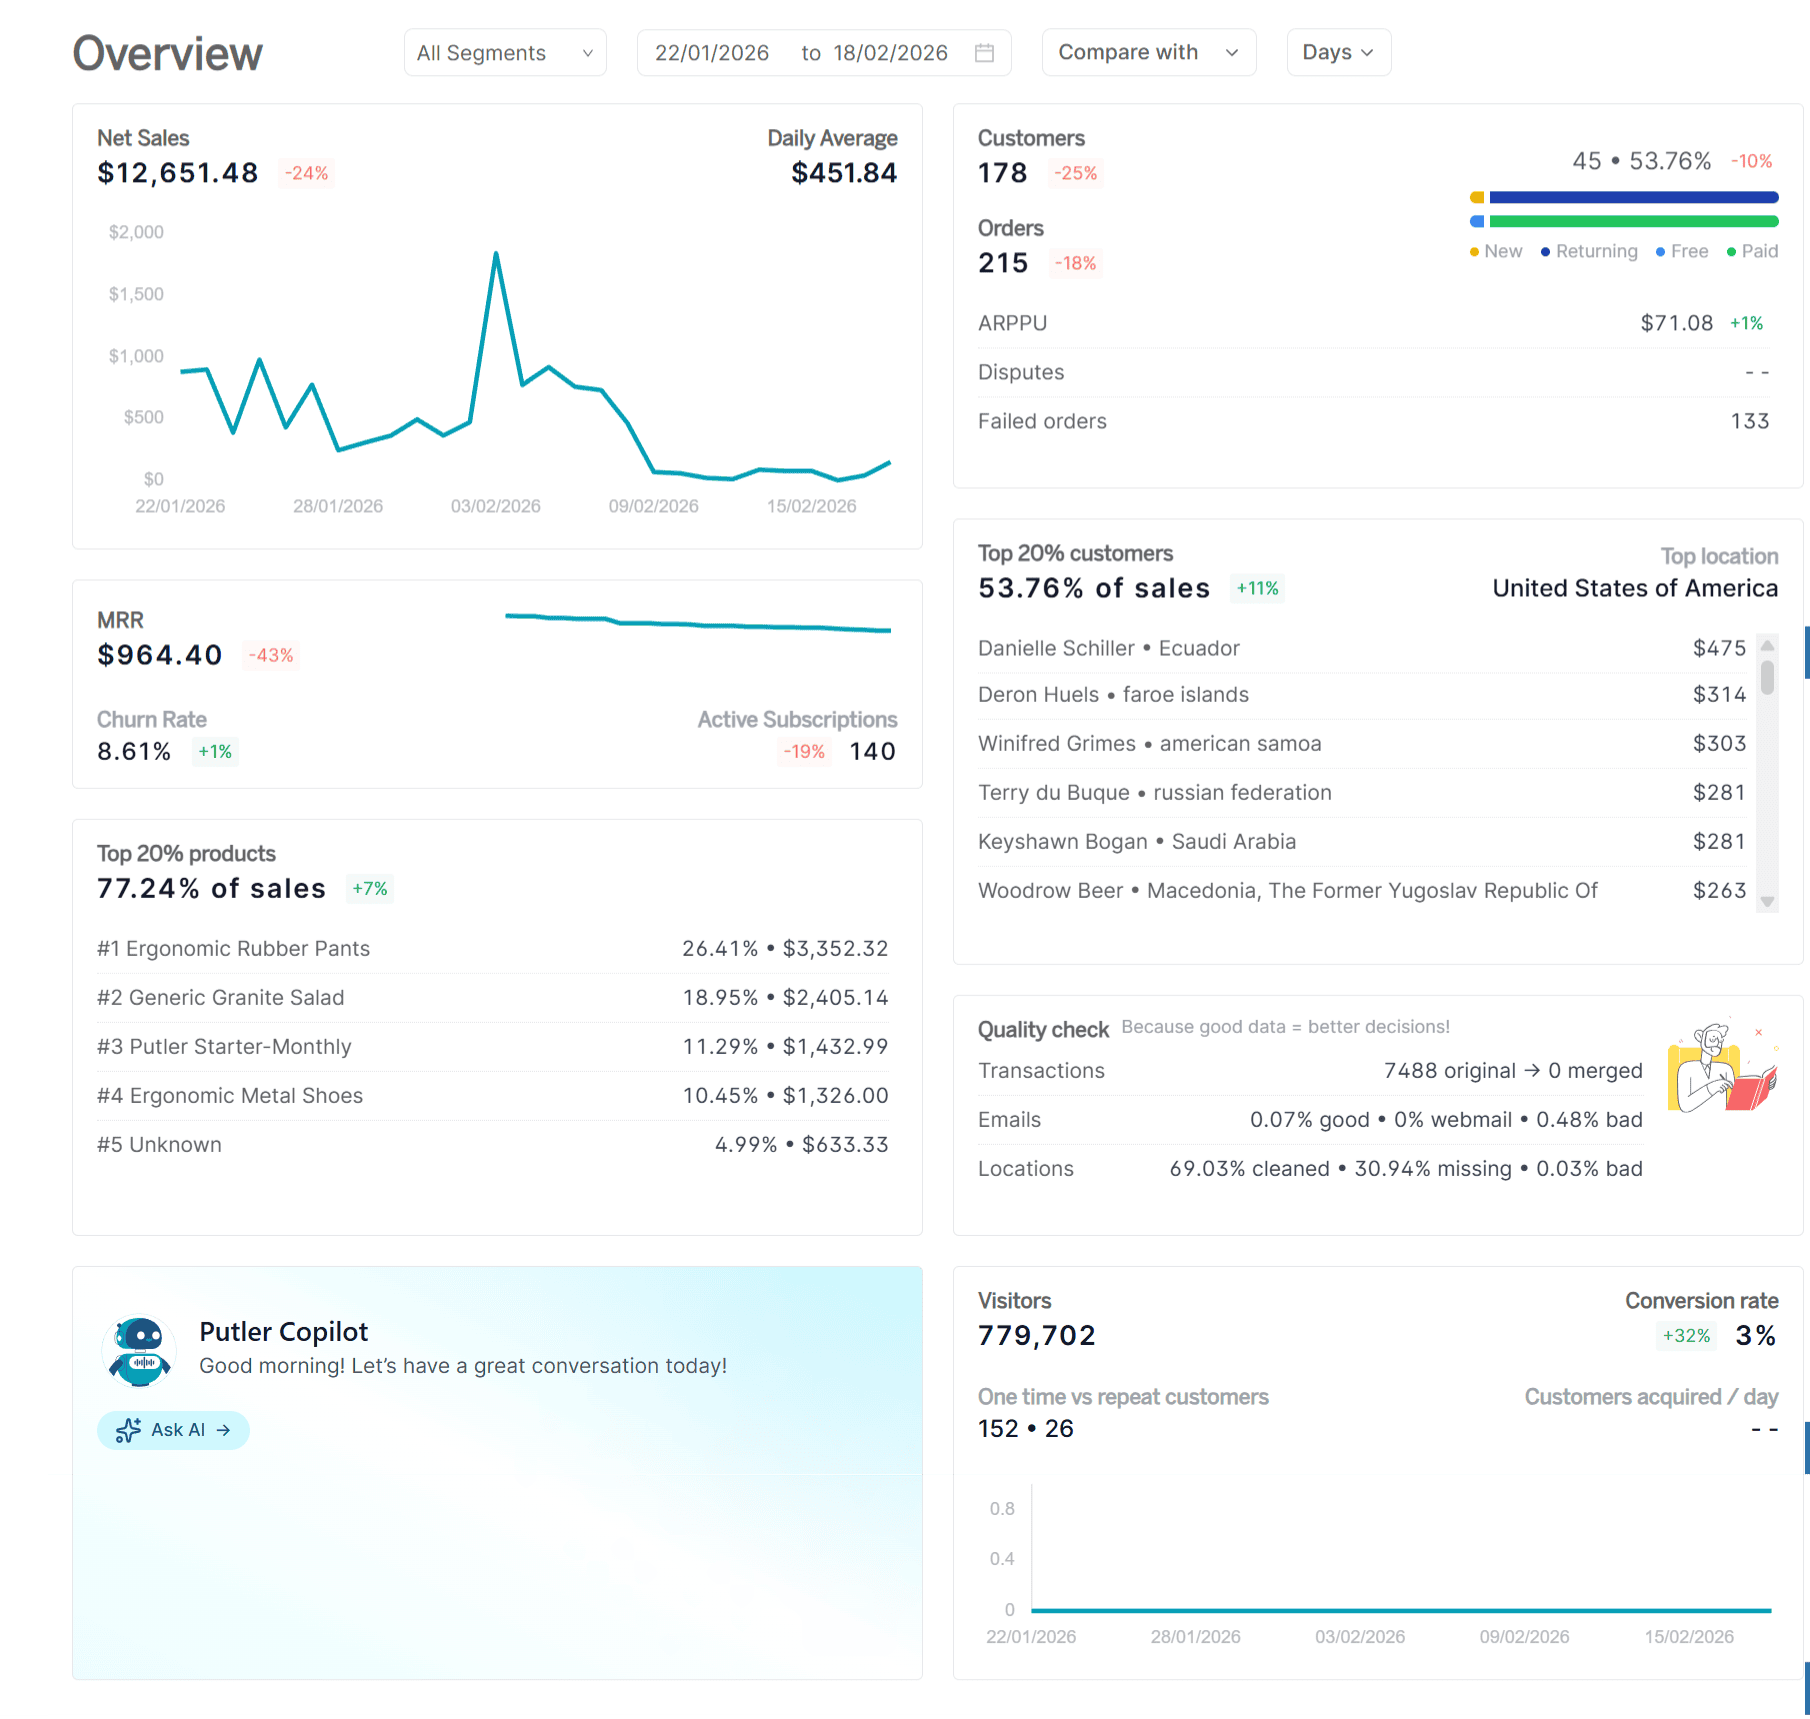
Its official product pages currently describe 17+ integrations and 200+ ready metrics. Reports cover sales, refunds, products, customers, subscriptions, and visitors. Putler also supports customer profiles, RFM segments, multi-currency conversion, sales heatmaps, forecasting, frequently bought together analysis, and 80/20 reporting.
That scope matters when the same transaction can appear in both a store and its payment gateway. A reporting layer that simply stacks both sources can double-count revenue. Putler’s value is the cleanup and consolidation that happens before the dashboard.
The current Putler pricing page starts at $20 per month for up to $10,000 in monthly revenue. Pricing scales with revenue, and the 14-day trial does not require a credit card.
Best for: Multi-store sellers, businesses using several payment gateways, hybrid ecommerce and subscription businesses, and small teams without a dedicated analyst.
Keep in mind: Putler is not an open-ended enterprise BI platform. Inventory planning and advanced first-party advertising attribution are not its central jobs.
2. Shopify Analytics: best for Shopify-native reporting
A Shopify-first business should check its native reports before paying for another platform. Shopify Analytics covers sales, customers, products, traffic, transactions, marketing, inventory, and other store activity without another data connection.
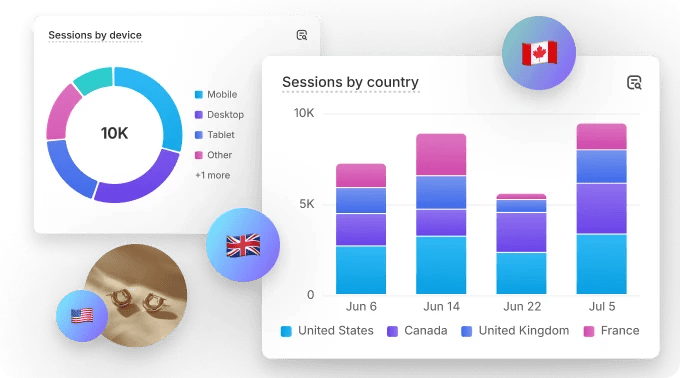
The current Shopify Analytics overview includes customizable metric cards and automatically generated insights. Shopify says Analytics page metrics update within about one minute. Merchants can compare date ranges, change dashboard layouts, and open detailed reports from each metric card.
That native connection is the advantage. Orders, products, channels, and store activity already share Shopify’s data model.
Best for: Businesses where most sales and operational data live inside one Shopify setup.
Keep in mind: Available reports can depend on the Shopify plan. Native reporting also becomes a partial view when important revenue, payment, marketplace, subscription, or customer data lives outside Shopify.
3. Triple Whale: best for attribution and DTC measurement
Triple Whale suits DTC brands that need to understand which marketing activity drives sales. Its free and paid products now extend beyond attribution, but measurement remains a clear differentiator.
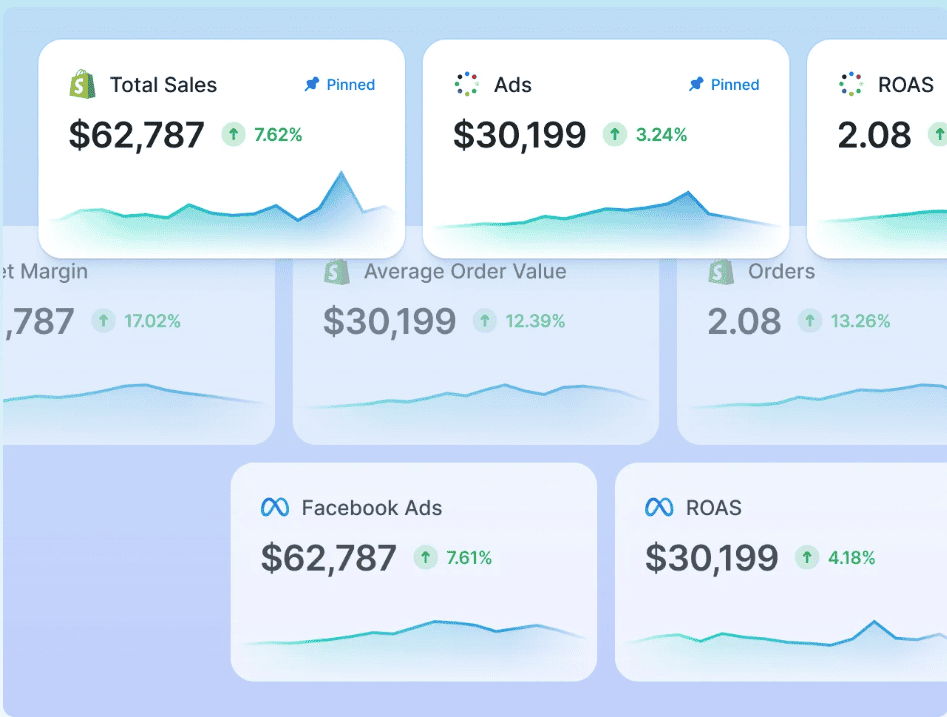
The current Triple Whale plan comparison includes a free plan with business reporting, Triple Pixel tracking, first- and last-click attribution, and Moby AI. Foundation adds multi-touch attribution, no-code dashboards, custom metrics, a SQL editor, and customer segments. Automate adds scheduled automations and creative tools, while Enterprise adds incrementality testing, marketing mix modeling, multi-brand reporting, and SSO.
Paid pricing depends on annual GMV and package choice, so a single public starting price would be misleading.
Best for: DTC brands with meaningful paid-media spend and teams that need attribution, measurement, and marketing operations in one system.
Keep in mind: If the main problem is consolidating transactions, customers, products, and subscriptions across sources, Triple Whale may provide a broader marketing stack than the business needs.
4. Polar Analytics: best for growing ecommerce brands needing BI
Polar Analytics sits between ready-made ecommerce reporting and a custom warehouse-plus-BI project. It is aimed at brands that need flexible analysis but do not want to build every data layer internally.
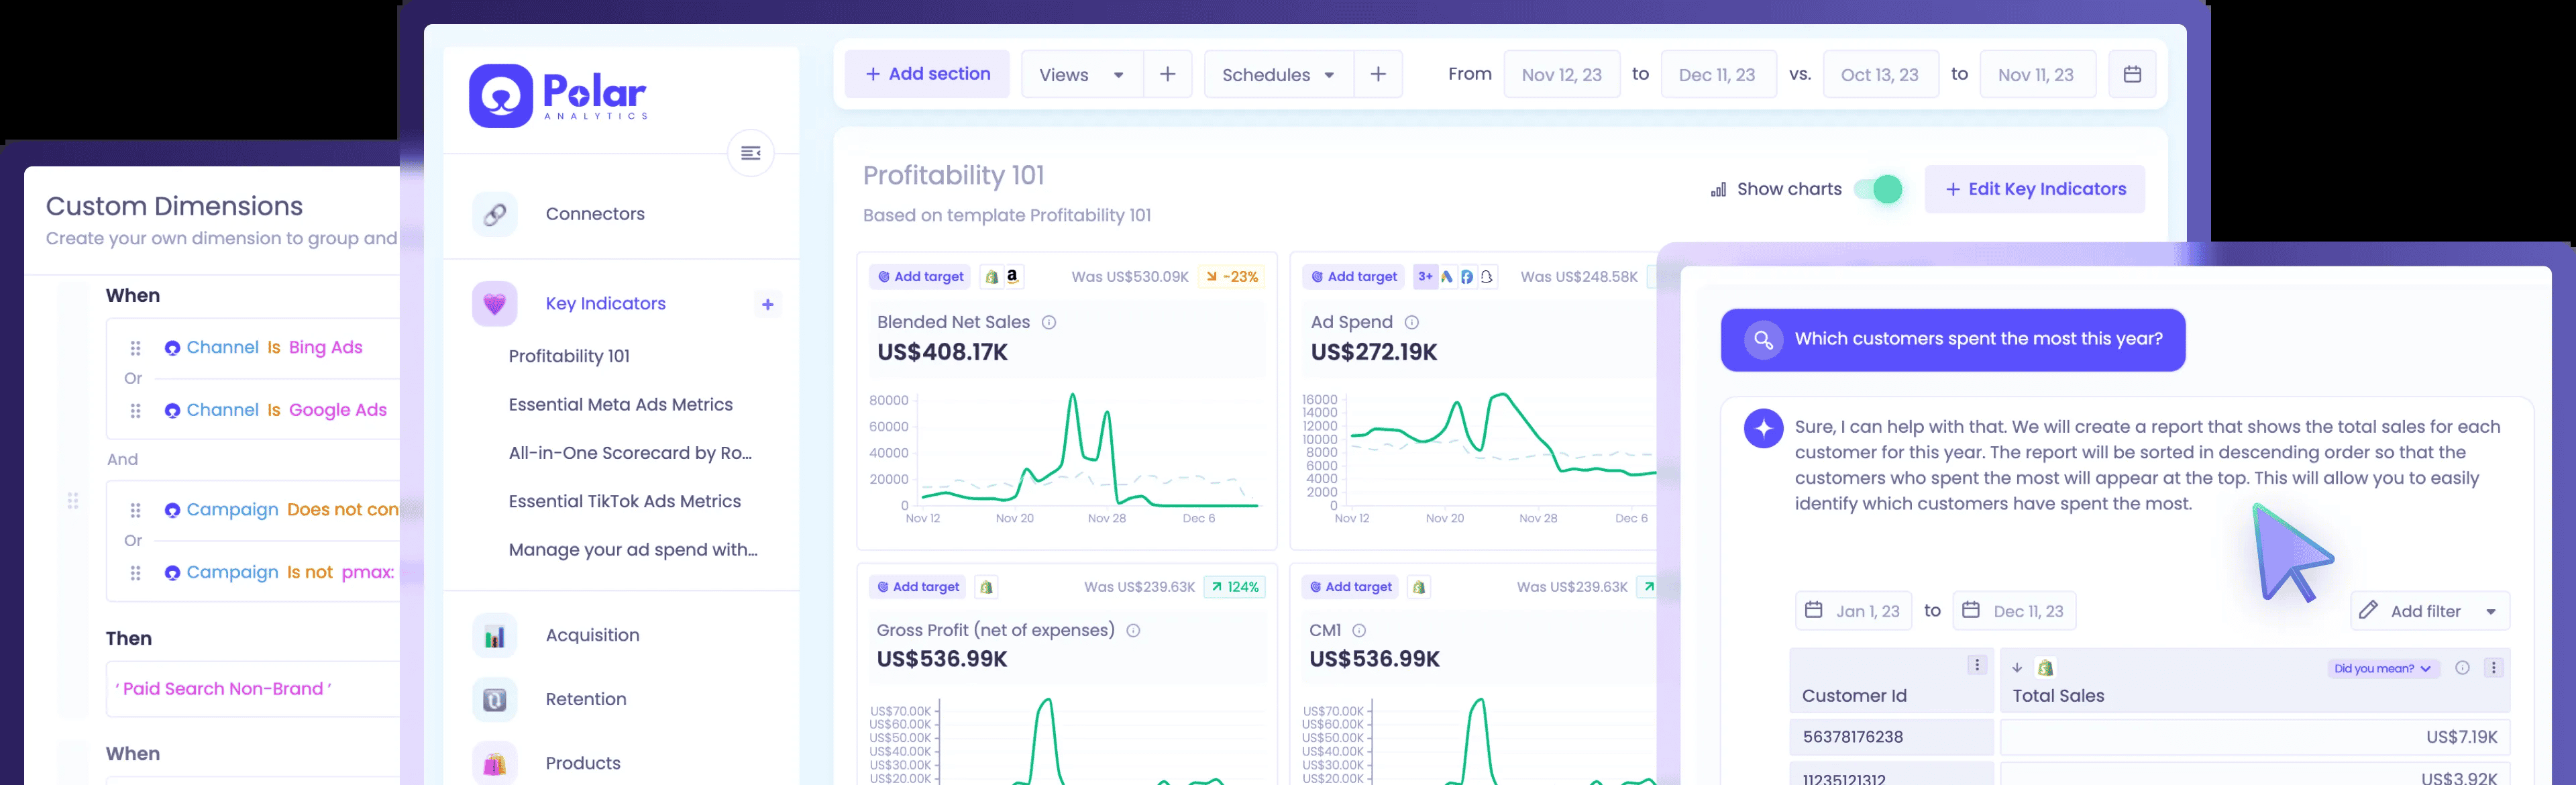
All current Polar Analytics plans include a dedicated Snowflake database, an ecommerce semantic layer, a first-party pixel, unlimited users, and unlimited historical data. Its business intelligence product adds custom reporting, dashboards, alerts, attribution, and Ask Polar AI.
Polar’s published terms describe a semantic layer with 400+ prebuilt ecommerce metrics. Core pricing starts at $750 per month for brands with less than $5 million in annual impacted GMV and scales by GMV.
Best for: Growing and mid-market ecommerce brands that have outgrown simple dashboards and want a managed data foundation.
Keep in mind: The setup and price target a different buyer from a small store looking for a $20 to $100 reporting tool.
5. Daasity: best for complex omnichannel commerce data
Daasity is designed for companies selling across combinations of DTC, Amazon, retail, marketplaces, and wholesale. It brings sales, inventory, marketing, and margin data into a commerce-focused data foundation.
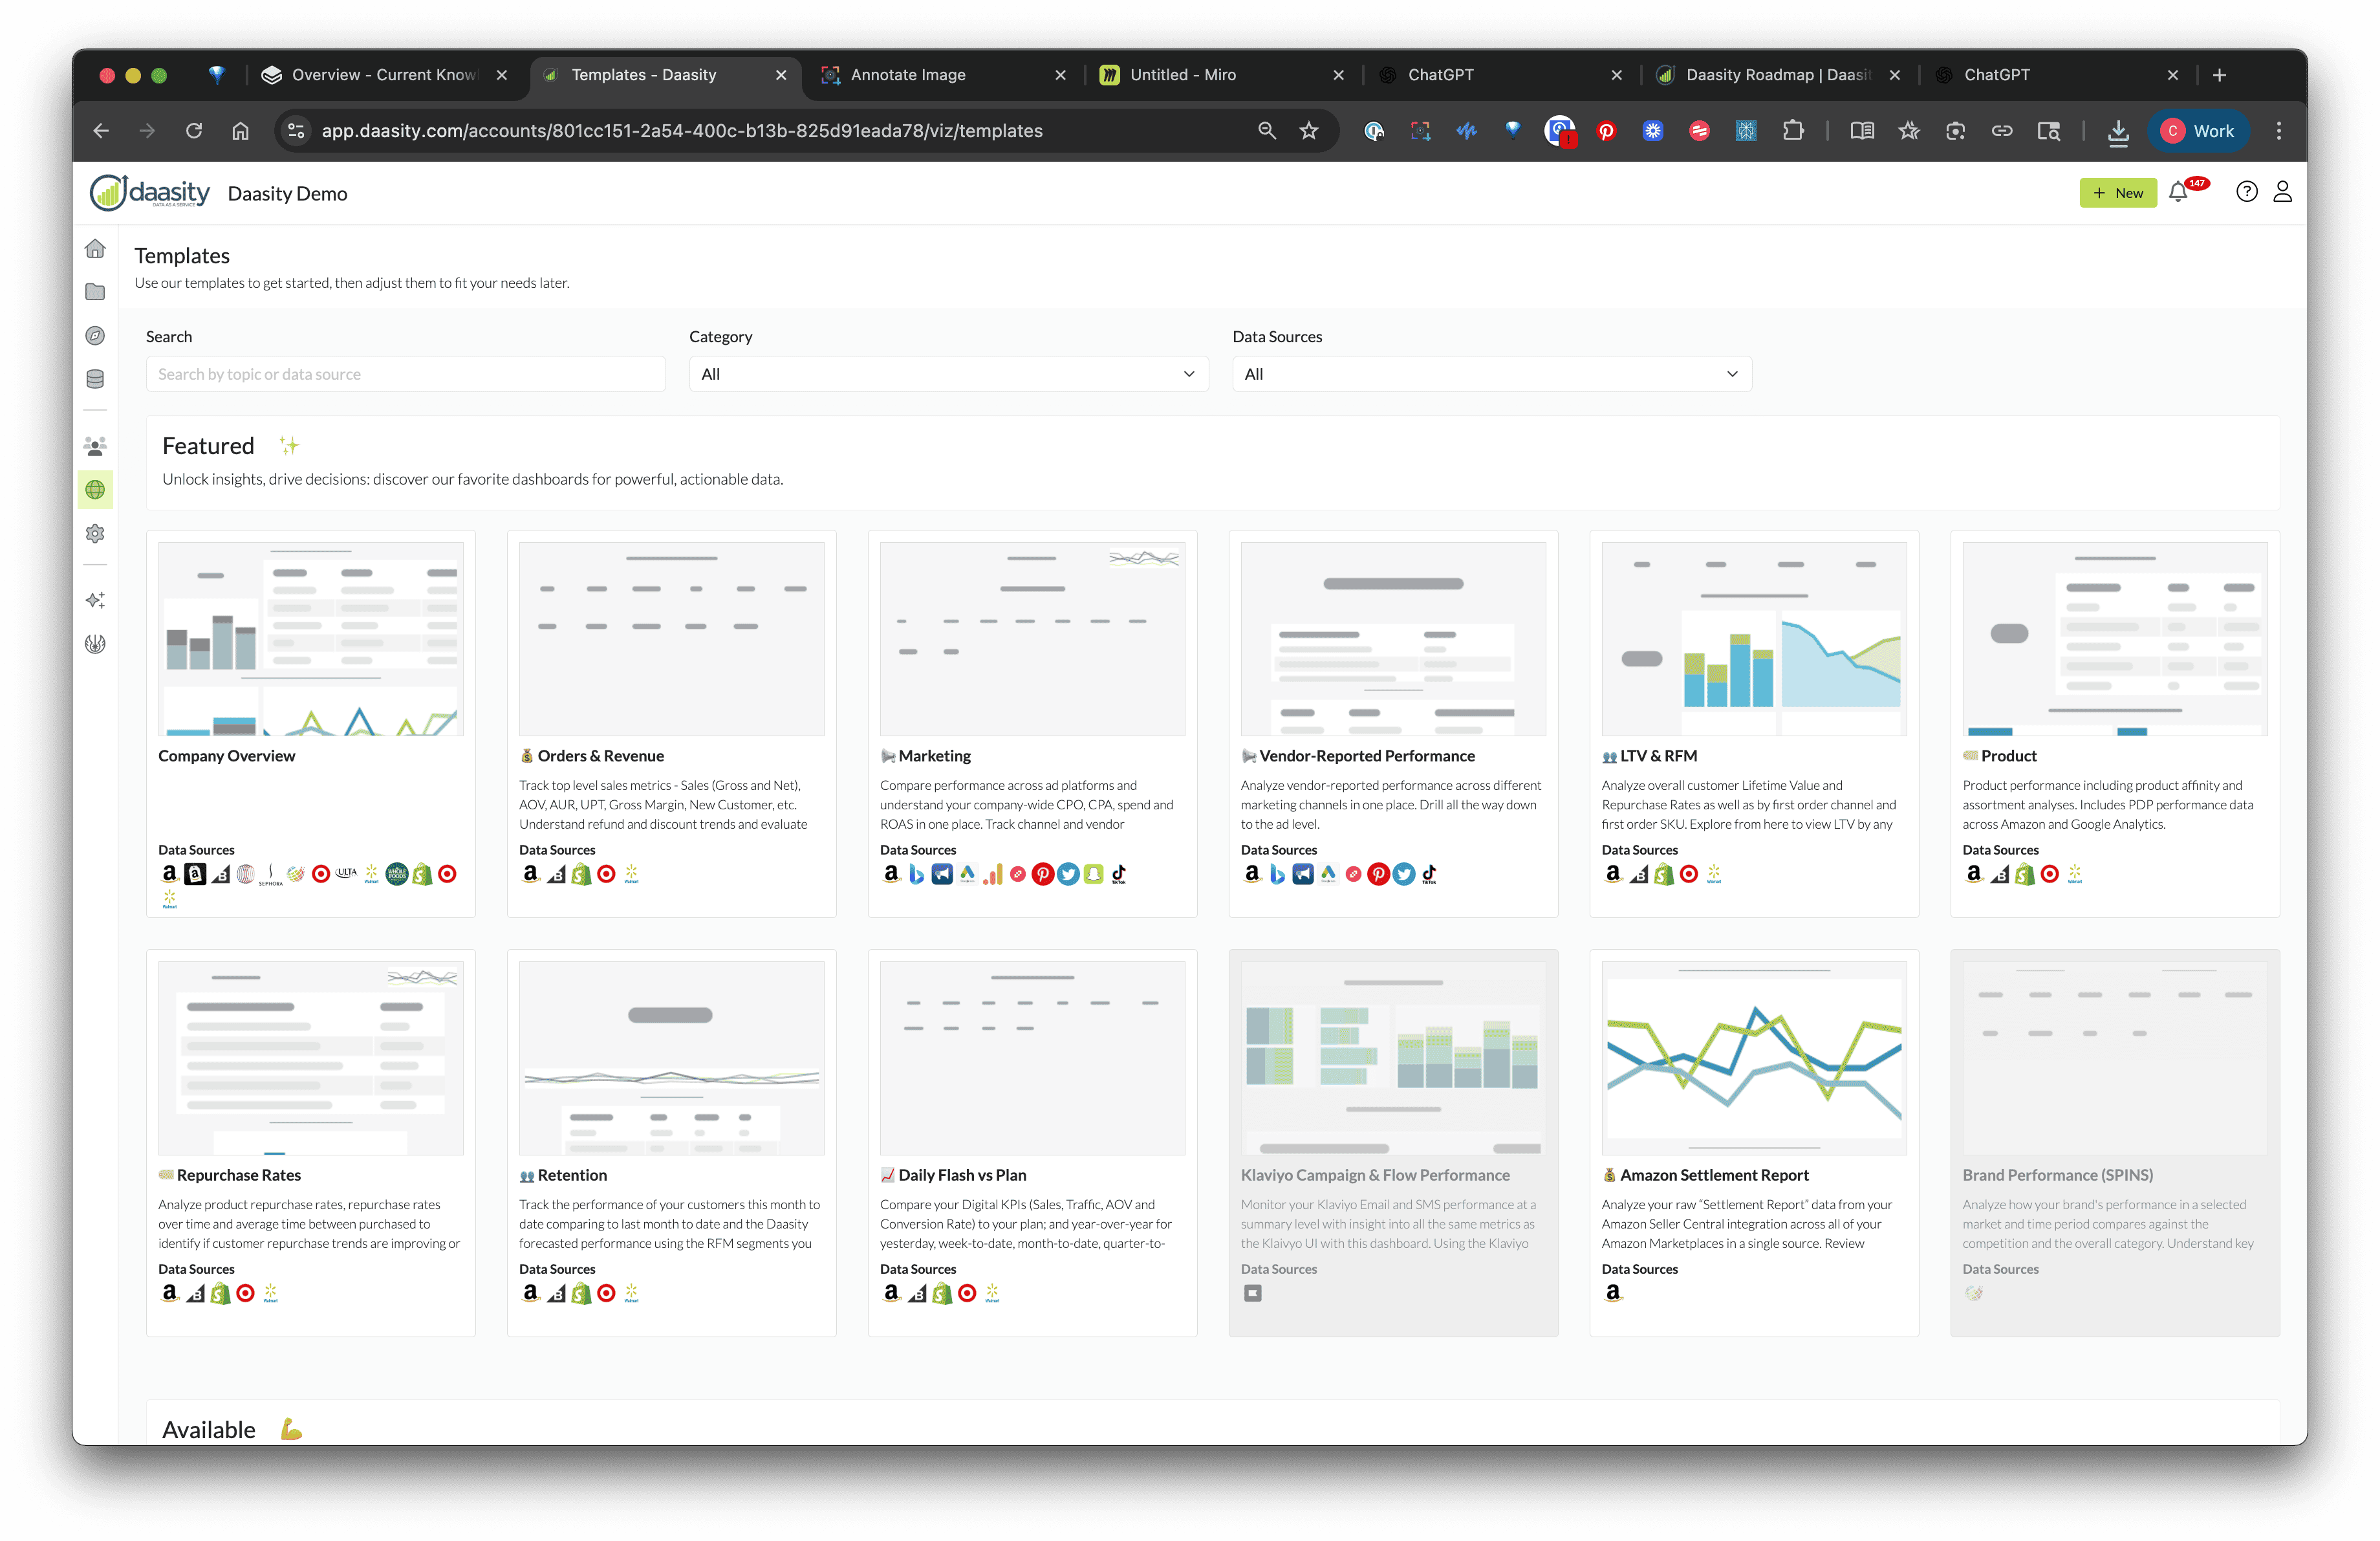
The current Daasity pricing page lists Starter Essentials at $1,499 per month and Essentials at $1,999 per month. Enterprise pricing is custom. That pricing signals the intended customer: a brand with enough channel and operational complexity to justify a dedicated data platform.
Daasity can support marketing, merchandising, finance, operations, and data teams. It is a better match for company-wide reporting than for a merchant who only wants a cleaner daily sales dashboard.
Best for: Larger consumer brands managing DTC, marketplaces, retail, inventory, and contribution margin across departments.
Keep in mind: Cost, onboarding, and sophistication make it excessive for many small and single-channel businesses.
6. Glew: best for broad multichannel ecommerce analytics
Glew combines ready-made ecommerce metrics with managed data infrastructure. Its product range lets a team begin with commerce dashboards and move toward a more customized reporting environment.
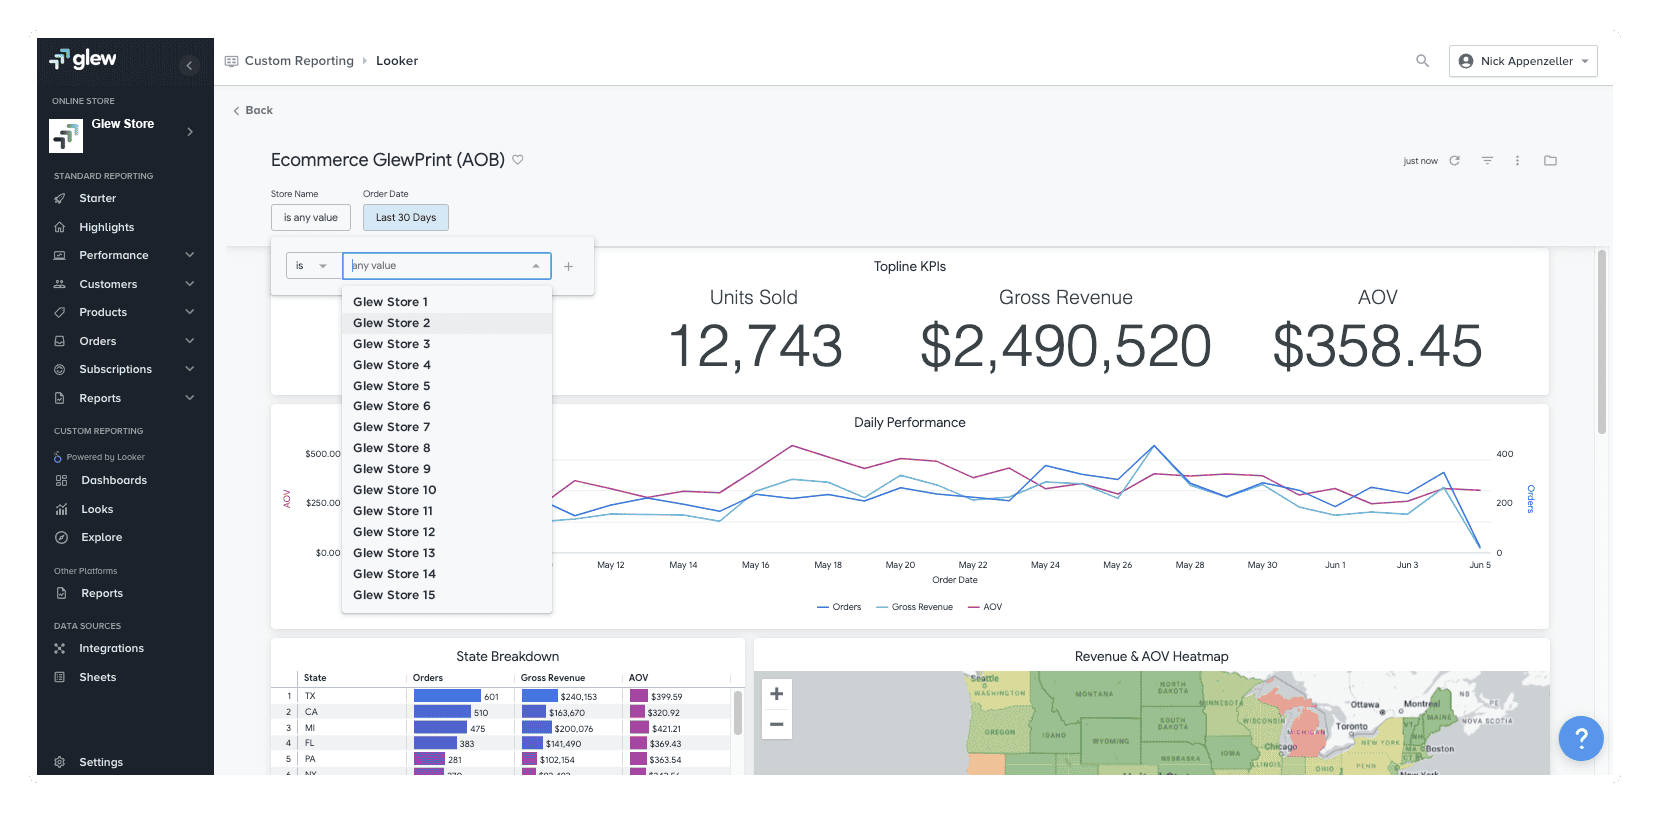
Glew Pro connects more than 40 data sources and advertises 250+ KPIs across sales, marketing, inventory, subscriptions, advertising, customers, and products. It also supports multiple stores, predefined customer segments, and extensive filtering without requiring the user to maintain the underlying pipeline.
Best for: Multichannel businesses that want broad commerce analytics and room to expand toward managed BI.
Keep in mind: Public pricing is not listed, and the platform may be more infrastructure than a small merchant needs.
7. Peel Insights: best for retention, cohorts, and LTV
Peel is useful when top-line revenue is visible but repeat-purchase behavior is not. Its strongest use cases center on cohorts, lifetime value, customer segments, subscriptions, and retention.
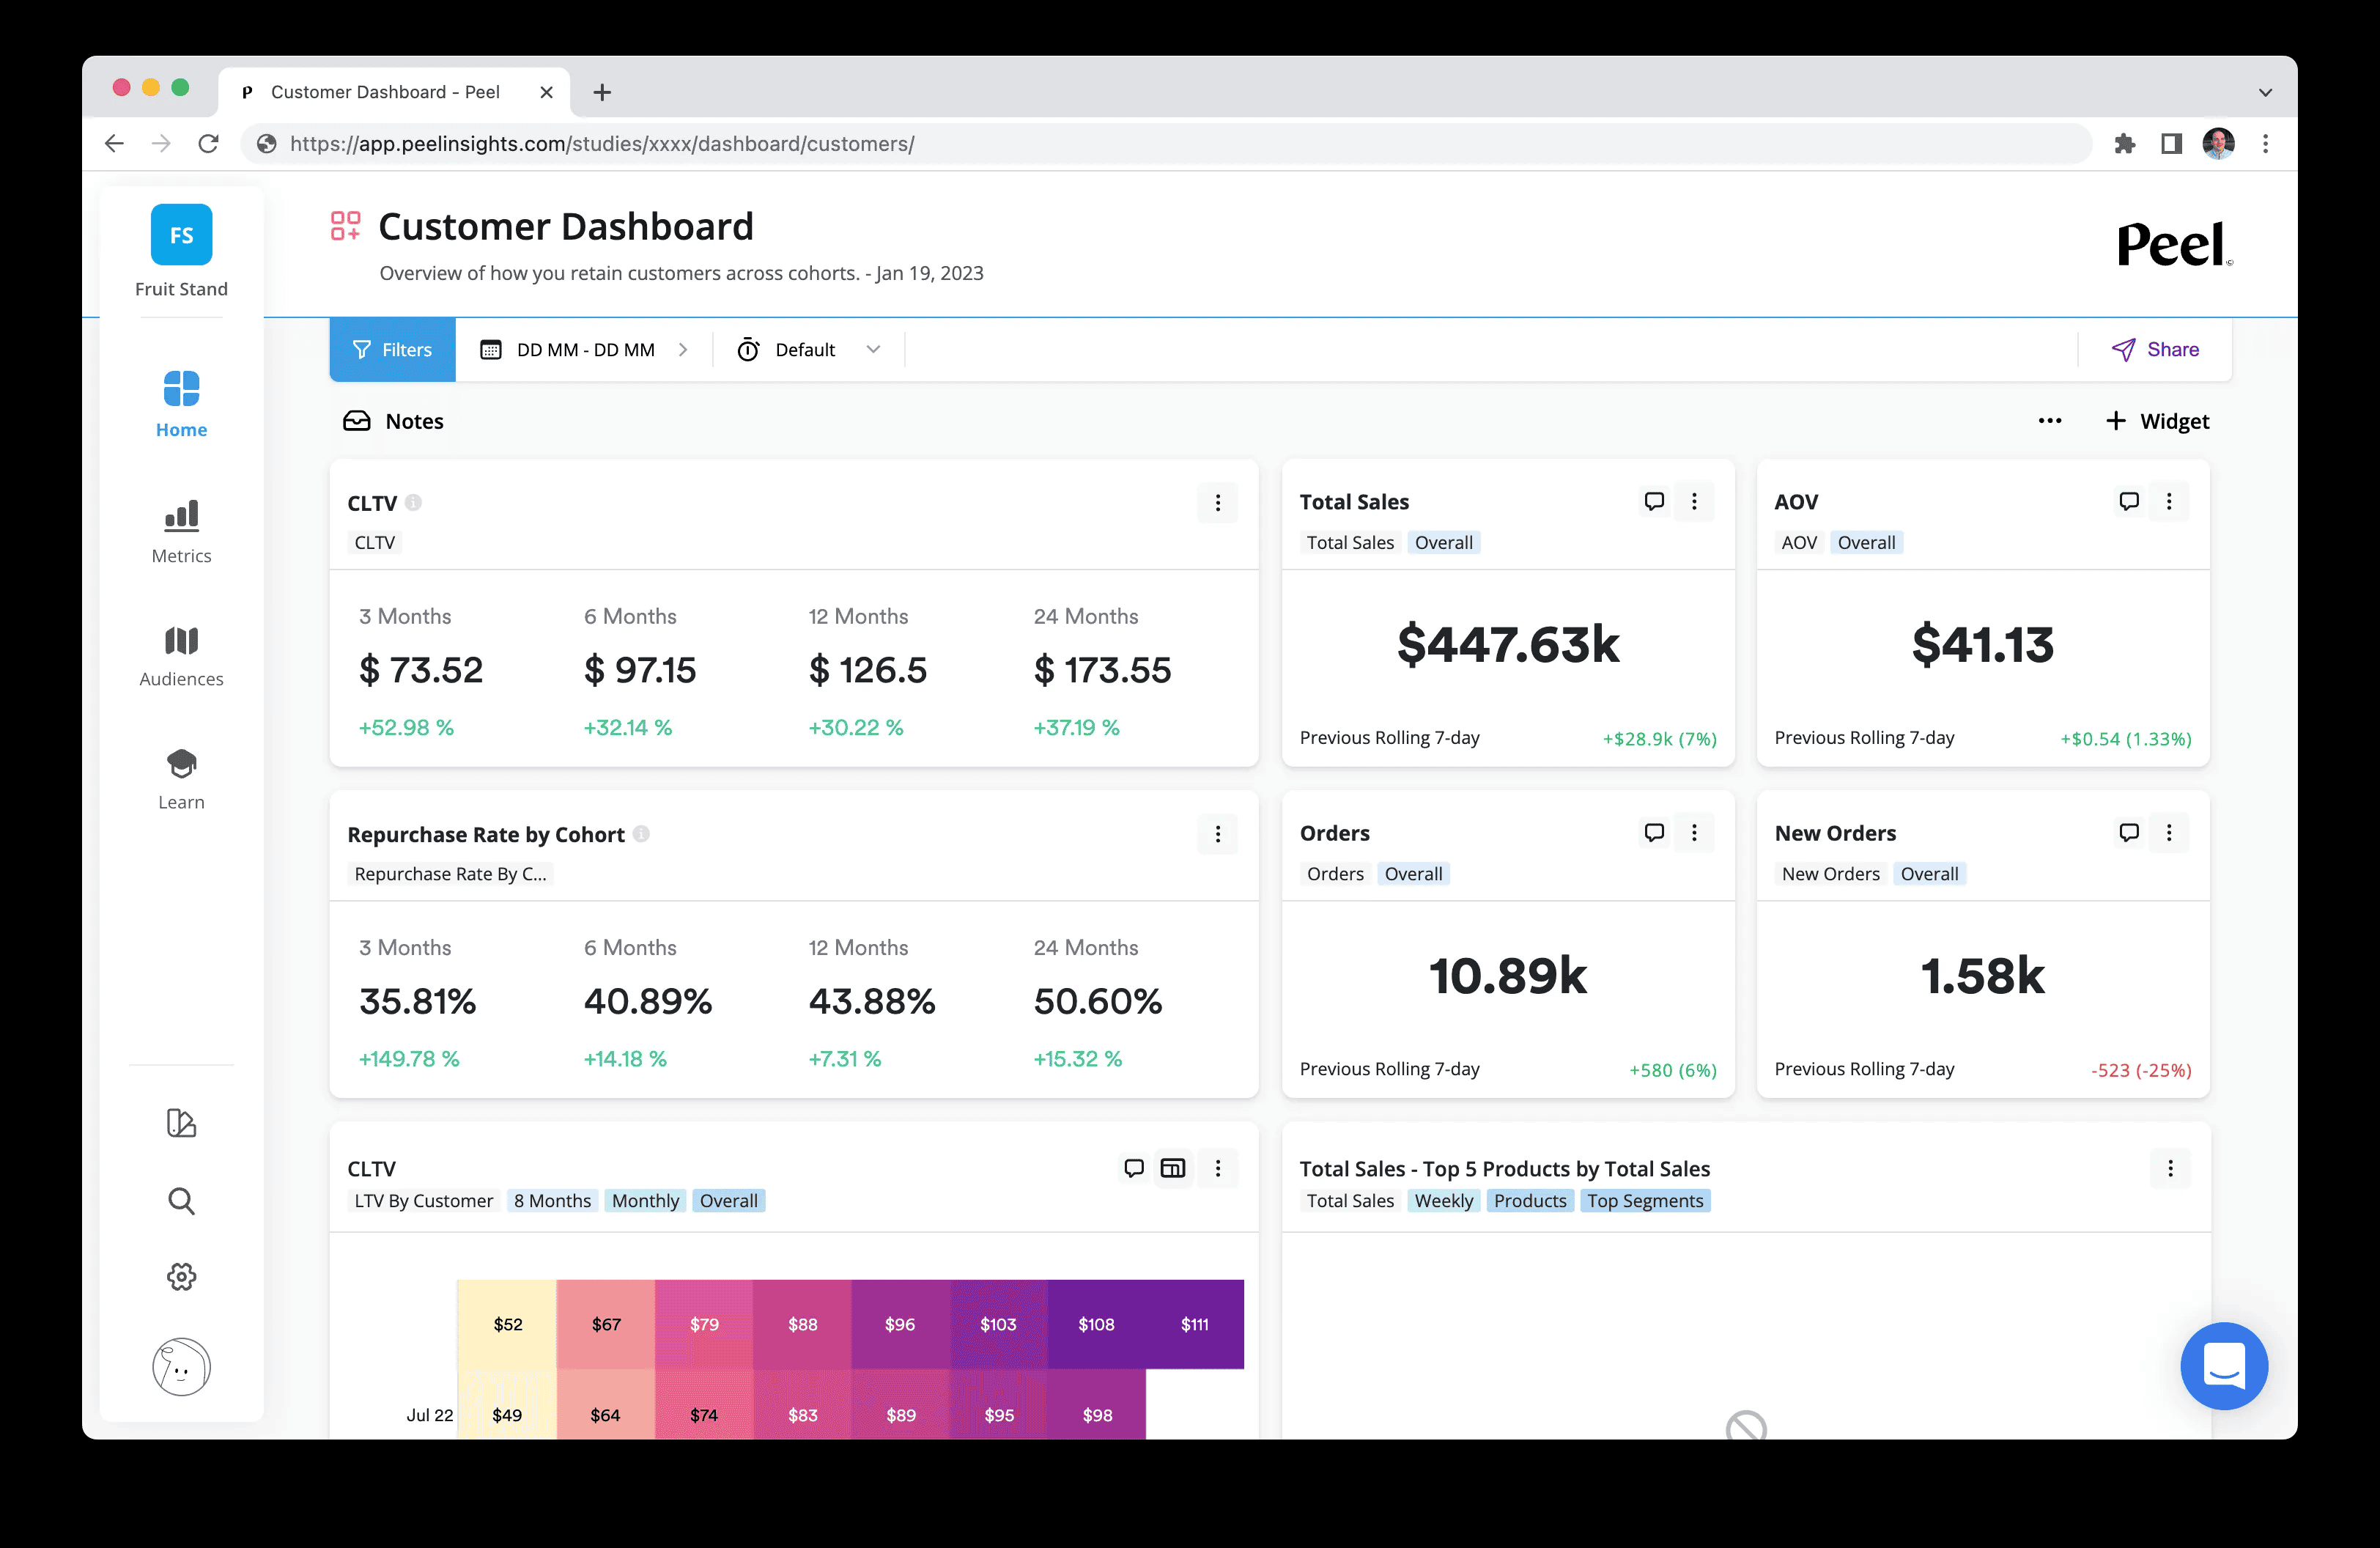
The current Peel pricing page lists Essentials from $449 per month with annual billing or $499 month to month. Pricing scales with monthly order volume. The Essentials feature list includes 30+ cohort KPIs, RFM and custom segments, product metrics, customer journeys, subscription connectors, custom reports, dashboards, COGS intelligence, attribution, and automated reporting.
Best for: DTC and subscription businesses where retention, repeat purchases, cohort behavior, and LTV drive growth decisions.
Keep in mind: Peel refreshes data daily and targets substantial reporting needs. A business seeking only basic sales totals may not use enough of the platform to justify the cost.
8. Supermetrics: best for feeding data into a reporting stack
Supermetrics performs a different job from a ready-made ecommerce dashboard. It moves marketing and sales data from source systems into destinations where a team already plans to analyze it.
The current Supermetrics pricing page lists Starter from $55 per month on monthly billing or $44 per month with annual billing. Starter includes one core destination, three selected data sources, one user, and three accounts per source. Supported core destinations include Looker Studio, Google Sheets, Excel, Power BI, ChatGPT, Claude, and Microsoft Copilot.
That makes Supermetrics useful when the dashboard already exists but manual exports do not scale.
Best for: Marketers, agencies, analysts, and data teams that have chosen a reporting destination.
Keep in mind: Supermetrics solves the pipeline problem. The business still needs to define metrics, design dashboards, and maintain the reporting logic.
9. Google Analytics 4: best free tool for shopper behavior
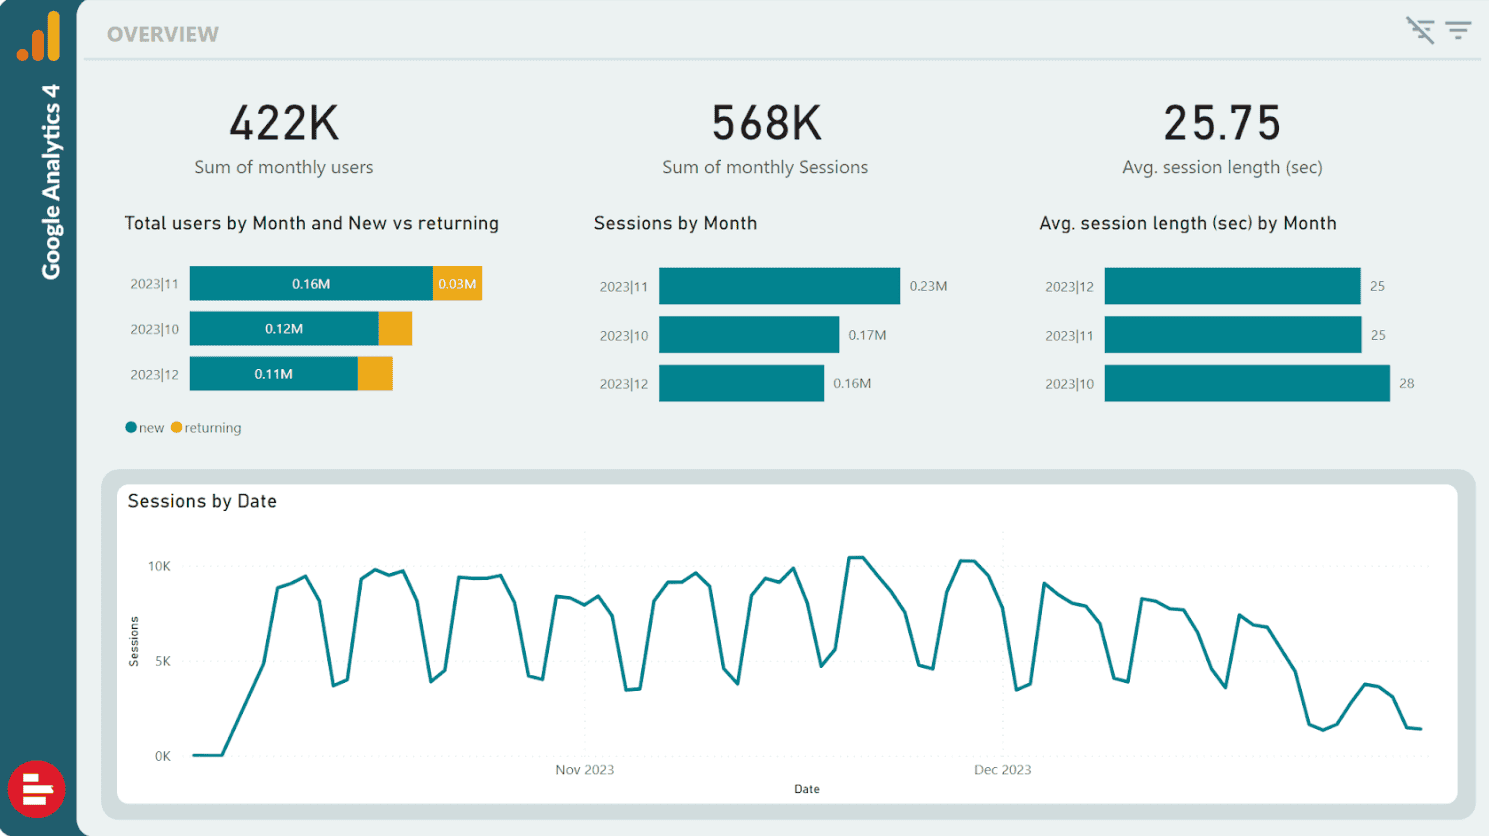
GA4 explains what people do before and during a purchase. It measures acquisition, landing pages, product views, cart activity, checkout steps, promotions, purchases, and other website or app events.
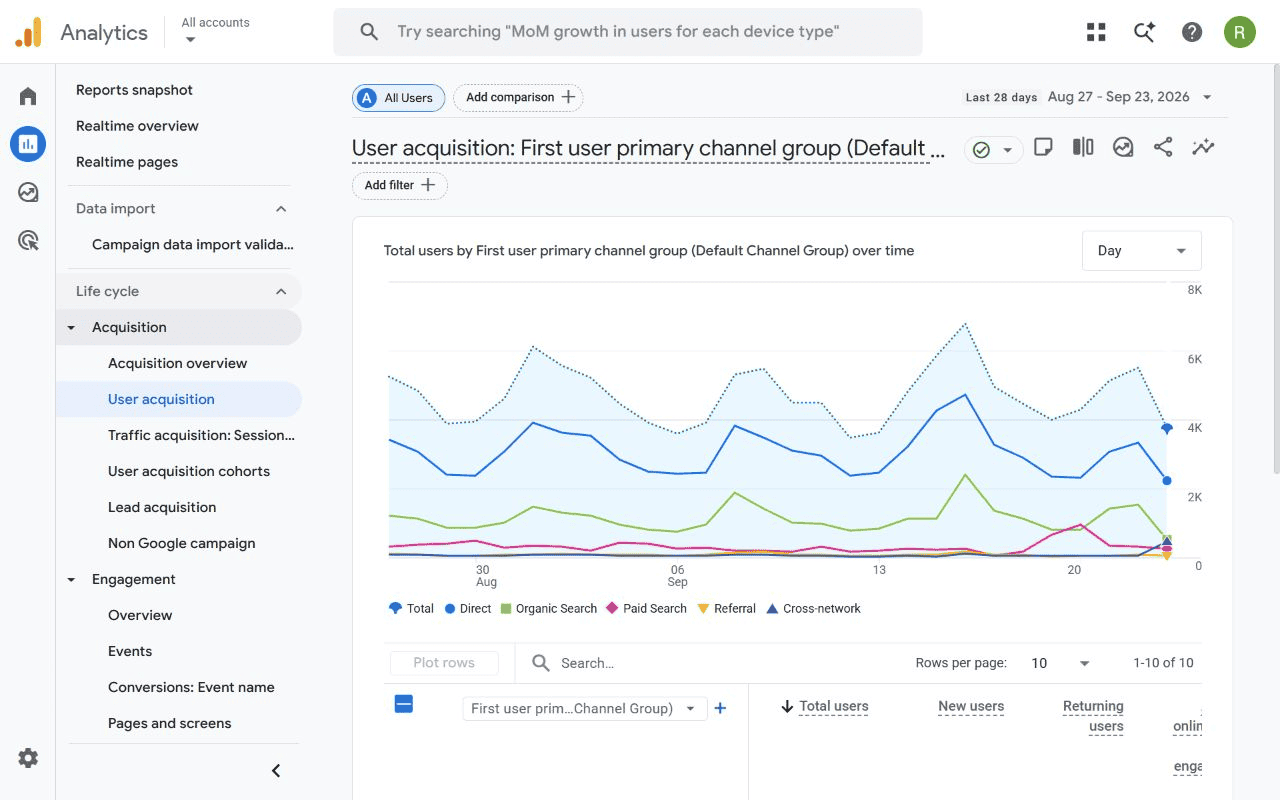
Google’s ecommerce measurement guide says a developer may need to implement ecommerce events. Once events are collected, product and shopping data typically appear within 24 to 48 hours. Shopify tracks certain ecommerce events automatically, but other setups may require manual work.
GA4 is therefore complementary to commerce reporting. It is strong at journeys and behavior, but it is not automatically the authority for payment reconciliation, complete customer financial history, or consolidated multi-store revenue.
For a deeper setup and interpretation guide, see this GA4 ecommerce reporting guide.
Best for: Nearly every ecommerce website that needs acquisition and onsite behavior analysis.
Keep in mind: Incorrect or incomplete event implementation produces incomplete reports. Validate events and parameters before using GA4 revenue in decisions.
10. Data Studio (formerly Looker Studio): best for building custom dashboards
Data Studio, called Looker Studio until April 2026, is a reporting canvas for teams that want control over metrics, layout, filters, and visualizations. It can connect directly to Google products and use partner-built community connectors for other systems.
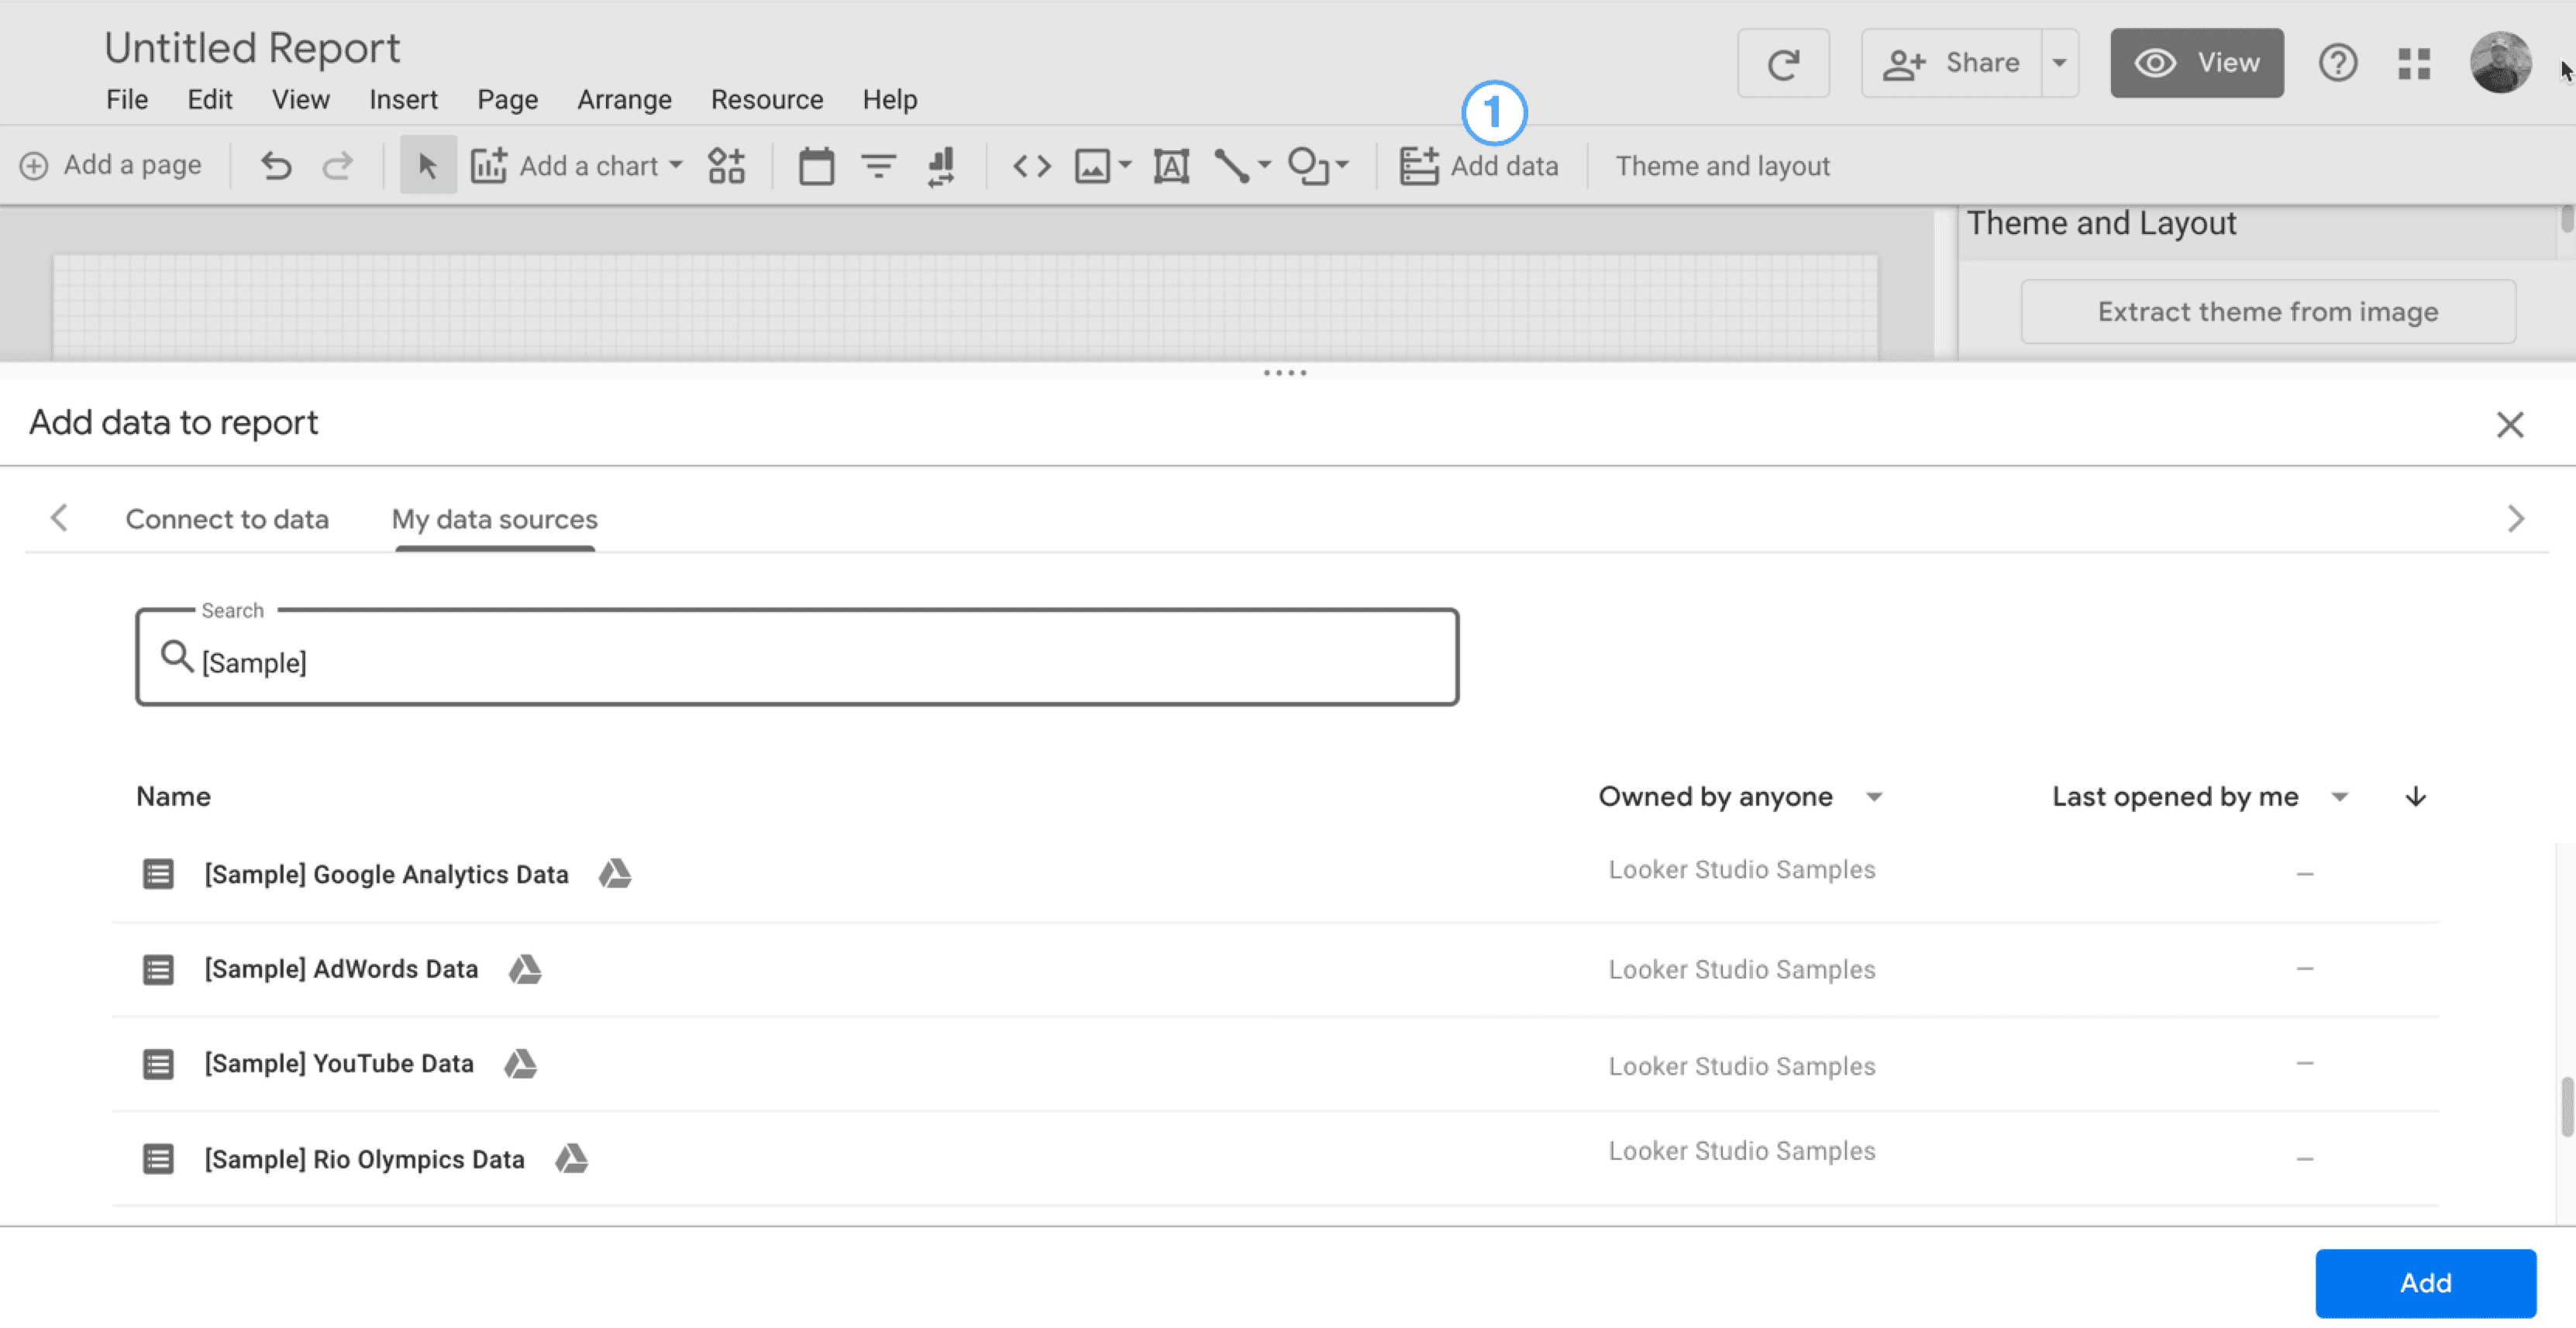
Google describes standard Data Studio as a no-cost self-service reporting product with access to more than 1,000 data sources. The drag-and-drop editor supports interactive reports, embedded dashboards, and ad hoc analysis. Community connectors can carry separate costs.
Flexibility is the benefit and the trade-off. Data Studio does not automatically clean ecommerce records, reconcile payments, define the correct business metrics, or design a durable data model.
Best for: Analysts, agencies, and teams comfortable building and maintaining custom dashboards.
Keep in mind: A free visualization layer can still create significant implementation and maintenance work.
How should you choose an ecommerce reporting tool?
Choose the category of ecommerce reporting tools before comparing feature lists. The four questions below narrow the field quickly.
Where does your important data live?
One store and one payment setup may be served well by native reporting. Several stores, gateways, currencies, or revenue models make consolidation more valuable.
A business spanning advertising platforms, DTC, Amazon, retail, inventory, and finance is closer to a BI or commerce data-platform problem.
Which question cannot be answered today?
Match the missing answer to the tool’s core job:
- How much did one Shopify store sell? Start with Shopify Analytics.
- Where are shoppers leaving the purchase journey? Use GA4.
- Which ads are influencing revenue? Consider Triple Whale.
- Which customers return and generate the highest LTV? Consider Peel.
- How is the business performing across stores and payment gateways? Consider Putler.
- How do sales, inventory, marketing, retail, and finance fit together? Consider Polar, Glew, or Daasity.
- How can existing dashboards receive data automatically? Consider Supermetrics.
- How can the team design its own dashboard? Consider Data Studio.
Do you want ready-made analytics or more control?
Native reports and commerce-specific tools provide predefined metrics and faster setup. BI platforms and custom dashboards offer more control but require more implementation, modeling, and maintenance.
The choice is not a maturity contest. A well-defined ready-made report is better than an elaborate BI stack nobody trusts.
What is the real reporting cost?
Subscription price is only one component. Include setup, data cleanup, dashboard creation, analyst time, engineering, manual exports, reconciliation, and ongoing maintenance.
A free dashboard that takes five hours to rebuild every week is not free in practice. A costly platform is also hard to justify when native reports already answer the business’s recurring questions.
A free dashboard that takes five hours to rebuild every week is not free in practice.
Which ecommerce reporting tool fits each use case?
| Reporting need | Strong starting point |
|---|---|
| Shopify-native reporting | Shopify Analytics |
| Website and checkout behavior | Google Analytics 4 |
| Marketing attribution | Triple Whale |
| Retention and LTV | Peel Insights |
| Unified commerce reporting | Putler |
| Growing-brand BI | Polar Analytics |
| Omnichannel data infrastructure | Daasity |
| Broad multichannel analytics | Glew |
| Automated data movement | Supermetrics |
| Custom dashboards | Data Studio |
The table is a starting point, not a universal ranking. Integration coverage, historical data, currencies, team skills, and required metrics can change the decision.
When do you need dedicated ecommerce reporting software?
A new tool becomes useful when reporting work prevents analysis. Common signals include:
- Exporting reports manually every week
- Reconciling conflicting revenue numbers
- Opening several dashboards each morning
- Operating multiple stores or payment gateways
- Selling in several currencies
- Combining subscriptions with one-time purchases
- Managing paid acquisition across many channels
- Watching teams report different versions of the same metric
- Spending more time preparing data than interpreting it
Amazon sellers facing this problem can compare the source layers in this Amazon reporting dashboard guide. Digital-product sellers can use this Gumroad analytics guide to decide when native data stops being enough.
The need is structural, not fashionable. Add software when the current reporting setup no longer matches the business.
Which ecommerce reporting tool should you choose?
Start with the smallest system that answers the important recurring questions reliably.
If every platform shows a different piece of the business, Putler is worth evaluating. It combines supported commerce, payment, customer, product, subscription, and analytics data so a team can examine the whole business without first building a custom reporting stack.
Frequently asked questions
What is an ecommerce reporting tool?
An ecommerce reporting tool organizes store and business data into reports for sales, customers, products, marketing, subscriptions, and performance. Some products report on one platform. Others combine several stores, payment gateways, advertising systems, or data sources. The right type depends on where your data lives and which question you need answered.
What is the difference between ecommerce reporting and ecommerce analytics?
Reporting describes what happened through metrics, tables, and dashboards. Analytics helps explain patterns, compare segments, investigate causes, and decide what to do next. Many platforms combine both functions, but the balance between fixed reports and flexible analysis varies. In short, reporting shows the numbers, and analytics helps you act on them.
Is Google Analytics enough for ecommerce reporting?
GA4 is valuable for acquisition and onsite behavior, including product views, cart actions, checkout activity, and purchases. It may not cover payment reconciliation, complete customer financial history, subscription operations, or consolidated multi-store revenue, so many businesses use it with commerce reporting tools.
Do small ecommerce businesses need reporting software?
Not always. A small business operating through one platform may get enough information from native reports. Dedicated software becomes useful when data spreads across stores, gateways, currencies, subscriptions, or marketing channels, or when manual reconciliation begins consuming significant time. Start by listing the questions your current reports cannot answer.
What is the best ecommerce reporting tool for multiple stores?
The answer depends on integrations, reporting depth, and customization. Putler focuses on consolidated reporting across supported commerce sources. Polar, Glew, and Daasity suit more advanced BI or omnichannel requirements. Data Studio supports a custom approach when a team can build and maintain the data model.