
Google Analytics is one of the most used web analytics solutions.
Even though more than 75 million websites use Google Analytics, not everyone is a Google Analytics expert. Most website owners and marketers conduct a surface-level performance analysis of their websites. It also can be tricky to switch through multiple dashboards and gain insights.
Many marketers struggle to make sense of their Google Web Analytics data.
But not anymore!
In this article, you will learn about one of the most useful eCommerce analytics tools, Putler. It is far more advanced and simpler than Google Analytics. Putler’s Audience Dashboard helps you drill down into various metrics and KPIs in seconds.
Let’s begin the discussion.
No more switching through multiple Google Analytics dashboards
In Google Analytics, you need to drill down to multiple tabs to view your traffic reports. On the other hand, in Putler, web analysis is simpler:
- Browser: Audiences dashboard > Browser Category
- Mobile or Device: Audiences dashboard > Device Category
- Social Media: Audience dashboard > Social Network
- Most popular pages: Audience dashboard > Which pages are most popular?
- Search term used: Audience dashboard > Search terms customers use to find
Let’s cut this hard work now.
Putler brings all necessary reports together in one place, eliminating the need to switch between multiple dashboards like Google Analytics.
All you need to do is go to your Audience Dashboard in Putler and your data will be readily available.
Let’s see how useful and important each of these functionalities is for your website:
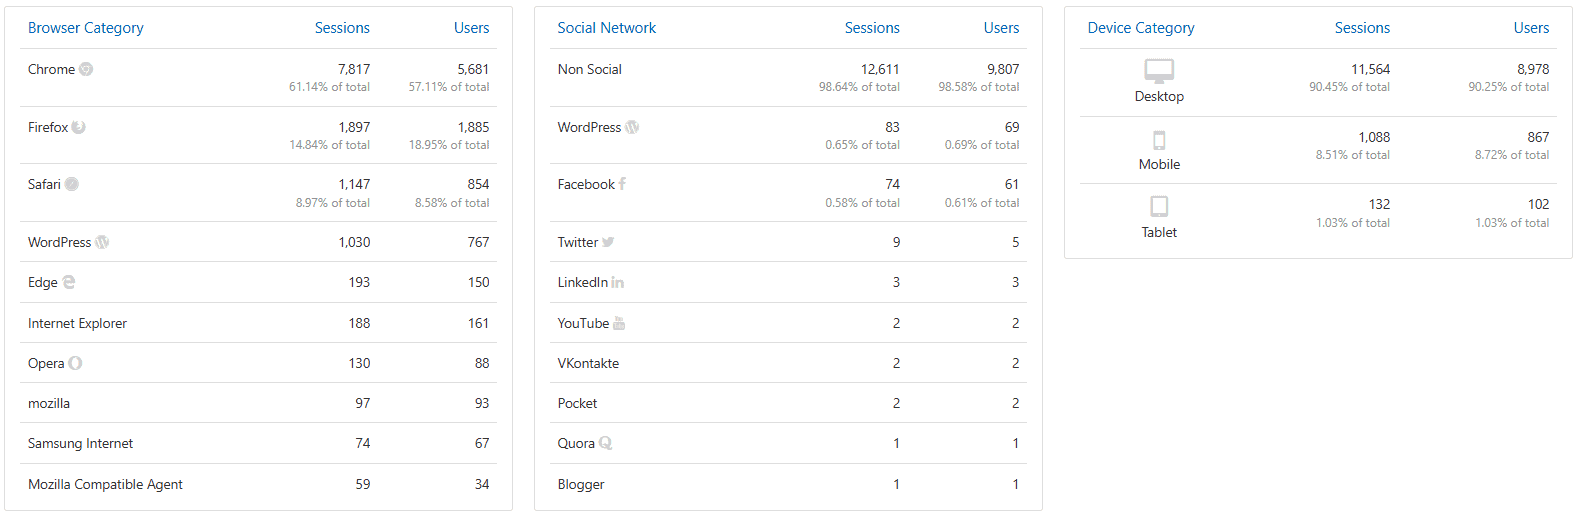
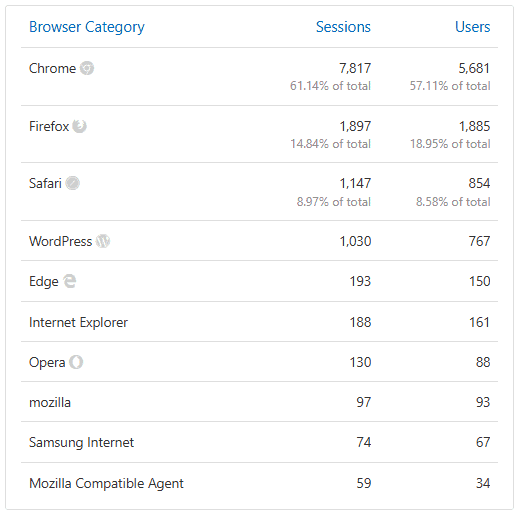
1. Browser Traffic
This report shows the data of different browsers your visitors use to browse your website.
How Browser Traffic Affects Your Business?
Browser reports are probably more useful to your web developer.
As shown in the above example, about 90% of your total traffic visits your website through Chrome, Safari, and Firefox. This means you should test and review your website periodically in these popular browsers.
Whenever you update anything, make sure it runs well first on these browsers and others as well without any lags and breaks. This makes your visitors’ browsing experience a seamless one.
For eCommerce stores, browser compatibility directly impacts conversion tracking accuracy. A checkout that breaks on Safari means lost sales and incomplete data in your reports.
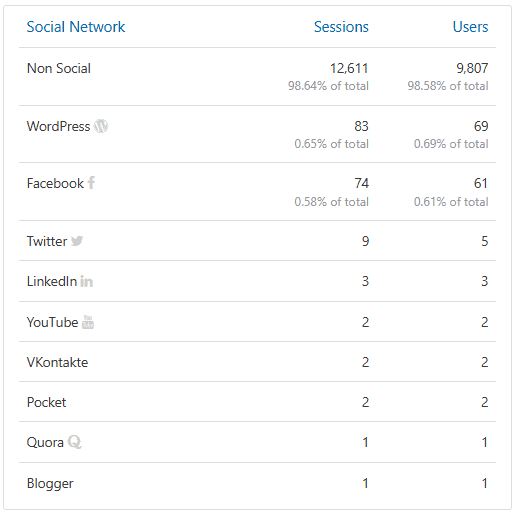
2. Social Network Traffic
This report shows the distribution of your entire traffic into two parts – non-social and top performing social media channels.
How Does the Social Network Traffic Report Affect Your Business?
This report displays how much traffic you have acquired through various social media channels.
Digging deep through each of the social channels, you get to know which platform drives more traffic to your website.
- If it’s Instagram, Twitter, or Facebook, it may be a reel, post, and/or tweet that has received higher engagement.
- For WordPress, it could be due to your plugin link or effective CTAs.
- It’s beneficial to analyze visitors coming via Instagram and Quora, as these channels are highly profitable platforms today and hold potential for future profitability.
This report will also help you prioritize social channels for advertising and campaign targeting.
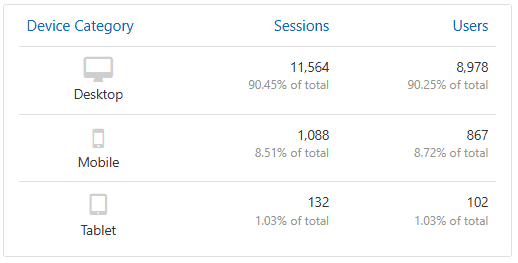
3. Device Category / Mobile Traffic
This report shows your traffic segmented via desktop, mobile, and tablet.
How Does the Device Traffic Report Affect Your Business?
You should always focus more on your visitors through a mobile device because new statistics show that more than 60% of website traffic comes from mobile devices.
In addition, as per Google, mobile-optimized websites will be given preference in SEO. So make sure your site is optimized to work on mobile devices. Hence, a site that isn’t mobile responsive may rank below in search engines.
Addiction to mobile and easy internet access has also increased browsing tremendously. Approximately 60% of internet traffic comes from North America itself.
So, do not be surprised if you see a rise in traffic coming via mobiles. But also don’t ignore traffic via desktops and tablets. They too are equally important.
If you’re running a WooCommerce store, device reports become even more critical since checkout behavior differs significantly between mobile and desktop users.
What will make a better user experience for mobile users?
- Short and easy to fill out forms, be it signup or checkout.
- Popups that are easy to close. Use header/footer bars instead to show popups.
- Clear call-to-actions “above the fold” are better.
4. Most popular pages
This report displays the most visited website pages or those on which you get the most traffic. Also, it showcases the time users spend on each specific page.
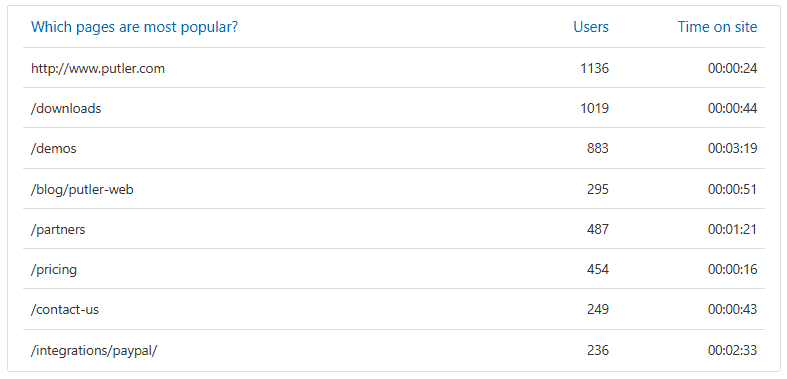
It helps you understand your target audience’s behavior so you can leverage this report to acquire maximum traffic while launching a marketing campaign.
For multi-platform sellers using BigCommerce with Google Analytics, comparing popular pages across storefronts reveals which product categories resonate with different audiences.
5. Search terms customers use to find
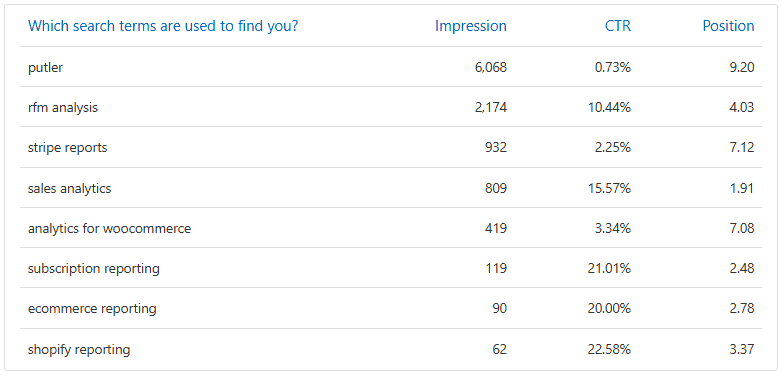
When you know what terms your target audience uses to browse or find your website or your services in your industry, it becomes easier to enhance SEO.
You can effectively utilize those specific terms to boost SEO, create engaging ads, write effective articles, and more.
Additionally, this report also tells about the impression, CTR, and position of each search term.
Further, similar to Google web analytics, you can also know from which country you get the most traffic and which medium is contributing to it, such as email, organic search, referral, social, and direct.
New vs Returning Visitors: Why This Split Matters
GA4 does not have built-in audiences to distinguish new versus returning visitors by default. You need to create these audiences manually, but the insight is worth the effort.
New visitors indicate your marketing reach is growing. If this number stagnates, your acquisition channels may need attention.
Returning visitors show engagement and loyalty. A high return rate means your content or products keep people coming back.
To set this up in GA4, go to Admin > Audiences > Create Audience. Define “New Visitors” as users where session count equals 1. Define “Returning Visitors” as users where session count is greater than 1.
Tracking this ratio over time helps you understand whether a traffic increase comes from acquisition efforts or retention. Both matter, but they require different strategies to improve.
Let Putler take it up a notch
Putler reduced the website analysis time significantly, thanks to its advanced 200+ business metrics and KPIs that Google Analytics does not provide.
Putler is designed to save time and enhance data accessibility, allowing businesses to efficiently focus on improving their online presence. It’s super handy and offers an excellent user experience. So, you can focus on what really matters—growing your online presence.
We strive to improve every day. Your ideas, suggestions, and feedback will only help us deliver the best.
Let us know what you think of this post in the comments section below.