
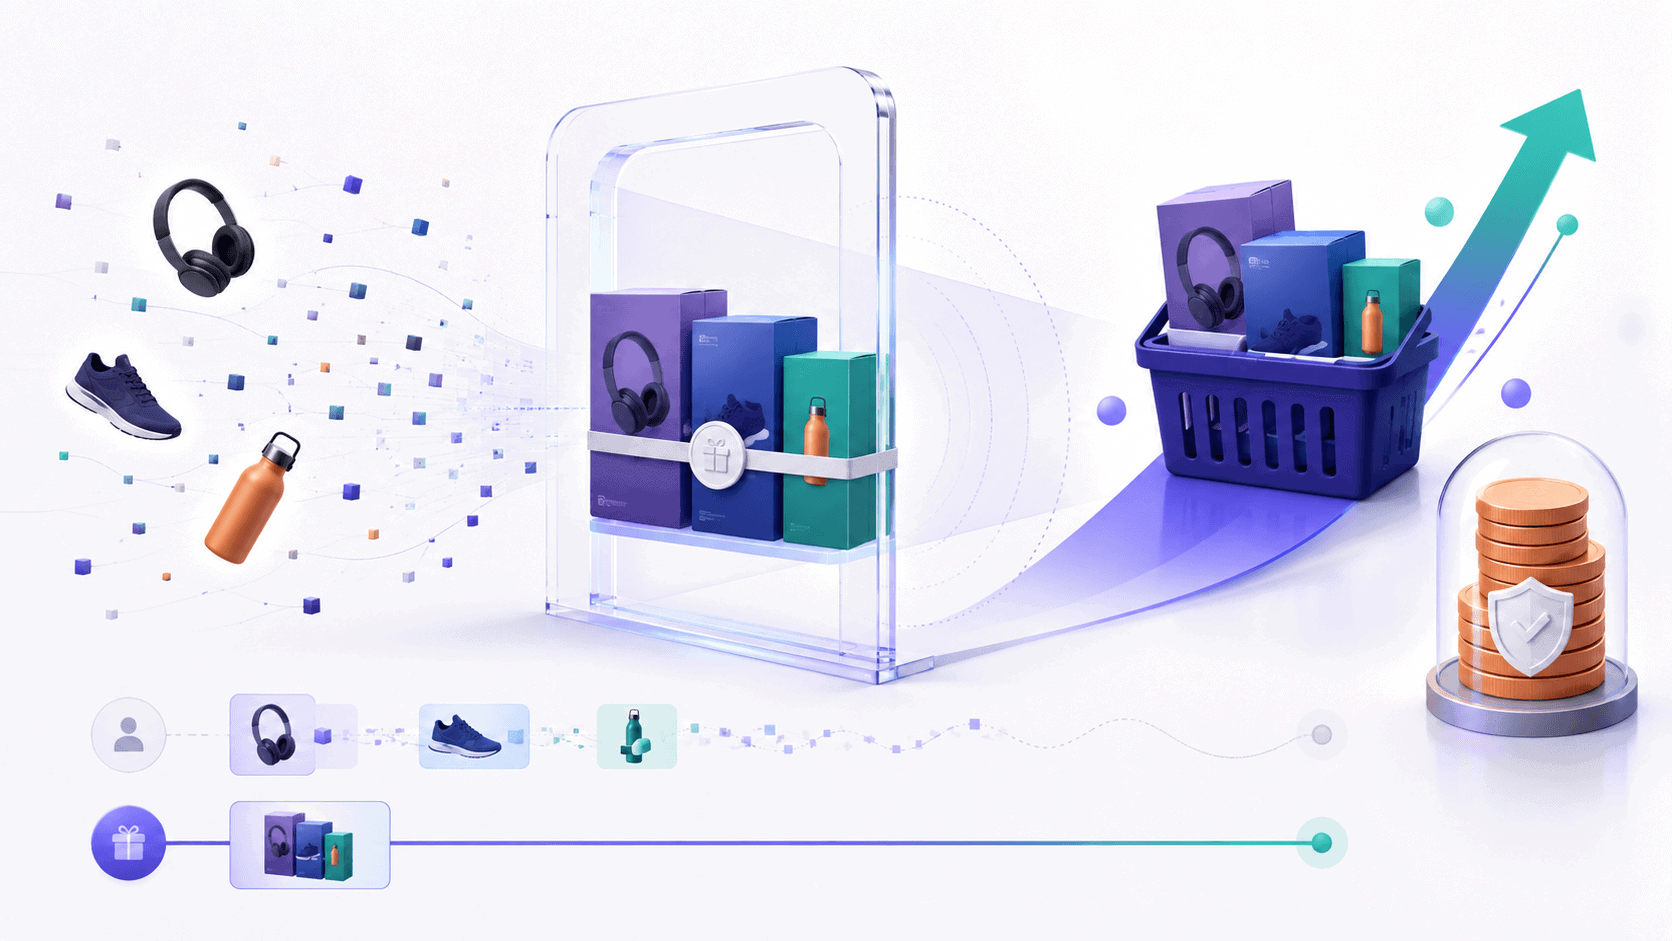
You launched product bundles on your store. Sales look busier. But one question still isn’t answered: are those bundles actually lifting your order value, or just handing out discounts on sales you’d have made anyway?
By the end of this guide, you’ll be able to tell the difference. You’ll know which metrics prove a bundle is working, how to isolate a bundle’s effect on Average Order Value (AOV), and how Shopify bundle analytics gives you the numbers to do it.
This is written for merchants who already run bundles and now want to measure them, not set them up from scratch.
Here’s the trap to avoid first: watching total revenue instead of order value. Total sales can climb while your bundles quietly shrink your margin or replace full-price purchases. The right metrics tell you what’s really happening.
Why measuring bundle performance matters

Bundles almost always involve a discount. That’s the mechanism that makes them attractive, and it’s also the reason an untracked bundle can quietly eat your profit.
Three risks make measurement non-optional:
- Margin erosion. A bundle discount lowers revenue per item. If you don’t track margin after the discount, a “successful” bundle can still lose you money.
- Cannibalization. A bundle may just replace a purchase the customer was already going to make at full price, so you’ve discounted a sale you’d have won anyway.
- Blind optimization. You can’t improve a bundle you can’t measure. Without numbers, every change is a guess.
AOV cuts through all three. When you can see the order value of bundle orders next to non-bundle orders, you get a fast, honest read on whether the strategy is adding value or leaking it.
The key metrics to track
AOV is the headline, but a few supporting metrics tell you why AOV is moving. Track these together.
| Metric | What it tells you | Why it matters |
|---|---|---|
| AOV | Average revenue per order | The core signal that bundles are lifting order value |
| Bundle take rate | Share of orders that include a bundle | Shows whether customers actually accept the offer |
| Units per transaction (UPT) | Average items per order | Confirms customers are buying more, not just differently |
| Bundle revenue share | Bundle sales as a share of total revenue | Shows how much of your business the bundle drives |
| Gross margin per order | Profit per order after the bundle discount | Protects you from “revenue up, profit down” |
| Cannibalization rate | Bundles replacing full-price single sales | Reveals whether the lift is real or borrowed |
| Repeat rate / LTV of bundle buyers | Whether bundle buyers come back | Shows if bundles attract one-time deal-seekers or loyal customers |
Don’t track all seven with equal weight. Lead with AOV and gross margin per order, then use the rest to explain what you see.
How bundles affect AOV (the deep dive)
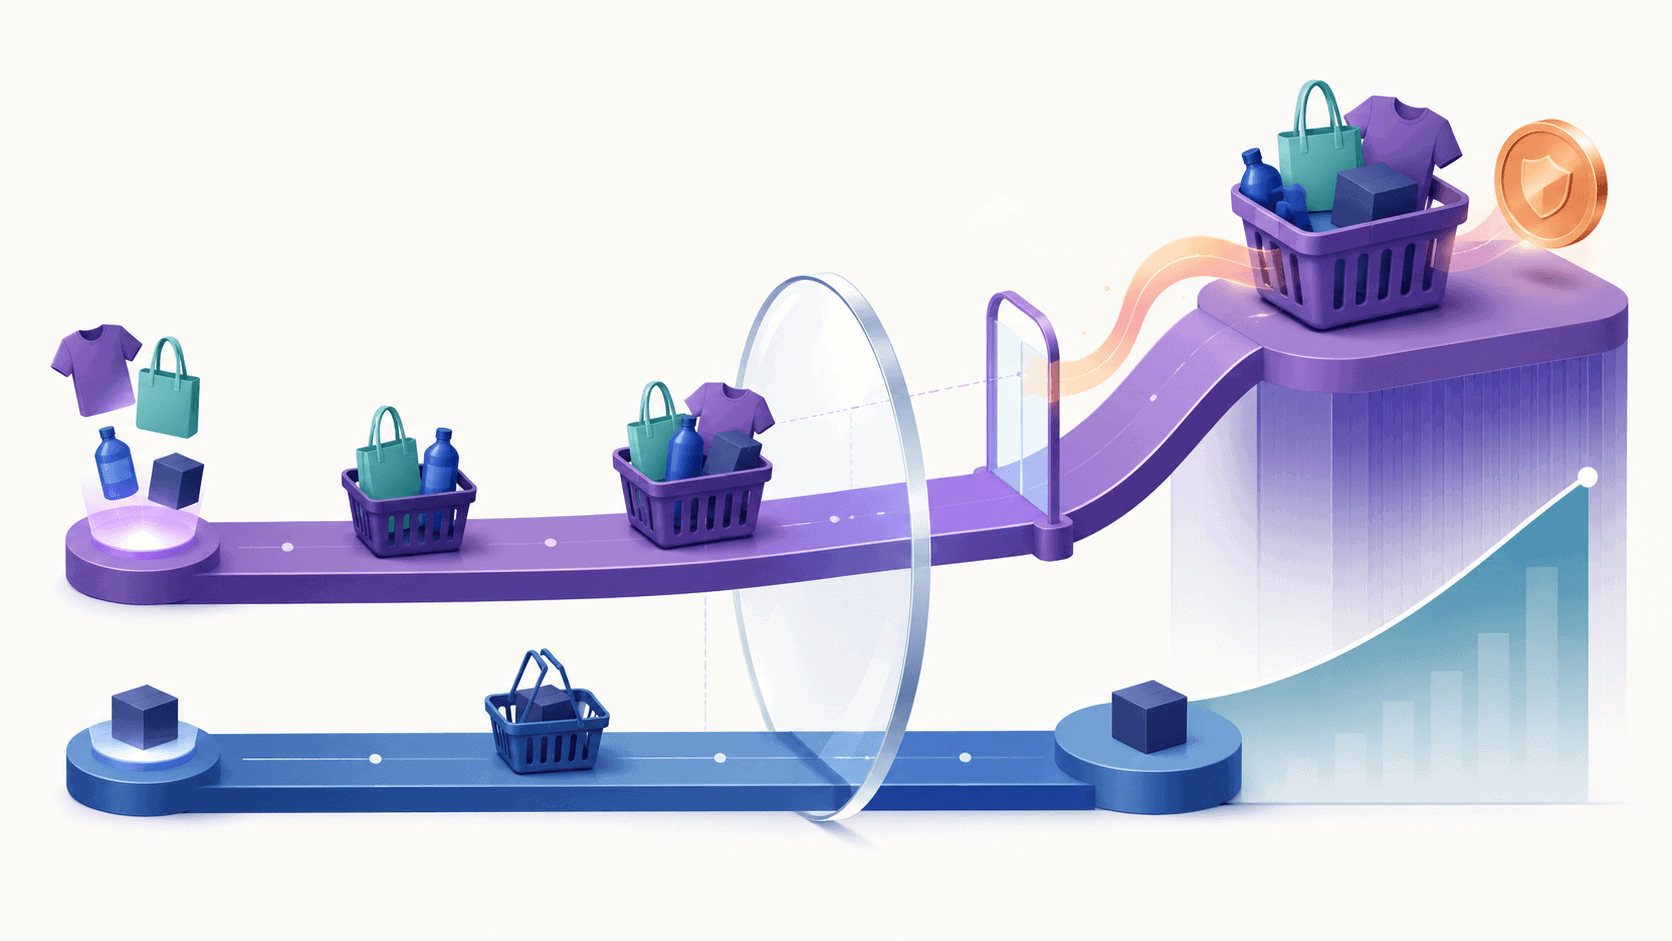
AOV is a simple formula:
A bundle lifts AOV when it pushes customers to add more value to a single order than they otherwise would. The way you construct the bundle decides how much lift you get.
Construction shapes the outcome
This is where your bundle app does the heavy lifting. BOGOS is built to create these bundle types, and each one pulls on AOV differently:
- Fixed Bundle — a curated set sold together at one price. Lifts AOV by moving customers from one item to several.
- Mix & Match Bundle — customers build their own set from a selection. Lifts AOV by letting customers add more of what they already want.
- BOGO / BXGY — buy-one-get-one or buy-X-get-Y offers. Can lift AOV when the trigger requires a larger order, but can lower it if the free item is too easy to earn.
- Gift with Purchase (GWP) — a free gift above a cart threshold. Lifts AOV by giving customers a reason to reach the threshold.
The construction detail that matters most for AOV is the threshold or trigger. A GWP that unlocks at $75 when your AOV is $50 gives customers a concrete reason to add more. A BOGO with no minimum can shrink AOV instead of growing it.
Isolating the bundle’s real effect
Total AOV going up doesn’t prove your bundle caused it. To isolate the effect, compare two groups of orders in the same period:
- Orders that include a bundle
- Orders that do not include a bundle
The gap between those two AOV numbers is your bundle’s lift. You should also compare against your baseline — your AOV before you launched bundles — to see the before-and-after picture.
A worked example
Say your baseline AOV before bundles was $50 ($50,000 revenue ÷ 1,000 orders).
After launching a GWP bundle, you segment last month’s orders:
- Orders without a bundle: 800 orders, $40,000 revenue → AOV = $50
- Orders with a bundle: 200 orders, $14,000 revenue → AOV = $70
The bundle lift is $70 − $50 = $20 per order, or 40% higher than a non-bundle order.
Now the reality check. If that bundle gives a 15% discount, confirm the extra $20 in order value still leaves you with more profit per order, not just more revenue. AOV lift only counts if margin survives it.
Shopify bundle analytics: where to find the data
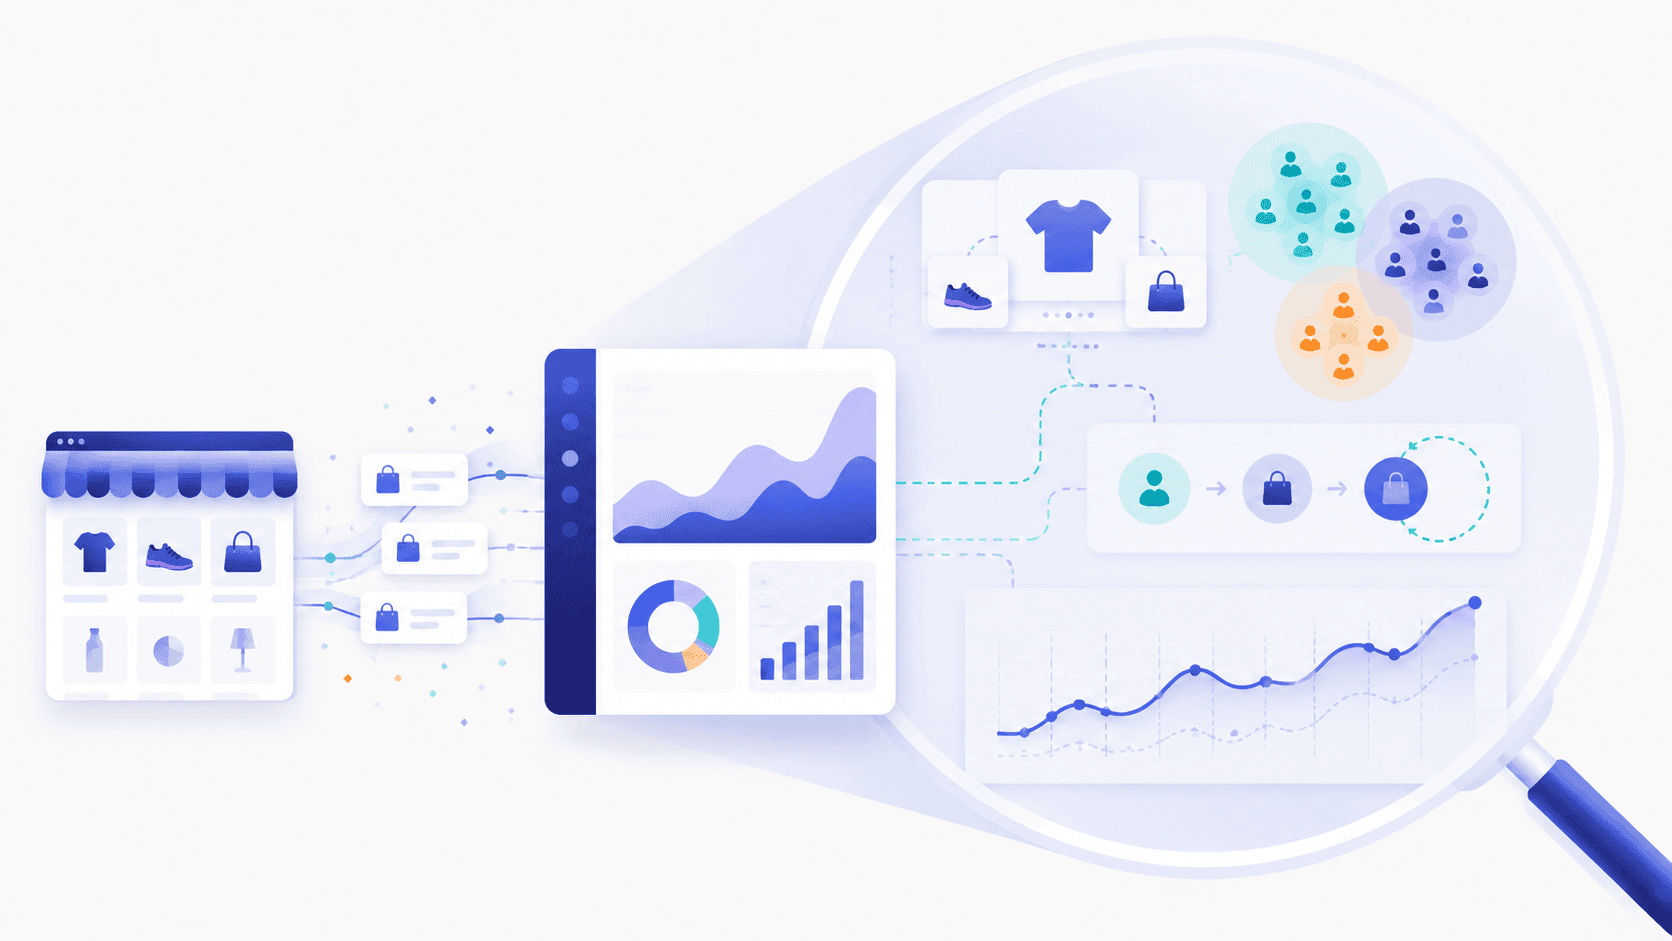
You have the numbers already — they’re just spread across different tools with different strengths. Start with what Shopify gives you, then add depth where it runs out.
What Shopify native Analytics can do
Shopify’s built-in Analytics is the right starting point, and it’s free.
- Shows your AOV and average items per order out of the box.
- Gives you an overall sales trend over time.
- Lets you establish a baseline before and after a launch.
For a quick pulse on order value, this is enough.
Where Shopify native Analytics runs out
The limits show up fast once you want to understand bundles specifically.
- It doesn’t natively treat a bundle as a unit, so separating bundle orders from non-bundle orders is manual and messy.
- Historical range and segmentation are limited, so deep before-and-after comparisons are hard.
- It won’t easily show the repeat-purchase behavior or lifetime value of the customers who bought your bundles.
In short, native Analytics tells you what your AOV is. It struggles to tell you which customers and which orders moved it, and whether those buyers came back.
Stepping up to Putler for performance tracking
When you outgrow native reports, Putler is the Shopify bundle analytics layer that fills the gaps. It connects to your Shopify store and turns raw orders into the deeper views this kind of measurement needs.
- AOV and ARPU over time — track average order value as a trend, with daily, weekly, monthly, and yearly comparisons in one view.
- Product-level analysis — see best-sellers, sale velocity, average selling price, and “frequently bought together” data that helps you design and judge bundles.
- RFM customer segmentation — Putler automatically sorts buyers into segments by recency, frequency, and monetary value, so you can see whether bundle buyers are high-value repeat customers or one-time deal-seekers.
- Repeat purchase and LTV views — the customer-behavior data native reports don’t surface, so you can tell if bundles build loyalty or just chase a discount.
Here’s how the two tools split the job:
| Tool | Best for | What it shows | Limitation |
|---|---|---|---|
| Shopify Analytics | Baseline and quick checks | AOV, average items per order, sales trend | Doesn’t isolate bundles; limited segmentation and history |
| Putler | Deep performance tracking | AOV over time, product-level analysis, RFM segments, repeat purchase / LTV | Full history and advanced views sit on higher plans; a paid add-on |
How to decide: Use Shopify Analytics to set your baseline and watch the headline number. Bring in Putler when you need to know why AOV moved, which customers drove it, and whether those customers stick around. Putler offers a free trial, so you can test the deeper reports against your own data before committing.
Step-by-step: set up bundle measurement

Follow this workflow once, and every future bundle becomes measurable.
- Define each bundle’s goal. Decide what the bundle exists to do (raise AOV, move stock, etc.). This picks your success metric.
- Record your baseline. Note your AOV, UPT, and gross margin per order before bundles go live. You can’t measure a lift without a starting point.
- Build bundles to be trackable. Create each bundle in BOGOS so its revenue, orders, and AOV impact are attributed to a specific offer from day one.
- Connect your tracking tools. Keep Shopify Analytics for the baseline, and add Putler for AOV trends, segmentation, and repeat-purchase views.
- Set a fair measurement window. Run the bundle long enough to collect meaningful order volume — a few weeks for most stores, longer for low-traffic ones.
- Segment your orders. Split the period into bundle orders and non-bundle orders so you can compare their AOV directly.
- Compare to baseline and calculate the lift. Measure with-bundle AOV against without-bundle AOV and against your pre-launch baseline. That gap is your result.
How to interpret the results
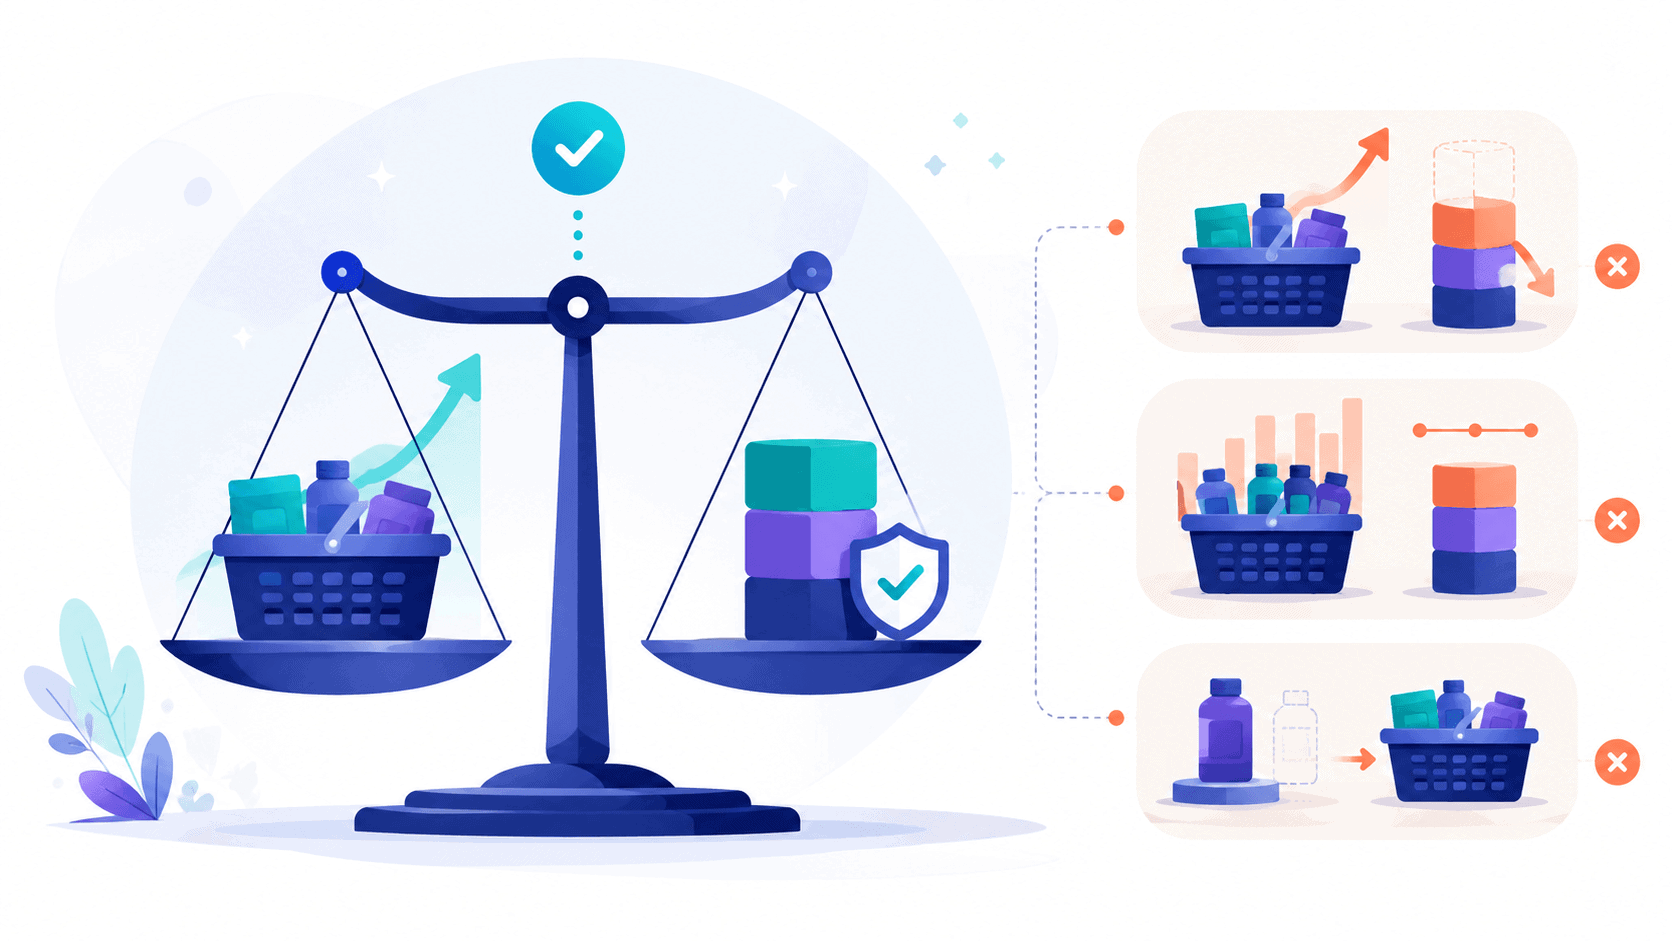
Good bundle performance is not just “AOV went up.” It’s a healthy pattern across a few metrics at once.
What “good” looks like:
- AOV on bundle orders is clearly higher than on non-bundle orders.
- Gross margin per order holds up after the discount.
- Take rate is healthy — enough customers accept the offer to matter.
Resist the urge to chase a single benchmark. AOV lift from bundles varies widely by product category and price point, so track your own direction over time rather than someone else’s fixed number.
Red-flag patterns to watch for:
- AOV up, margin down. The discount is too deep. You’re buying order value with profit.
- High take rate, flat AOV. Customers love the deal but aren’t spending more — you’re likely over-discounting.
- Rising cannibalization. Bundle sales are climbing while full-price sales of the same items fall. The lift may be borrowed, not new.
Simple decision rule: A bundle is winning when bundle-order AOV is above non-bundle AOV and margin per order is protected. If only one of those is true, you have tuning to do.
How to use the data to improve bundles
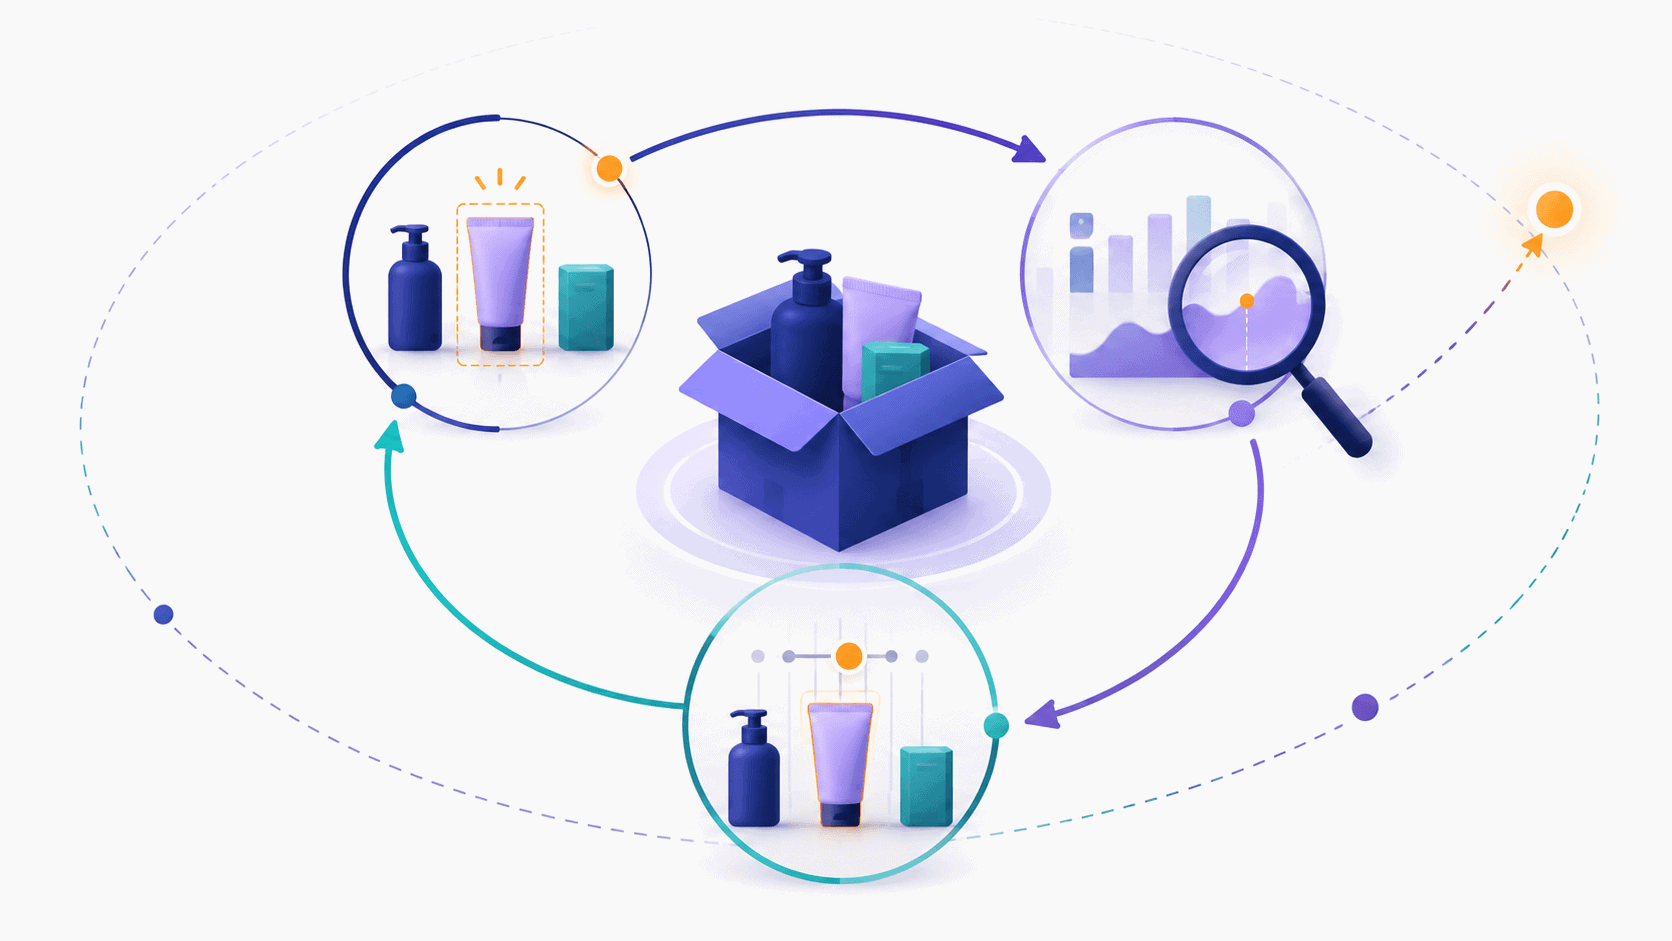
Measurement is only useful if it drives a change. Match the pattern you see to the fix.
- AOV is flat → revisit your bundle pricing, product mix, or threshold. The offer isn’t pushing customers to add value.
- Margin is eroding → reduce the discount or change what’s inside the bundle. Protect profit first.
- Take rate is low → fix visibility and placement, or improve product relevance. Customers may not see the offer, or may not want it.
- Cannibalization is high → restructure the bundle as an add-on that requires extra spend, not a swap for a purchase customers already make.
Treat every bundle as a test → measure → adjust loop. Change one thing, measure against your baseline again, and keep what works.
Common mistakes to avoid
- Watching total revenue instead of AOV. Total sales can rise while order value and margin fall.
- Ignoring margin after the discount. Revenue up, profit down is a real and common outcome.
- Skipping the baseline. Without a before number, you can’t prove a lift.
- Measuring too soon. A window too short gives you noise, not signal.
- Ignoring cannibalization. Discounting sales you’d have made anyway isn’t a win.
- Not attributing revenue to specific bundles. If you can’t tell which bundle drove the result, you can’t repeat it.
Conclusion
Good Shopify bundle analytics comes down to four moves: measure against the goal the bundle was built for, track AOV alongside margin and a few supporting metrics, use the right tools for each job, and close the loop by adjusting based on what you see.
Keep the division of labor clean. Build trackable bundles in BOGOS, watch your baseline in Shopify Analytics, and use Putler for the deeper AOV, segmentation, and repeat-purchase views that tell you why the number moved.
Start this week: record your current AOV and margin as a baseline, connect your tracking tools, and run your first with-bundle vs. without-bundle comparison. That single comparison will tell you more about your bundles than a month of watching total sales.