

Shopify Analytics is the reporting built into your Shopify admin. Start with the Analytics dashboard to see what changed, then open Analytics → Reports to find where the change came from.
A promotion can bring in more orders and still leave you with less gross profit. The dashboard shows the lift. The reports help you see how discounts, sales reversals, and product costs changed the result.
What is Shopify Analytics?
Shopify Analytics is Shopify’s built-in system for measuring store sales, traffic, and customer behavior. The overview dashboard shows key metrics in cards. Click a card’s title to open the related report, where you can break down the numbers.
To run a weekly review, open Analytics, select the date range, and turn on a comparison with an equivalent period. If last week included a holiday or a major promotion, compare with a period that makes sense for the question you’re asking. You can also change which metric cards appear on your dashboard. Shopify dashboard guide
The core features are available on every Shopify subscription plan. Individual reports and metrics can depend on your plan and sales channels, and staff need Analytics permissions. If your store uses the Online Store channel, you can also use Live View to follow activity as it happens. Shopify Analytics documentation
What are Shopify reports and how do they work?
Shopify groups reports by the business metrics they cover. Choose a category based on what you need to check.
Finance reports
Finance reports deliver your key financial information in a clear, updated format: bills and fees, total sales, payments, liabilities, and more. Each section breaks down into detailed metrics so you can see exactly where the money is moving.
Sales reports
Sales reports show what customers are buying and how much. You can analyse sales over time, per product, and by channel, which makes it easy to spot what’s selling and what isn’t.
Open a sales report and pick a breakdown that matches your question. Total sales by product helps you see which items drove a change. For a promotion, check discounts and sales reversals alongside gross sales, then use net sales to compare merchandise revenue after those adjustments. Total sales can include amounts such as shipping, taxes, and fees. Shopify sales reports
Customer reports
Use customer reports to see who bought from you, how many shoppers are returning, and what they spend. For example, compare first-time and returning customers during a promotion to see which group contributed to the lift. Shopify’s customer cohort report can also show whether shoppers who first ordered in the same period came back later.
When you’re ready to act on a group of customers, use the Shopify customer segmentation guide to build the segment.
Acquisition reports
Acquisition reports show where your traffic comes from. With metrics like sessions over time, sessions by referrer, and sessions by location, they help you understand customer acquisition, average session time, and where your visitors are based.
Behaviour reports
Behaviour reports show how customers act on your store. Using metrics like top online searches, conversion, and session duration, they surface the buying patterns and preferences behind the numbers.
That insight is directly actionable. It helps you market better, improve upsell rates, set competitive prices, raise average order value, and improve retention. Behaviour data also feeds straight into your Shopify conversion rate, showing you exactly where users drop off. To get more sales from the same traffic, start with the funnel. The guide to driving sales on Shopify picks up from there.
How to check whether a promotion helped
Compare orders and net sales first, then check gross profit. The example below uses two weeks of illustrative data, with the same store, currency, and sales channels in each period.
| Metric | Prior week | Promotion week |
|---|---|---|
| Orders | 200 | 240 |
| Gross sales | $10000 | $12000 |
| Discounts | $500 | $2000 |
| Sales reversals | $500 | $500 |
| Net sales | $9000 | $9500 |
| Product costs | $4000 | $5300 |
| Gross profit | $5000 | $4200 |
During the promotion, the store took 40 more orders and $500 more in net sales. Gross profit still fell by $800. Before repeating it, use Sales by discount codes to check the codes used in the promotion, then check Gross profit by product to see whether shoppers shifted toward items with lower margins.
Shopify calculates gross profit as net sales minus product costs. Its profit reports include items with cost recorded when they sold, so check for missing costs before comparing the totals. To judge the full cost of the promotion, also account for expenses such as ads and fulfillment. Shopify profit reports
Benefits of using Shopify Analytics for your online store
Start with two or three metrics tied to your goal. If sales fell, look at online store sessions and conversion rate before changing your prices. If you’re trying to improve repeat purchases, check first-time and returning customer reports before planning another acquisition campaign.
- Find which products and channels drove the change. Open the report behind a sales card and look at the breakdown. That helps you decide where to dig deeper in your Shopify marketing strategy.
- See where shoppers leave the funnel. Compare sessions that added to cart, reached checkout, and completed checkout. Look at the biggest change first so you can investigate the right step.
- Build a report you can reuse. Go to Analytics → Reports → New exploration, select a metric, add a date comparison or filter, and save. Merchants on all Shopify plans can create an exploration. Shopify custom reports
What are the limitations of Shopify Analytics?
Shopify reports give you a view of activity in your Shopify store. Check the metric definition, the data Shopify had when it recorded the order, and the scope of the report before comparing numbers with another tool.
- Sales and payouts measure different things. A sales report records the order and later adjustments. A payout follows the payment provider’s settlement schedule and can include fees or other adjustments. Start with the finance reports when you need to reconcile the two.
- Refunds can show up differently across reports. Shopify documents an example where a custom refund appears in the orders export but is absent from the sales report because no products were refunded and restocked. Check the order and report scope before treating that as missing money. Shopify sales discrepancies
- Session comparisons can cross a measurement change. Shopify changed session measurement in September 2026. If sessions or conversion moved around that period, check when the change reached your store before concluding that shopper behavior changed. Shopify session measurement update
- Other stores or platforms add a reporting step. If you also sell through another Shopify store or a marketplace, plan how you’ll bring those numbers together and check that you’re comparing the same dates and currencies.
For other reporting and operational problems, see our guide to common Shopify store issues.
Why add Google Analytics to Shopify Analytics?
Use Google Analytics 4 (GA4) when your question is about how visitors find and use your site. Shopify’s sales and finance reports help when the question is what was ordered, refunded, or paid out. If a campaign gets plenty of clicks but few orders, start by looking at its landing pages and purchase events in GA4, then check the order results in Shopify.
Before comparing totals, check the date range, reporting time zone, and metric definition. Consent choices and browser blocking can change what gets counted. For setup, follow the Shopify Google Analytics guide and verify that your events appear in the correct GA4 property. Shopify analytics discrepancies
Compare three Shopify Analytics tools
If you need a report Shopify and GA4 cannot provide, compare Shopify analytics apps by the job you need to do.
Glew Analytics
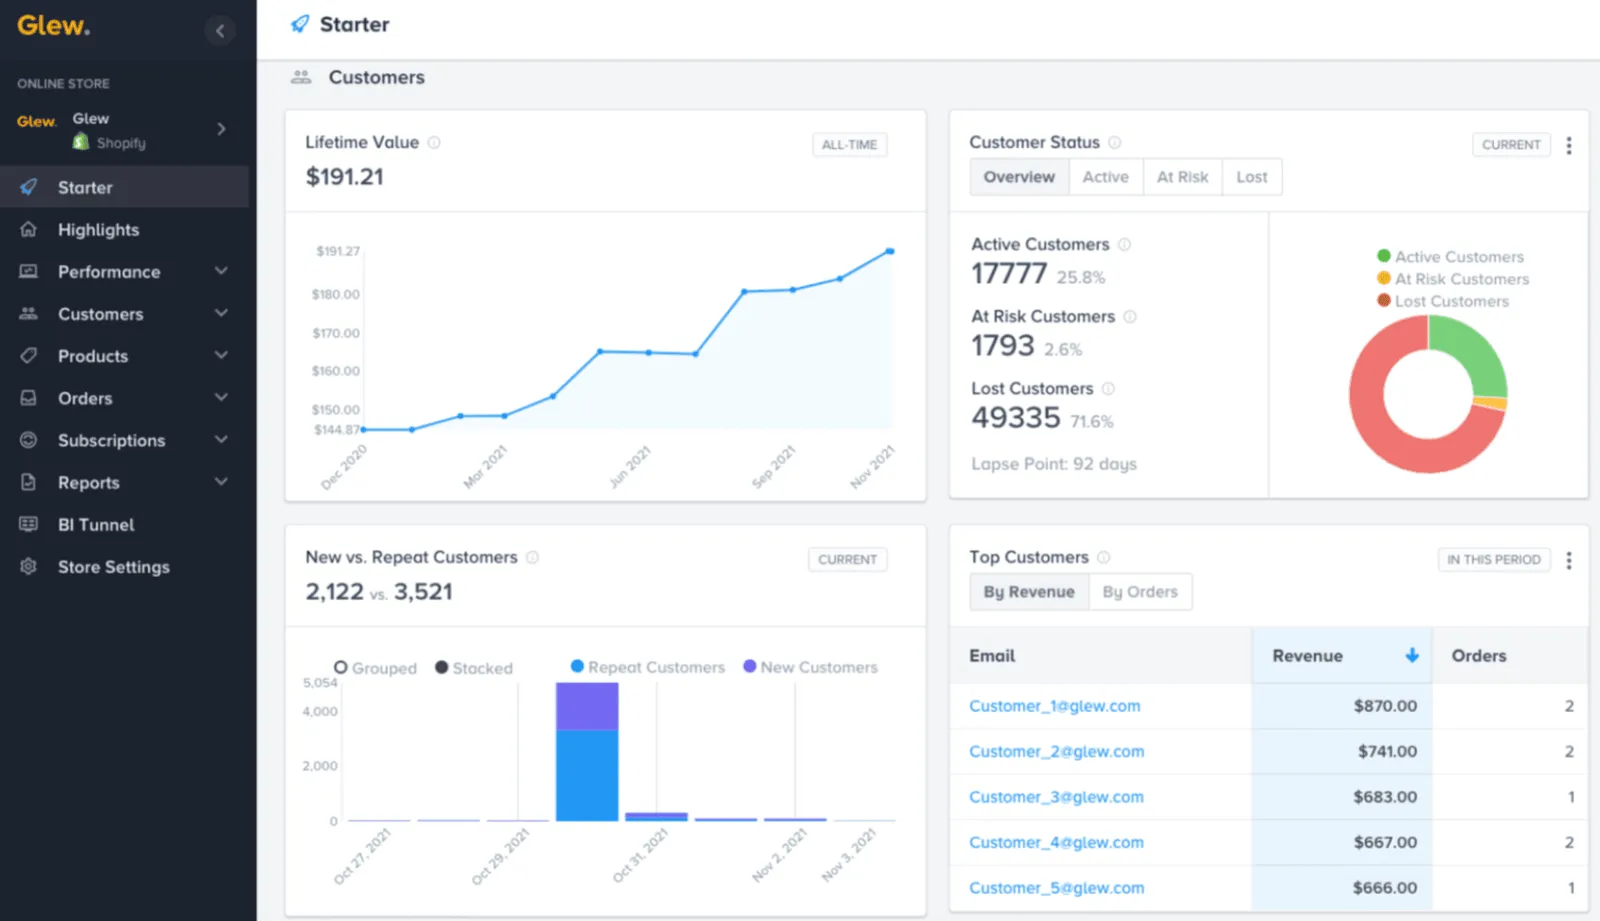
Glew brings commerce data together across connected platforms. Consider it if your team needs reports that combine store, product, and customer data. Check the current plan and which sources it covers before comparing it with your existing workflow. Glew pricing
Putler
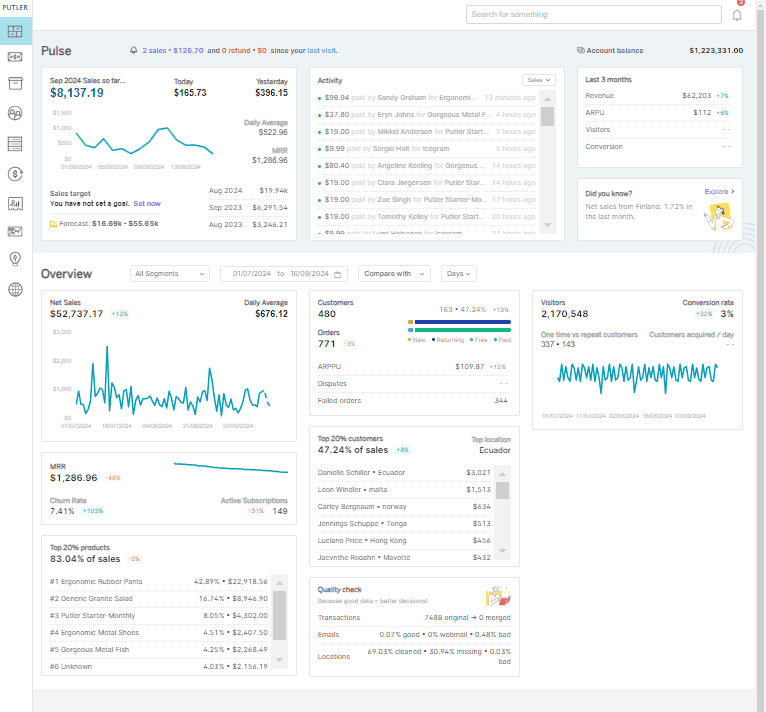
Putler, our tool, brings sales, orders, and customer data from connected sources into one place. It’s useful when you review more than one Shopify store or sell through multiple channels. You can use the combined view to see the overall change, then look at sales and products to work out which part of the business drove it. Putler’s Shopify connection guide
Yandex.Metrica Analytics
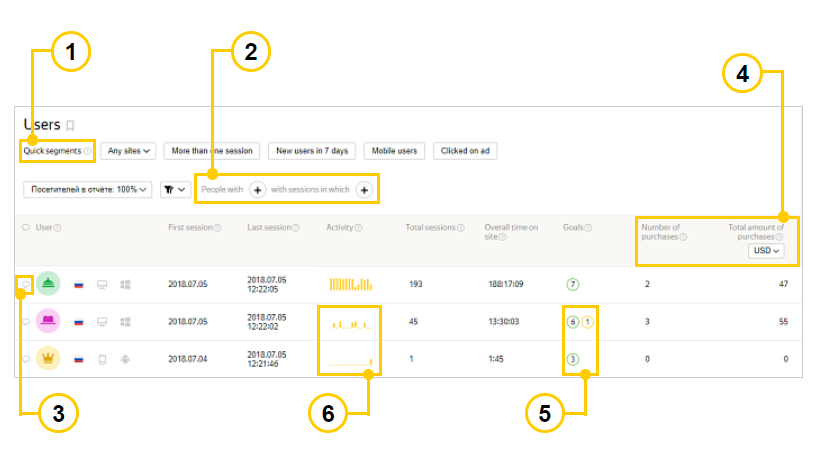
Yandex Metrica’s documentation shows the Users report. Source.
Yandex Metrica reports on website traffic and visitor behavior. Its session replay can help you investigate where shoppers struggle on a landing page or product page. Yandex Metrica documentation
Which Shopify Analytics tool fits your workflow?
Pick the tool based on the report you need to use. A team reviewing marketing traffic has a different job from one trying to combine order results across stores.
| Tool | Best fit | What to check before choosing |
|---|---|---|
| Glew | Commerce reporting across connected platforms | Which data sources and reports are included in the plan |
| Putler | Combined sales and customer reporting across connected stores | Which stores and payment sources you need to connect |
| Yandex Metrica | Website traffic and session replay | Your consent requirements and which pages you need to analyze |
Test the report you use most often with the same date range you normally review. For another look at commerce reporting, see the Glew alternative comparison.
How Putler helps you review multiple Shopify stores
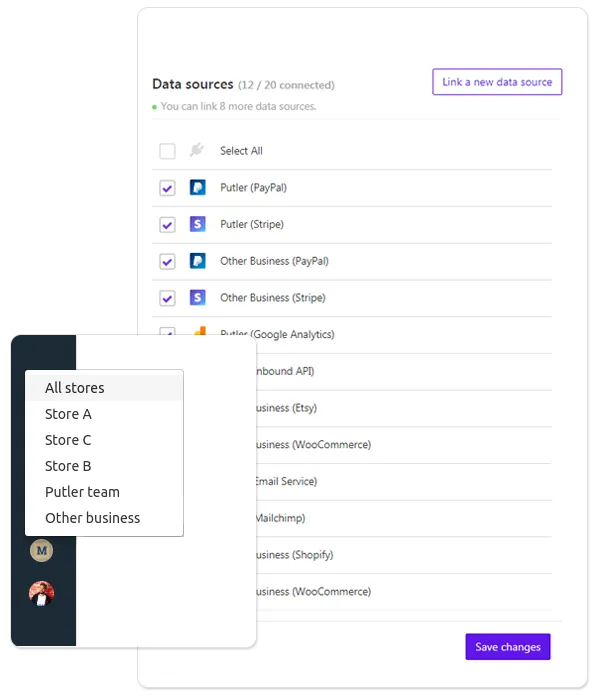
Putler’s store selector shows the combined view and individual store options.
Say you ran a promotion across two connected Shopify stores. Open the combined sales view for the promotion dates, then review each store over the same period. If one store drove most of the growth, open product reporting for that store and check which items sold. Use the store’s cost data and finance reports to judge whether the promotion helped gross profit.
For customer follow-up, use customer segmentation to group customers based on their purchase history. Putler’s RFM analysis uses how recently and often people buy and how much they spend. Putler also provides reports for supported subscription sources if you need to monitor recurring revenue alongside store sales. Putler documentation
Conclusion
For your next Shopify review, pick one question and open the report that answers it. If you’re reviewing a promotion, check orders, net sales, and gross profit together. If you’re comparing multiple stores, use the same reporting dates and currency so you can see which store drove the change.
FAQs
What are the key metrics to track in Shopify analytics?
Start with net sales, orders, online store sessions, conversion rate, and average order value. Add gross profit when you have product costs recorded, or returning customers if your goal is repeat purchases. Shopify’s analytics fields reference explains how each metric is calculated.
Can I create custom reports in Shopify?
Yes. From Shopify admin, go to Analytics → Reports → New exploration. Pick a metric, add the dimensions or filters you need, and save. Creating a custom exploration is available on all Shopify plans.
Why is there a data discrepancy between Shopify and GA4?
The two tools can define sessions differently. Reporting time zones, consent choices, and browser extensions can also affect the comparison. Start by aligning dates and time zones, then verify that the metric or event measures the same action in both tools.
How do I add Google Analytics to Shopify?
Install the Google & YouTube channel and connect your Google account. In Shopify admin, open Sales channels → Google & YouTube, start the GA4 setup, then select or create a property and click Connect. Shopify’s GA4 setup instructions
Why use Putler for Shopify stores?
Putler helps when you want to see sales, products, and customers across multiple connected stores or sources. Use Shopify’s native reports when you need to check the source order, investigate a store-specific discrepancy, or review a product’s recorded cost.
What else should Shopify store owners read?
Everything we’ve written for Shopify sellers lives here. You’ll find guides to Shopify’s own reports and their limits, exports, customer segments, GA4 setup, apps worth installing, and what to do when your Shopify sales don’t match your Stripe payouts.


Shopify analytics look complete until you ask harder questions. Here are every significant gap, what the 2025 updates did and did not fix, and how to fill what Shopify leaves out.
Shopify says $10,000. Stripe deposits $9,480. Nothing is broken. Here's exactly why your Shopify sales never match your Stripe payout and what to do about it.
Shopify and GA4 show different revenue numbers for the same store. Neither is broken. Here's why the gap exists, what each platform is actually good for, and how to use both together.

Shopify stores face many issues when it comes to reporting. Here's a list of problems that Shopify merchants face and solutions to overcome these challenges.






Unleash the power of Shopify marketing strategies to boost your store's sales. Discover how Putler's customer insights can drive remarkable growth and maximize your Shopify marketing strategy's effectiveness.

Unlock the secrets of Shopify conversion rate optimization and skyrocket your sales. Explore proven strategies, real-life case studies, and powerful tools to optimize your store's performance.

Elevate your Shopify analytics by integrating Google Analytics (GA4) with Putler. Learn how Putler can help streamline data analysis and provide better and more comprehensive reports for smarter decision-making.
Detailed guide on how to export Shopify orders from your store. Keep reading to discover advanced filters and reports.
Exporting products from Shopify is simple, yet it comes with some limitations. In this guide, we'll explore the pros, cons, and third-party tools that can enhance your Shopify product export experience.