


WooCommerce sales reports show what your store sold, which orders contributed, and how returns, discounts, taxes, and shipping affect the totals. A sales figure is not automatically profit or the amount that has reached your bank.
Start with the question behind the number. This guide explains the native reports, then shows how to read sales across connected stores in Putler and check differences before acting on them.
Where can you view WooCommerce sales reports?
The Revenue report under Analytics > Revenue shows sales, returns, coupons, taxes, and shipping for a selected period. Date comparisons and CSV exports help store operators examine changes and share the underlying rows. Other Analytics reports cover orders, products, customers, and related store activity.
Choose a date range, then select the figure you want to investigate. For example, select Gross sales to inspect its chart rather than assuming every chart shows the final sales total. The official Revenue report guide explains the view and its table.
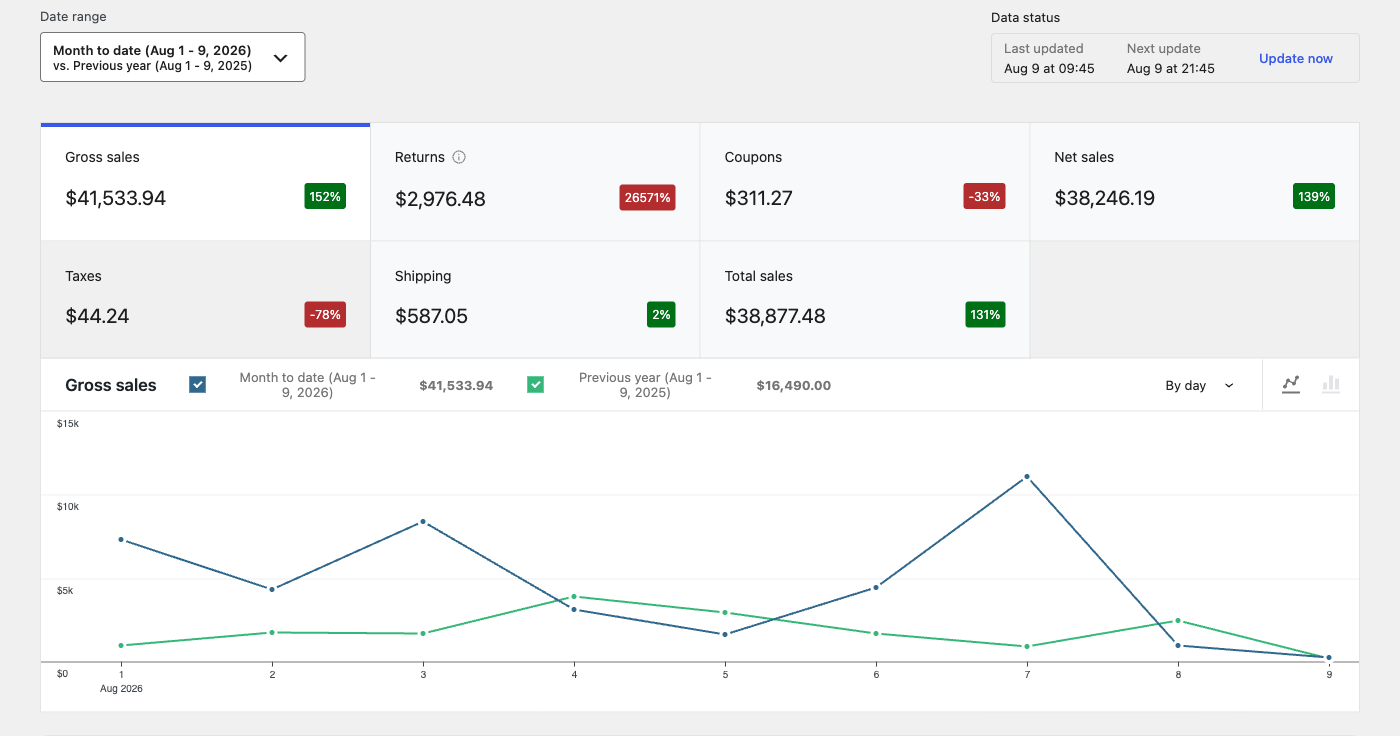
These definitions belong to native WooCommerce Analytics:
| Metric | Meaning | Check before comparing |
|---|---|---|
| Gross sales | Product sale prices multiplied by quantities | Before coupon deductions and returns; excludes tax and shipping |
| Net sales | Gross sales minus returns and coupons | Not profit or a gateway payout |
| Total sales | Net sales plus taxes and shipping | Includes amounts outside product revenue |
| Average order value | Net sales divided by orders | Match the reporting period and included orders |
See WooCommerce’s metric definitions for the calculation rules. Check the Returns, Taxes, and Shipping columns when investigating refunds; don’t treat every refunded component as one interchangeable amount.
Native Analytics already provides useful detail. Keep using it when it answers the question within one store. For broader reporting options, see the WooCommerce reporting guide; the rest of this article focuses on a connected-store workflow.
How can you read sales reports across multiple stores?
Putler brings connected store and payment-source data into a shared reporting view. A useful review starts with the intended sources and date range, then moves from a summary to the orders, products, and customers behind it. Consolidation helps when a question crosses individual store dashboards.
Connect the required WooCommerce stores and let the initial import finish before comparing totals. The WooCommerce connector guide explains the plugin and authorization flow. Check the connected status rather than assuming that entering a store URL completed the import.
For separate brands or clients, keep the source grouping clear. The guide to multiple WooCommerce stores covers that wider setup; here, review the six reporting areas below.
Check the Home overview
Start with Pulse for the current month’s sales, daily figures, recent activity, goals, and forecast. Compare periods to spot a change worth investigating, rather than treating a rise in one day’s sales as a lasting trend.
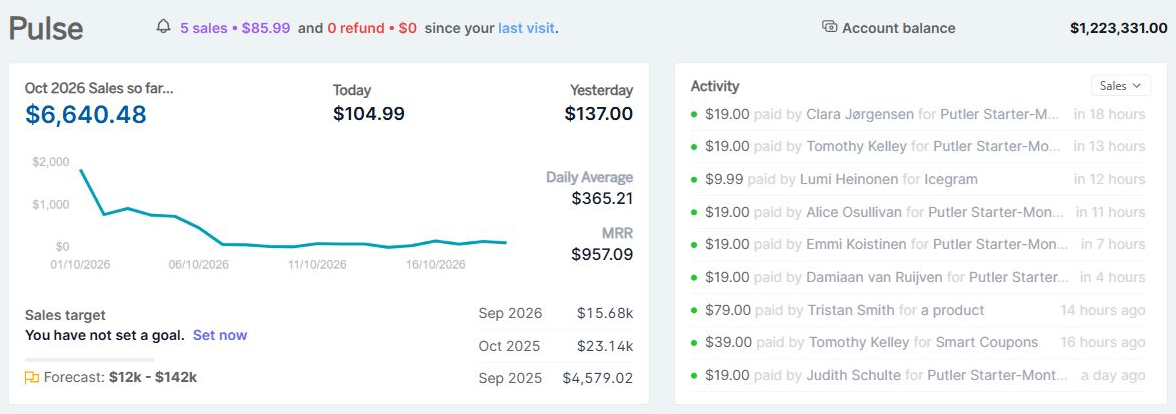
The Overview date picker controls the period shown in its reports. Check orders and customers alongside sales: fewer buyers making larger purchases calls for a different investigation from more buyers placing smaller orders.
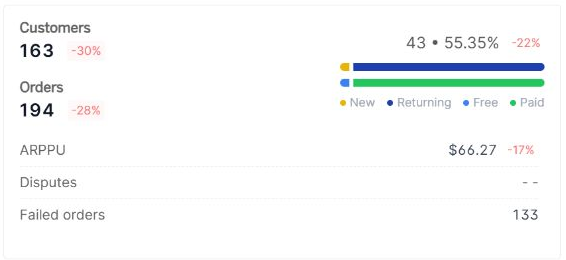
Treat the forecast as an estimate. A connected gateway’s account balance also answers a different question from store sales: it isn’t a profit calculation or confirmation of money settled into your bank.
Inspect sales and refunds
Use the Sales dashboard to examine the selected period’s sales trend, daily average, orders, and average revenue per sale. The heatmap helps identify busy ordering times; the breakdown table makes it easier to inspect individual intervals.
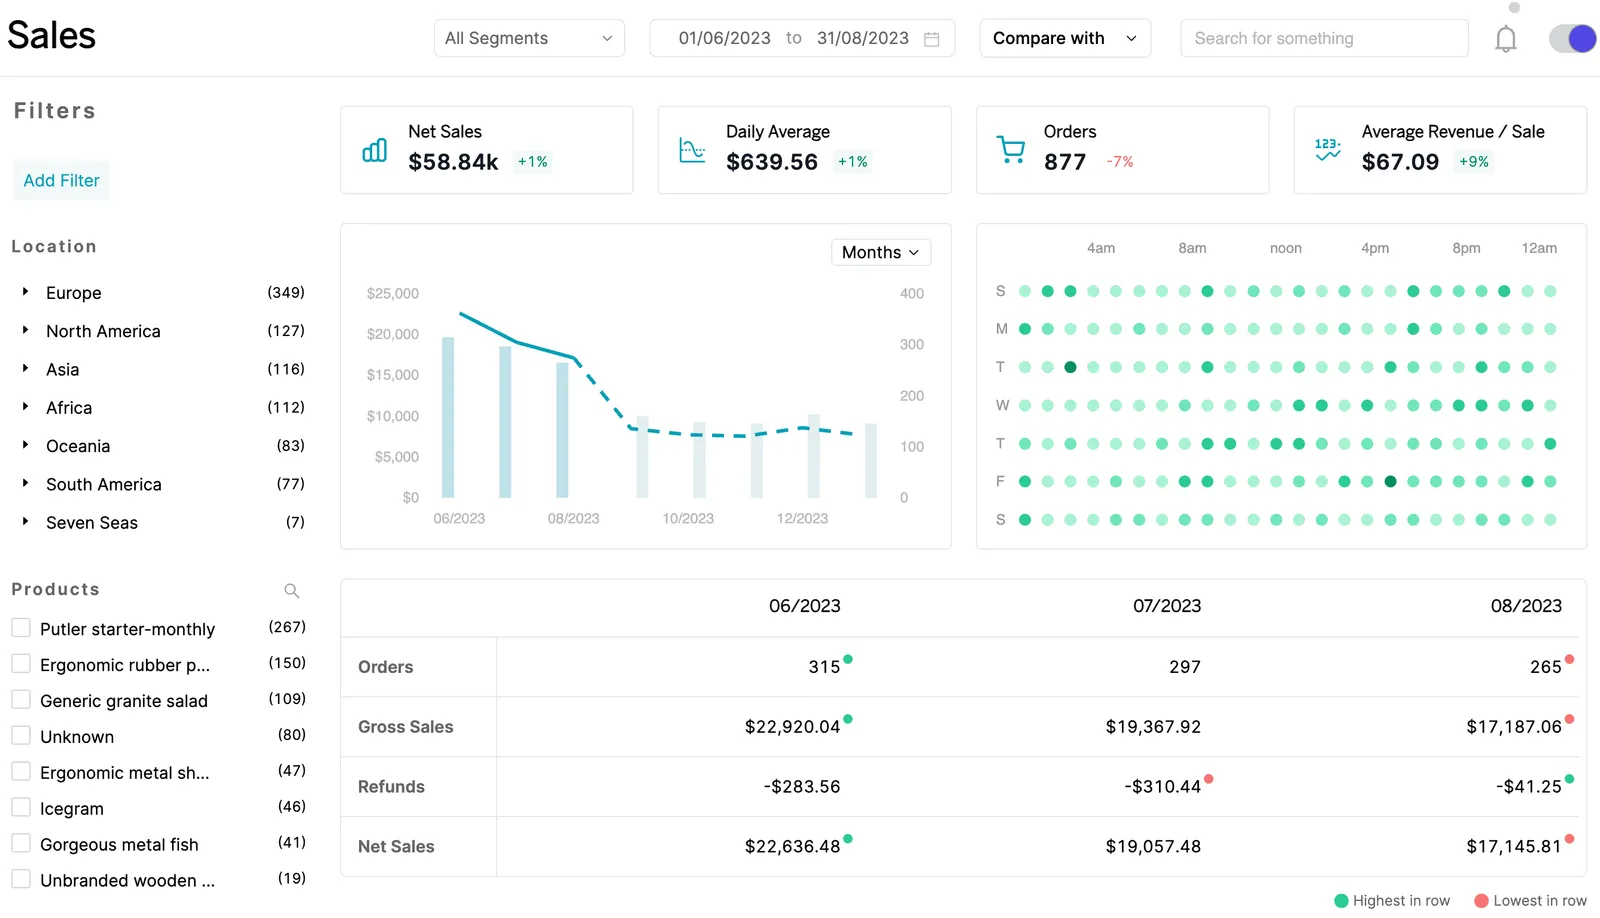
Don’t assume a field called Average Revenue / Sale uses the same calculation as WooCommerce’s AOV. Consult the Sales dashboard guide and match the revenue basis, orders, and dates before comparing the figures.
The refunds summary includes refunds processed during the selected period, including those tied to earlier sales. That need not describe the same group of orders as another sales widget. Inspect the refund and original order when explaining a difference.
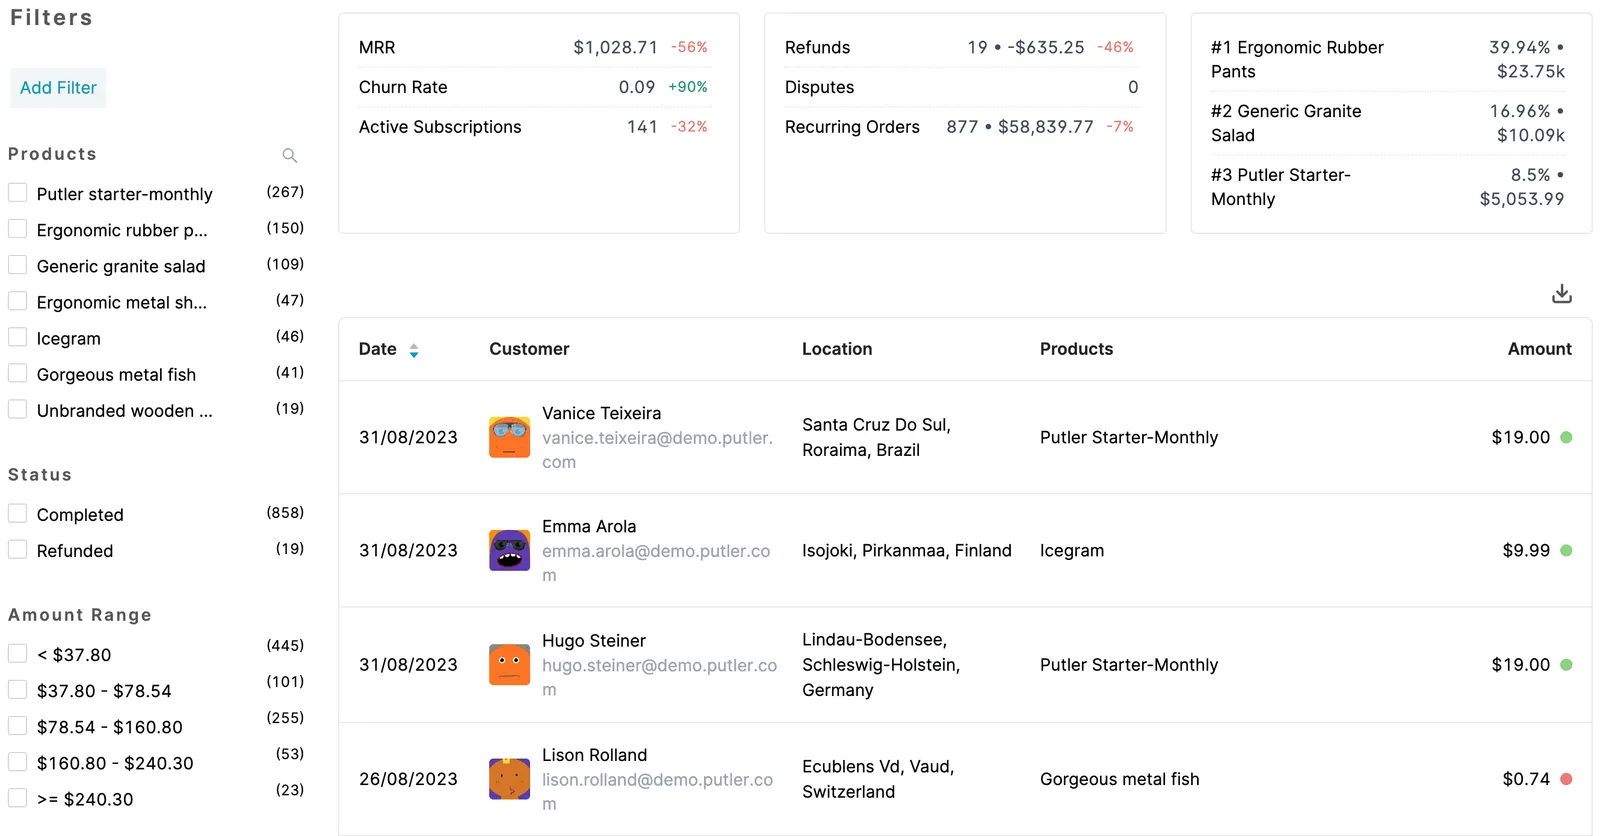
Use the buyer list and location, product, status, or amount filters to narrow the question. Export relevant rows when you need to compare records outside the dashboard.
Review subscriptions when the source supports them
Subscription reporting covers MRR, churn, active subscriptions, new subscriptions, churned subscriptions, average revenue per paying user (ARPPU), and lifetime value (LTV). Availability depends on the connected source and the subscription data it supplies; an ordinary repeat purchase is not automatically a subscription.
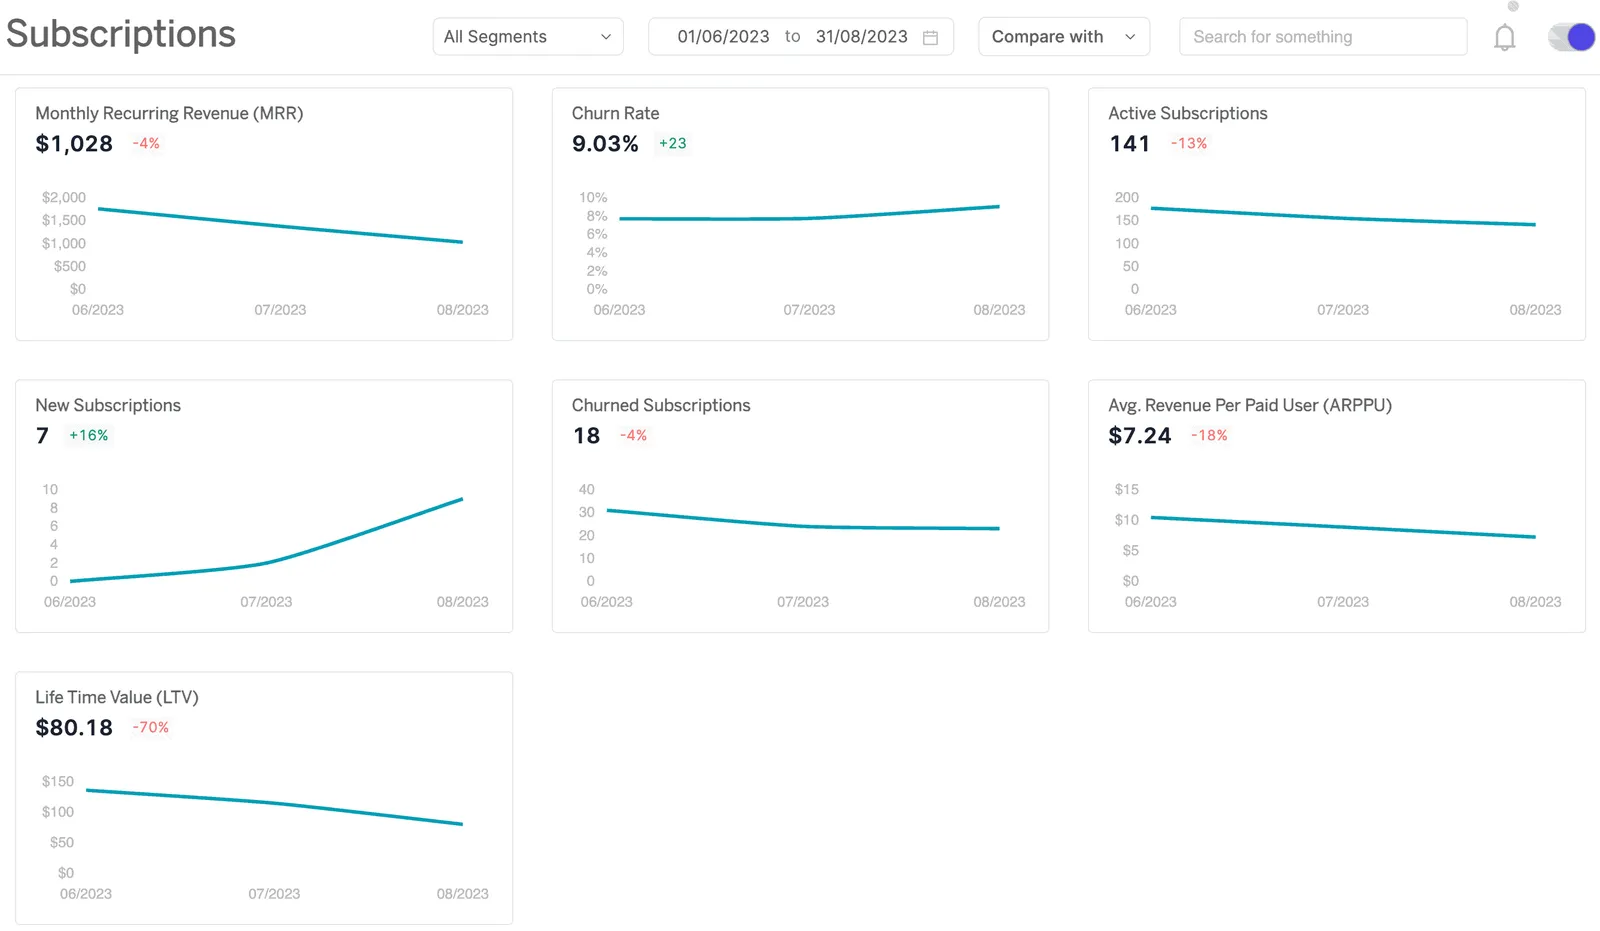
Read MRR as a monthly-normalized recurring measure, not cash collected that month. Check new, active, and churned subscriptions together to understand changes. Treat LTV as an estimate with assumptions, and use the subscription dashboard documentation for source support and metric detail.
Inspect transaction detail and filters
Open transaction details when a total needs an explanation. Review the source account, transaction identifier, date, items, and available fee or tax fields. A filtered transaction list can answer a narrower question, such as which refunded records belong to a particular location.
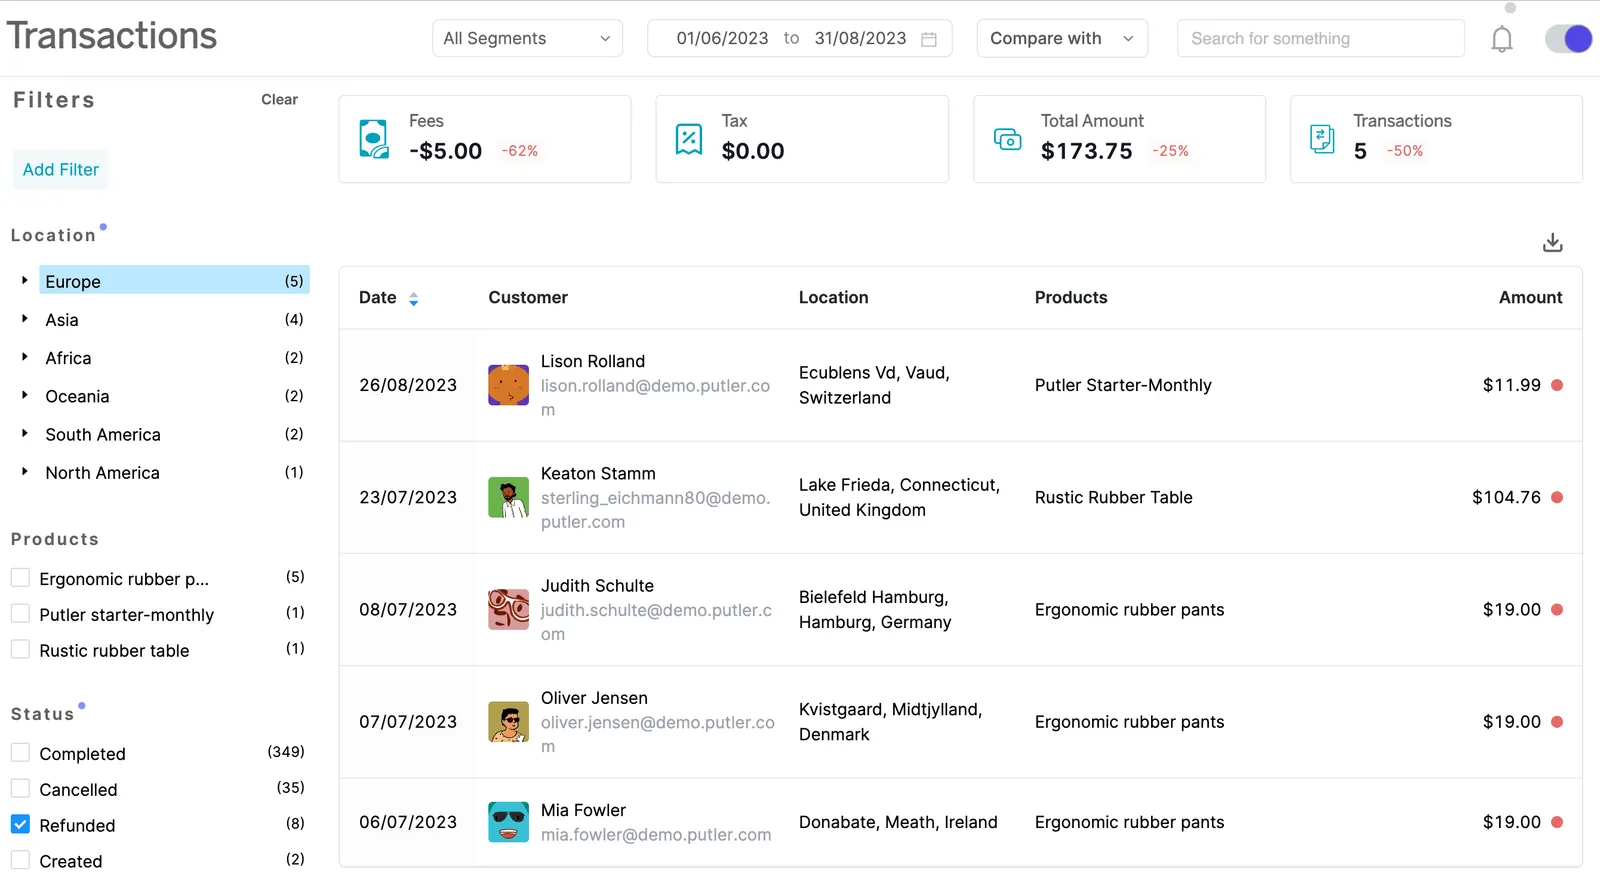
Refund actions depend on the supported transaction, connected gateway, and account permissions. Follow the refund documentation and confirm the gateway data source is connected. Viewing a refund report and issuing a refund are separate tasks.
Find the products behind sales
Review product sales, refunds, orders, and purchase history to identify what contributed to the period. Use available bought-together information to investigate purchase patterns, rather than assuming that every popular pair needs a promotion.
Check refunds alongside sales before prioritizing a product. Revenue alone doesn’t establish profitability; costs and margins require their own inputs.
Understand who is buying
Compare new and returning customers, inspect customer histories, and use segments to focus the next question. A small group of repeat buyers supporting sales suggests a different next step from broad growth in first-time customers.
The WooCommerce customer analytics guide covers customer-level analysis in more detail. Start with the relevant group instead of treating every buyer as the same audience.

Why can sales totals differ between reports?
A difference is a reason to inspect the reporting rules and underlying records before declaring either number wrong.
Sales reports can differ because they count different sources, dates, order statuses, refunds, currencies, or charges. Import timing can also leave one view behind another. A difference is a reason to inspect the reporting rules and underlying records before declaring either number wrong.
Check these five points:
- Sources: confirm which stores and gateways are included. Check how the same purchase appears across sources before summing exports.
- Dates: align the period and timezone. Check whether the report uses order creation, payment, or completion dates.
- Statuses: compare the included order states; cancelled, failed, pending, and refunded records need explicit treatment.
- Amounts: separate product sales, coupons, tax, shipping, fees, and refunds. Check whether a refund follows its processing date or the original order group.
- Freshness: confirm the initial import and recent updates have completed before comparing a new sale.
Putler’s refresh FAQ documents a 15-minute dashboard interval. That is not a promise that every source or historical import appears instantly.
In WooCommerce 10.5 and later, Analytics includes data status, Update Now, and scheduled or immediate import settings. Check those controls and the selected date type in the Analytics settings guide. Older installations can differ.
Start with one period and a checked report
Choose one date window and a clear question, such as which products explain a sales decline. Trace a sample sale and refund through the relevant reports, then investigate the largest unexplained difference.
If native Analytics answers the question, use it. When the question spans stores or payment sources, review a consolidated view with its source coverage and definitions beside it.
FAQ
Where are WooCommerce sales reports?
Open Analytics > Revenue in the WordPress admin for the current Revenue report. Select dates and a metric to inspect its trend; use the table or CSV export for details. Other Analytics reports cover orders, products, and customers. The older WooCommerce > Reports screens are legacy reports.
What is the difference between gross, net, and total sales?
In native WooCommerce Analytics, gross sales represent product sales before returns and coupons. Net sales deduct those amounts; total sales adds taxes and shipping. Average order value uses net sales divided by orders. These figures answer different questions, and none alone establishes profit or a settled bank payout.
Can you view sales reports for multiple WooCommerce stores together?
A connected reporting service such as Putler can consolidate supported store sources. Connect the intended stores, confirm the imports, and check the source grouping and reporting period. Verify that the required data is present before comparing the combined view with individual dashboards. Avoid simply adding store and gateway totals together.
Why do WooCommerce and payment-gateway totals differ?
An order-sales report and a gateway report may use different dates, statuses, currencies, refund rules, or charges. A gateway balance or payout also differs from product sales. Compare the same period and fields, then trace a matching sale and refund to find which difference explains the totals.