Black Friday and Cyber Monday (BFCM) have come to an end, and what a season it’s been. For many of us, this period has doubled or even tripled sales and engagement, a true high point in the eCommerce calendar.
But here’s what I’ve noticed over the years, once the sale rush ends, most store owners move on too quickly. They celebrate the numbers but overlook something even more valuable, the post-BFCM performance analysis.
This is where the real growth happens. The insights you uncover now can guide your marketing, inventory, and customer strategies for the entire year ahead.
In this guide, I’ll walk you through how to turn your BFCM data into smarter decisions and long-term success.
The big mistake marketers make: Neglecting BFCM deal evaluation
Most marketers (I was once in this category too!) are high on happiness. They are just way too glad to see the profits that BFCM has brought in that they forget to see the strategic importance of it.
The mistake they do is, ‘THEY DON’T EVALUATE THEIR BFCM DEALS’

The usual reasons are:
- “It feels like too much manual work.”
- “I have to log in to different tools.”
- “I have to pull in data from multiple people”
- “Too time-consuming.”
If you relate to any of these, rest assured. Putler can simplify the entire process and eliminate all your pain points.
How does Putler simplify BFCM strategy analysis?
Quick, Accurate, and Effortless.
We understand that you’ve hustled during the BFCM sale. So Putler tries to make the evaluation phase really simple.
It quickly answers all the BFCM tactic evaluation questions within a few clicks.
Let’s break it down.
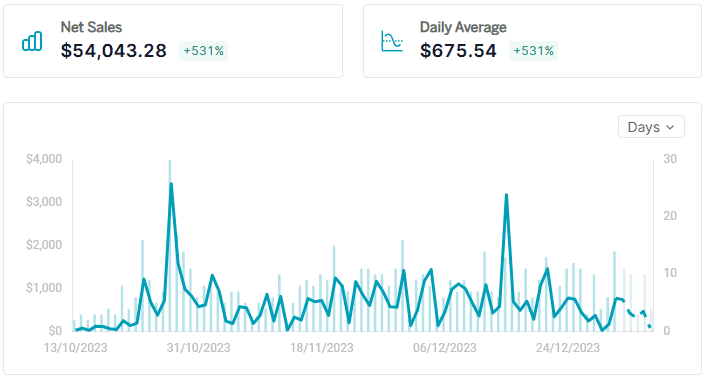
Revenue analysis: Total earnings at a glance
Once the sale is over, the first thing you want to know is—how much revenue did I make?
Instead of logging into multiple platforms like PayPal, Stripe, WooCommerce, etc., you can see your BFCM performance in one place with Putler.
- Log in to your Putler account.
- Set the date range according to your deal period.
- Go to the Sales Dashboard and have all the revenue mentioned there datewise.
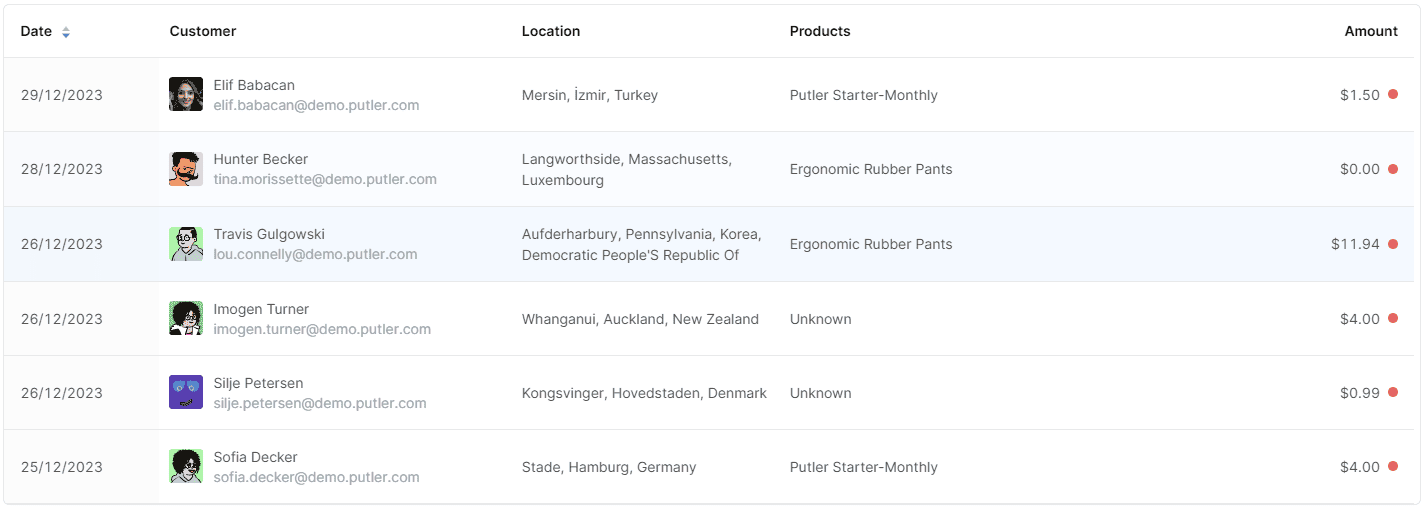
Refunds: Transforming feedback into growth opportunities
Where there are sales, there are refunds. That’s the universal truth.
But what if I tell you, Putler can turn it around?
Yes, instead of sulking on the refunds. We suggest you try gaining some valuable feedback from it. Here’s how.
- Set your date range according to your deal period.
- Go to the Sales or Transactions Dashboard.
- In Predefined Filters (Facets), click on “Refunded”.
- Identify all refunds and export customer data to send personalized emails asking for feedback.
This can turn a negative experience into a chance for improvement.
You can email either directly from within Putler or export a CSV of these customers from Putler and then send them an email from your ESP.
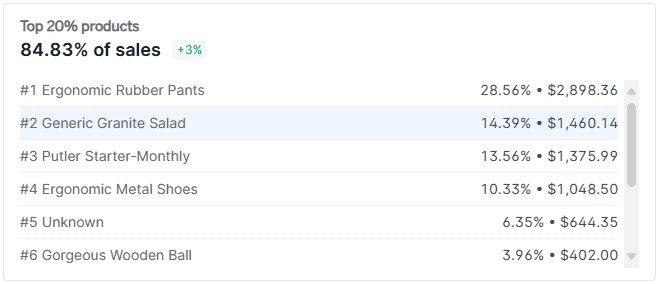
Top-performing products: Know your customers
Finding which was the money-making product of your BFCM is important.
Using Putler, you can see the top products that bring in 80% of your revenue.
Here is how to find top products:
- Go to the Home Dashboard in Putler.
- Check the Product leaderboard to see your top best-selling items and the quantities sold.
It gives you the top products, the quantity sold, and trending products.
Traffic insights: where did visitors come from?
Indeed, you have explored multiple channels to boost your funnel.
So, did you look at the actual numbers and refine your strategy?
How much traffic did you generate?
True story: I used to find the traffic from GA. But for some reason, the interface is so tricky. It took me so much time to navigate and get to the numbers. Putler makes it easy-peasy.
To track traffic with Putler:
- Login into Putler.
- Access the Holiday Season section.
- Use the comparison drop-down to view traffic trends between current and previous years.
You will see a visitor comparison for both the years for holiday as well as non-season periods.
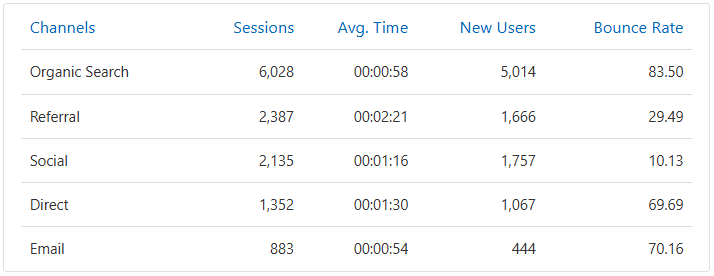
High-performing promotional channels
Owners promoting their BFCM deals on various services social media, blogs, emails, newsletters, ads, etc., can be overwhelming.
Every channel works differently for different businesses. So it’s important to know which channel works for your business and which doesn’t. This will help you invest wisely in the future.
Actionable insights from Putler:
- Go to the Audience Dashboard.
- Set your date range and find out which channels delivered the best results.
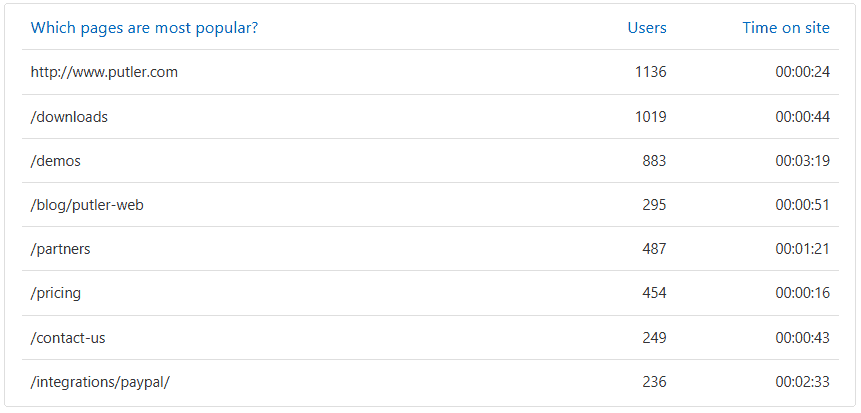
Most visited page: Was it the homepage?
The most visited page during BFCM might surprise you. Often, it’s not the homepage but a specific product or landing page. Knowing this can help tailor future campaigns.
Here’s how to find out your most visited page:
- Log in to Putler.
- Go to the Audience Dashboard.
- Set the date range according to your deal period.
And see which page was the most popular during this period.
Compare business units/brands/shops
If you run multiple stores or brands, Putler makes it easy to compare their BFCM performance.
How to compare business units in Putler:
- Log in to Putler.
- Go to the Insights dashboard.
- Select Performance Comparison Report.
- Select your Shop-1 and the deal period.
- Select Shop-2 and deal period.
- Click on Compare.
Within seconds, you will get a complete one-on-one analysis of the entire BFCM period, including visitors, revenue, refunds and so much more.
Require your minimal efforts!
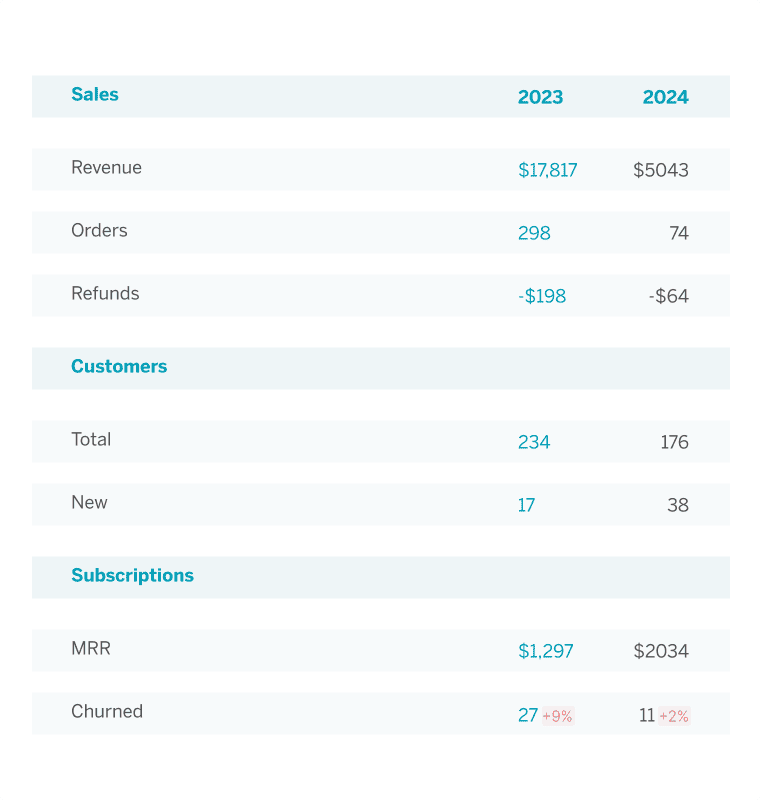
BFCM performance comparison (over the years)
Wondering if this year’s BFCM strategy was better than the last? Putler can quickly compare your BFCM results year over year, helping you understand long-term trends.
Here’s how:
- Log in to Putler.
- Go to the Insights Dashboard.
- Select Holiday Season Report.
- Select the Year 1 v/s Year 2 option.
You get all the stats in one place, in a single click, in one sec. Cool?
New vs Returning customers
It’s important to not only know how much traffic you received but also who made those purchases.
Were they new customers or returning ones?
You can easily find this in the Putler dashboard.
Here’s how-
- Log in to Putler.
- Open Putler Marco Polo.
- Go to the Customers Dashboard.
- Set the date range as per the sale period.
- View the New and Returning customers.
Top revenue generating country
Curious about which country contributed the most to your sales?
With Putler, you can quickly pinpoint your top-performing regions and capitalize on them.
Here’s how,
- Log in to Putler.
- Open Putler Marco Polo.
- Go to the Sales Dashboard.
- Click on the first country you see in the Country Facet.
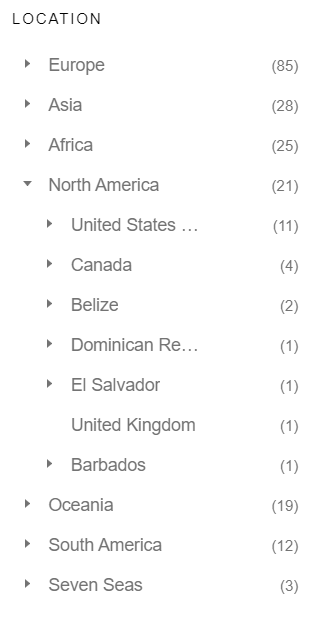
All customers of that country get loaded down. You can then export this list and send them milk it further.
Say create a time-limited country-specific coupon and email it to them. Inform them since USA was the top buying country this is a special discount for them.
They can use it for buying something new or continuing their subscription. *Just an idea. You can customize it the way you wish to*
Over to you
Make time for this BFCM review and evaluation. I’m sure the things you learn and unravel will be an eye-opener. Not just BFCM 2025 but all the marketing campaigns from here on.
To make things organized, I’m sharing a Google Sheet with you. Download it and fill it out when you evaluate your BFCM marketing performance.

Ready to analyze your BFCM performance?
With Putler, you can easily track and optimize your results, helping you prepare for even better future BFCM campaigns.
FAQs
Q1: What does BFCM stand for?
BFCM stands for Black Friday Cyber Monday, the four-day mega shopping event that starts on the Friday after Thanksgiving and ends on the following Monday.
For eCommerce stores, BFCM isn’t just a weekend—it’s the most data-rich period of the year.
It helps businesses understand buyer behavior, campaign performance, and revenue patterns at scale.
Q2: What does BFCM mean in marketing?
In marketing, BFCM refers to the high-intensity promotional period surrounding Black Friday and Cyber Monday
when brands compete for attention through limited-time deals, ads, and personalized offers.
It’s more than just discounting — it’s a data-driven marketing sprint.
Q3: How to prepare your store for Black Friday?
Preparing your store for Black Friday isn’t only about launching discounts — it’s about optimizing the entire experience
and backing every move with data. Here’s how to get BFCM-ready:
- Analyze last year’s performance: Identify best-selling products, profitable customer segments, and sales peaks using your analytics tool.
- Set realistic goals: Define clear revenue and order targets based on past trends.
- Optimize your website: Ensure it loads fast, is mobile-friendly, and your checkout flow is frictionless.
- Plan segmented campaigns: Send tailored offers to loyal customers, high-value buyers, or at-risk churners.
- Track performance in real-time: Use analytics tools (like Putler) to monitor sales, product trends, and revenue spikes live.
- Prepare post-sale insights: After BFCM, review what worked, what didn’t, and which campaigns had the best ROI.
Smart preparation backed by solid analytics ensures you don’t just make more sales during BFCM — you make smarter, more sustainable business decisions.