


The five Databox alternatives worth comparing for ecommerce reporting are Putler, Triple Whale, Glew, Metorik, and Polar Analytics. Start with Putler for consolidated sales and customer reporting, Triple Whale for marketing measurement, Glew or Polar for commerce business intelligence, and Metorik for WooCommerce or Shopify store analytics.
The choice starts with the report you can’t get today. A tool that answers which ads bring customers has a different job from one that combines sales across stores and payment accounts.
This guide focuses on ecommerce sellers. Putler publishes it and is included in the shortlist. The comparison uses official product and pricing documentation checked on 30 October 2026, rather than hands-on testing of every platform.
Compare five Databox alternatives at a glance
These five Databox alternatives cover different reporting jobs. The table gives you a shortlist; the sections below explain the limits that can change the decision.
| Tool | Main reporting job | Connection scope | Cost basis |
|---|---|---|---|
| Putler | Combined sales and customer reporting | Stores, marketplaces, payment accounts, and custom sources via API | From $20/month up to $10K monthly revenue |
| Triple Whale | Marketing measurement and commerce analytics | Shopify, WooCommerce, BigCommerce, and supported marketplaces | Free plan; contact sales for paid pricing |
| Glew | Commerce BI and custom reporting | Confirm required integrations and tier | Pro $250/month with annual prepayment; Plus custom |
| Metorik | Store analytics and email automation | WooCommerce or Shopify; separate platform subscriptions | From $25/month; order volume and store limits apply |
| Polar Analytics | Commerce BI and attribution | Shopify and Amazon among documented sources; custom connections vary | Confirm current package and add-ons |
Starting prices aren’t equivalent packages. An entry plan for one store won’t necessarily replace the reports, accounts, and sharing features in your current setup.
When does switching from Databox make sense?
Switch when another tool can deliver a specific report or workflow with less setup or a better total cost. Keep Databox when its connected dashboards, custom metrics, and reporting already answer the questions your team needs.
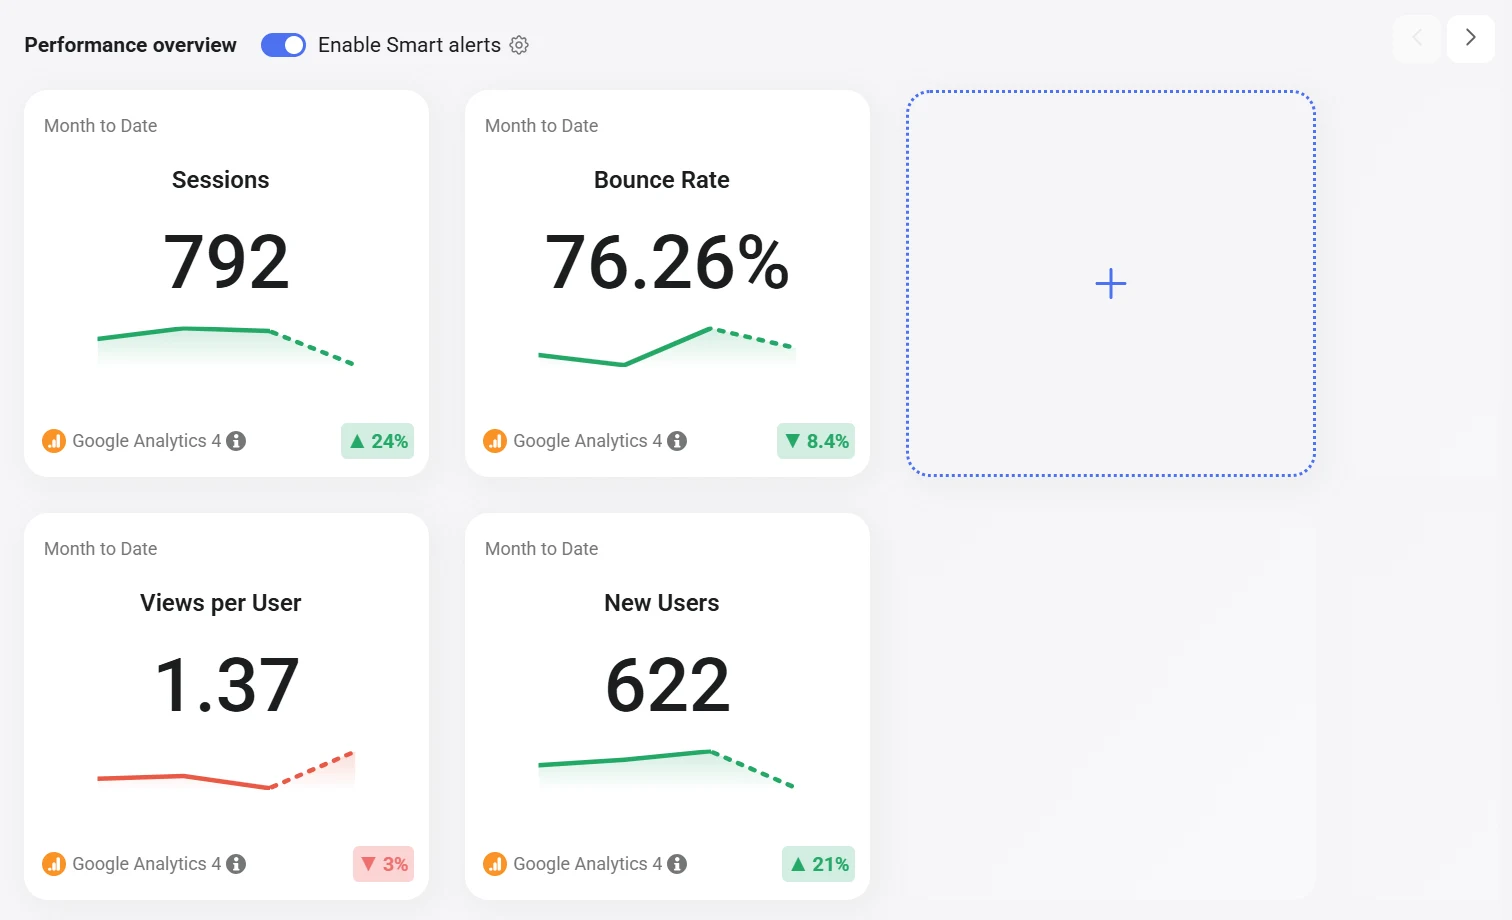
Databox does more than display untouched numbers. Its dataset documentation describes combining data from different integrations through matching fields, with availability depending on the subscription.
Configured data joins and automatic transaction reconciliation are different tasks. If the same sale reaches a reporting system through a storefront and a payment processor, check how your report handles those related records. Connecting both accounts doesn’t tell you how the final number was calculated.
The current Databox plan documentation distinguishes Free, Analyst, Team, Agency, and Custom options from legacy plans. Compare a replacement against the price and allowances that actually apply to your account.
A specialist becomes useful when you want ready-made customer, product, or cross-platform revenue reporting. For broader discovery, compare the jobs covered by ecommerce analytics tools before adding another subscription.
1. Putler: consolidated revenue and customer reporting
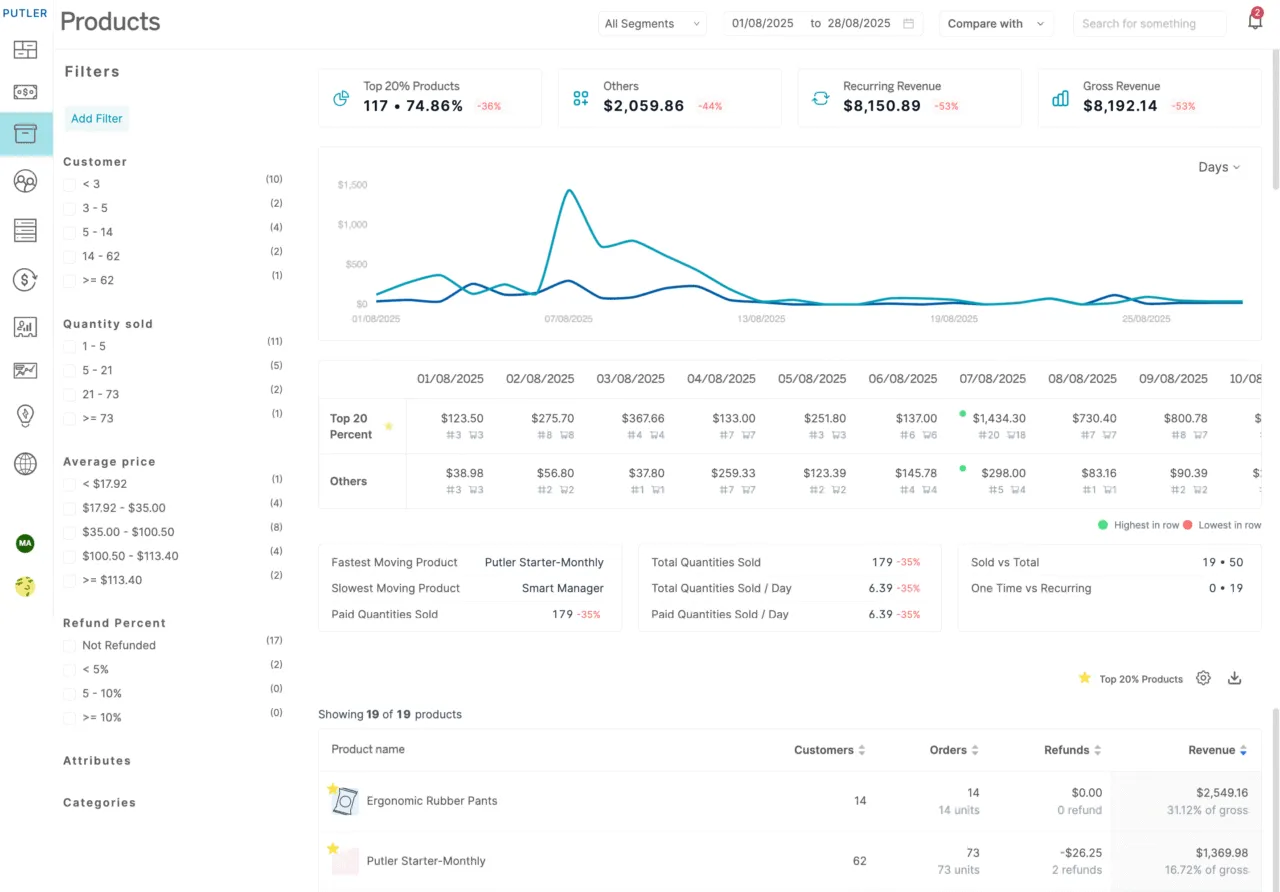
Putler brings supported store, marketplace, and payment-account data together for sales, customer, product, and subscription reporting. It fits sellers who need a view across several connected sources rather than a separate dashboard for each account.
What it helps you do
Data consolidation and deduplication are central to Putler’s approach. Its feature documentation describes cleaning and merging source records, handling currency and timezone differences, and combining customer and product information.
That helps you examine which products drive revenue, which customers return, and how recurring sales contribute to the business. RFM segmentation groups customers by how recently, how often, and how much they buy. Customer lifetime value and subscription analytics add context beyond one month’s sales.
For a recurring-revenue business, compare monthly recurring revenue, annual recurring revenue, and churn using consistent definitions. A combined sales total doesn’t answer all three questions.
Connections and limits
The published integration list includes Shopify, WooCommerce, Etsy, Amazon, eBay, PayPal, and Stripe. Match your actual accounts to the supported connections, then check a few orders and refunds during the trial.
Other sources can send sales, customer, and transaction data through Putler’s Inbound API. This supports custom connections, including a custom store or point-of-sale system, with setup work to send data in Putler’s required format.
Combined sales reporting doesn’t replace an accounting ledger or prove that sales should equal bank payouts. Refund actions also depend on supported transactions and connections; importing marketplace data doesn’t establish that you can manage every order from Putler.
What it costs
Putler pricing starts at $20/month for up to $10K in monthly revenue. The next published brackets are $50 for $10K-$30K and $100 for $30K-$50K, with billing adjusting to revenue.
The trial lasts 14 days and doesn’t require a credit card. Compare the bracket your business would use rather than treating the entry price as a fixed cost at every revenue level.
2. Triple Whale: marketing measurement across commerce channels
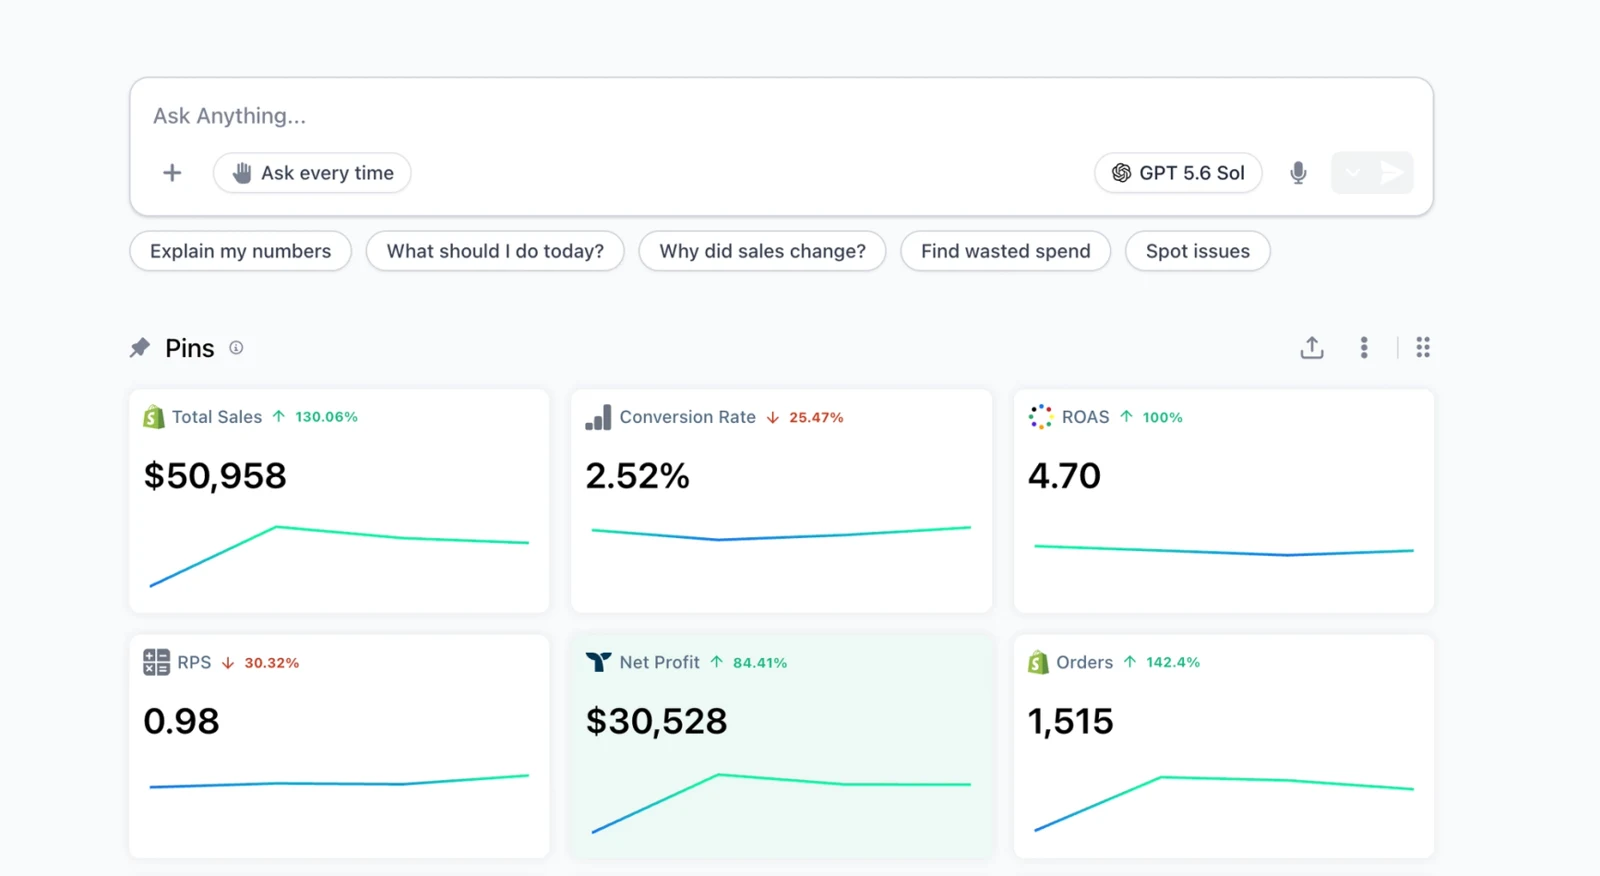
Triple Whale combines commerce data with marketing measurement, attribution, and reporting. Shortlist it when your main question is which marketing activity contributes to sales and where to change spending.
What it helps you do
The platform offers attribution, custom dashboards, customer reporting, and Moby AI, with features varying by package. Its Amazon documentation also explains entering product costs and handling fees for profitability analysis.
Those cost inputs matter: a sales figure can’t tell you the full margin on an order when important costs are missing. See our Triple Whale review for a fuller view of its reporting approach.
Connections and limits
Triple Whale isn’t Shopify-only. Its integration directory lists WooCommerce, BigCommerce, custom commerce platforms, and marketplace connections alongside Shopify.
For Amazon, sales and advertising use separate connections. Seller Central sales, Amazon Ads, and Vendor Central data serve different reporting needs, so confirm the connection and regional coverage you require. An advertising connection may not import marketplace sales.
What it costs
The current pricing page offers Free, Foundation, Automate, and Enterprise packages. Contact sales for current paid pricing; the page checked for this comparison didn’t provide a reliable paid entry amount.
Ask which attribution, reporting, and data features are included in the quote. Check the free plan’s limits before relying on a feature listed elsewhere on the site.
3. Glew: commerce BI and custom reporting
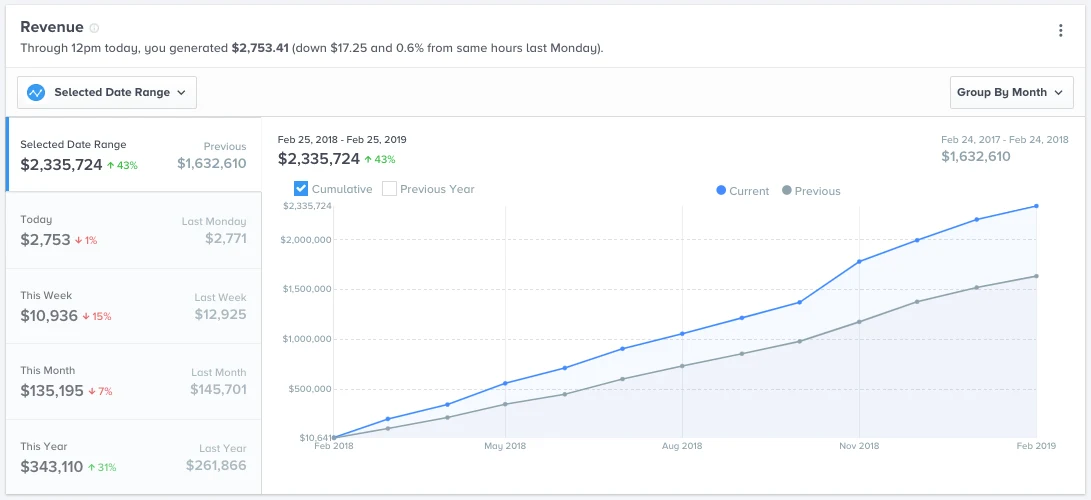
Glew provides customer, product, and financial reporting, with a managed data stack available on its higher offering. Business intelligence, or BI, means using connected business data to build reports and answer operating questions.
What it helps you do
Glew Pro’s published features include customer segments, lifetime value, net profit, and product reporting. Glew Plus adds a managed data pipeline, warehouse, and Looker-based custom reporting.
That distinction matters if your team needs reports beyond the standard dashboards. Match the report to the right tier; Pro and Plus include different reporting tools and services. Our Glew review covers the product in more detail.
Connections and limits
Confirm each required commerce, marketing, and operational source with Glew, including its plan availability. Its materials describe different integration coverage across offerings, so a headline integration count isn’t a substitute for checking your stack.
For custom reporting, ask who maintains the data model and resolves source changes. Include that work in the decision if nobody on your team wants to become the reporting administrator.
What it costs
Glew Pro is listed at $250/month and requires annual prepayment. Glew Plus uses custom pricing.
The annual commitment deserves attention alongside the monthly figure. Confirm the sources, support, and reporting work included before comparing its cost with a monthly subscription.
4. Metorik: store analytics and email automation
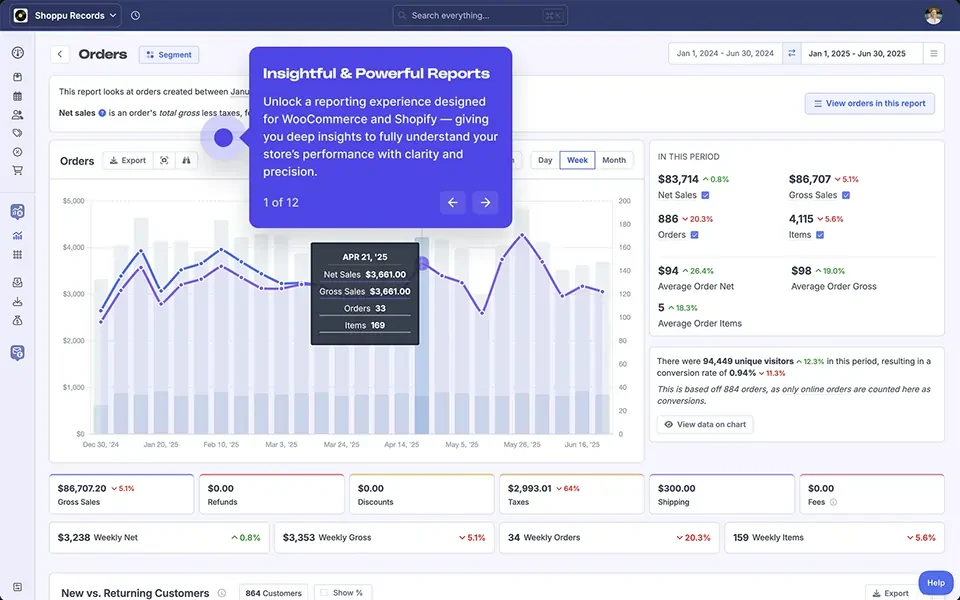
Metorik focuses on WooCommerce and Shopify reporting, with costs and profit analysis, segmentation, exports, and email automation. Consider it when you want deeper store reports and actions based on customer or order data.
What it helps you do
The feature offering combines reporting with saved segments, scheduled exports, and automated emails. That can help a team move from finding a customer group to acting on it within the same product.
Define any marketplace or payment-account reporting needs separately rather than assuming a store connection covers every sales channel. See our Metorik review for more detail.
Connections and limits
Multiple stores can share a subscription, but platform grouping matters. The billing documentation says active WooCommerce and Shopify stores cannot be mixed within one subscription.
Store caps apply to each level. Several small stores may need a different level from one store with the same order volume.
What it costs
Pricing starts at $25/month for up to 100 monthly orders and one store. The next level covers 100-500 orders and up to five stores for $75/month; 500-2,000 orders and up to ten stores is $150/month.
Metorik uses average order volume over the last three months and the store count. Plans include an email allowance, with extra email packs available. You can try Metorik free for 30 days without a credit card.
5. Polar Analytics: commerce BI and attribution
Polar Analytics brings commerce data, dashboards, attribution, and reporting into a shared data platform. It suits teams evaluating a broader BI and marketing-measurement setup rather than a replacement for one basic dashboard.
What it helps you do
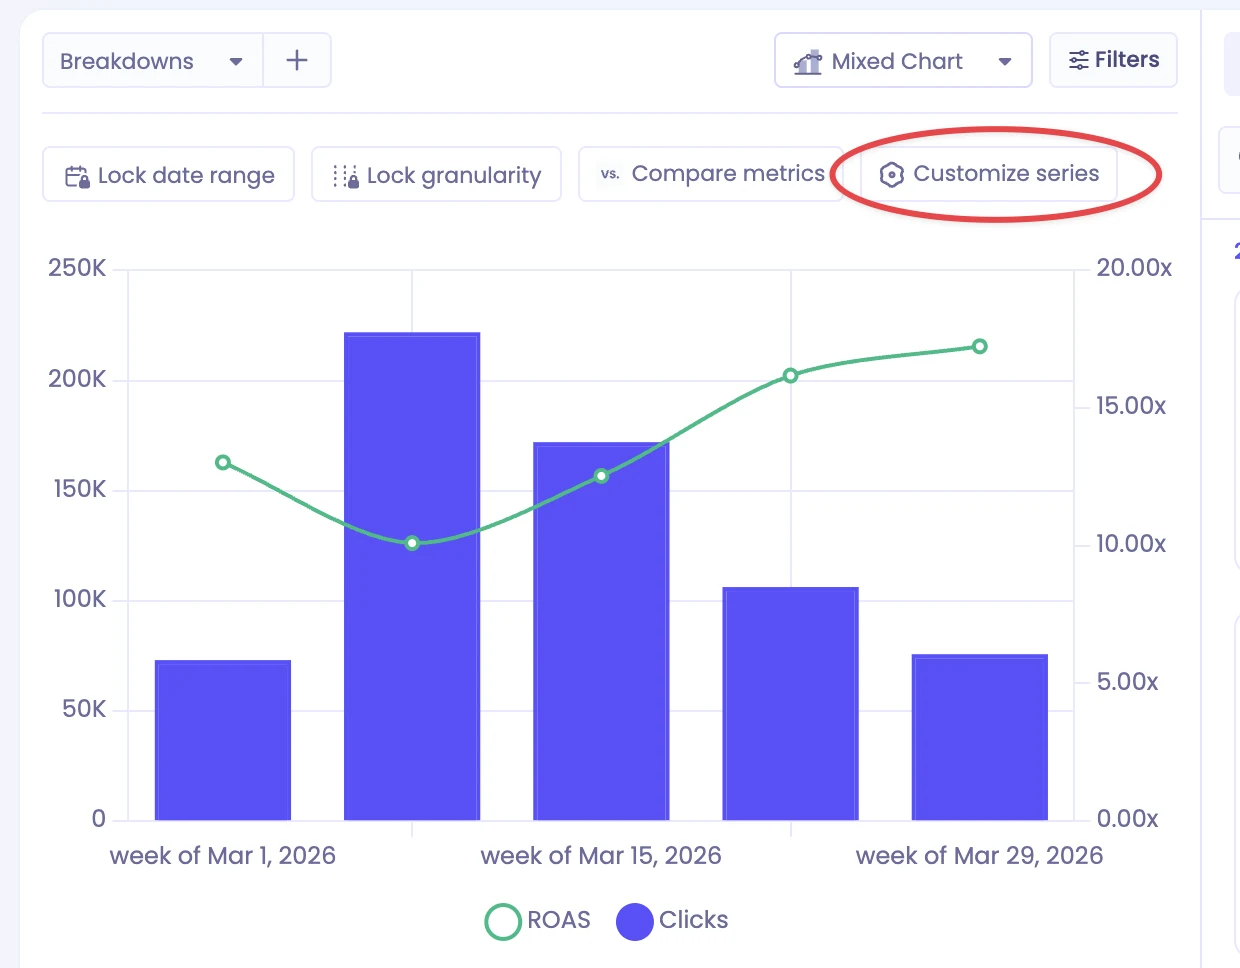
Its current plan page describes business intelligence, custom reports, multi-touch attribution, Ask Polar, alerts, and scheduled reporting. Core and Custom packages let buyers scope different combinations.
Check add-ons carefully. The page lists items such as SQL access, faster refresh, and custom connectors separately; don’t infer their availability from a general platform description.
Connections and limits
The connector documentation names Shopify, Recharge, Amazon Seller Central, and Amazon Vendor Central among sales sources. Marketing and analytics sources are listed separately.
Some additional connections require Polar’s team to set them up. Its custom-connector guidance says these are available on paid plans and aren’t available during the free trial. Confirm how you’ll validate a required custom source before buying.
What it costs
Confirm the package price against your business size and required products. The public page checked for this comparison didn’t expose reliable amounts for every package, so this guide doesn’t repeat older estimated minimums.
Ask for the full cost, including required connectors, refresh frequency, and reporting access. A quote for one product may not cover the workflow you’re replacing.
How should you test a replacement before switching?
Test the report you use to make decisions, using matching records and definitions. Different totals can reflect timing, refunds, fees, or reporting scope rather than an error.
Specify the report
Start with one Databox report your team relies on. Write down the question it answers, the connected accounts, the metrics, and who receives it. Use this list to test whether a replacement meets your needs when comparing ecommerce reporting tools.
Decide whether you’re replacing a marketing dashboard, sales analysis, customer report, or custom BI workflow. Rebuilding something nobody reads is an expensive way to keep a habit.
Match the same records
Check these details before comparing totals:
- Date range and timezone: use the same period and allow both systems to finish syncing.
- Revenue definition: establish whether each figure includes discounts, tax, shipping, fees, or unpaid orders.
- Returns and refunds: trace their dates and treatment rather than assuming they appear in the original sales period.
- Currency: compare like currencies and check the conversion method for multi-currency reporting.
- Source records: follow a few orders through storefront and payment accounts to see how related records are handled.
- Delivery: check exports, permissions, and scheduled reports as well as the dashboard.
Shopify documents differences between sales reports, returns, refunds, and order exports. Stripe explains why exports and financial reports can differ in timing and included transactions. Neither difference alone proves a reporting tool is wrong.
Check the full cost
Ask what your accounts, stores, order volume, and reporting needs would cost. Include paid connectors, email allowances, add-ons, and annual commitments where they apply.
| If the missing report is about... | Start by evaluating... | Confirm before switching |
|---|---|---|
| Combined sales and customer activity | Putler | Source coverage and matched order/refund records |
| Marketing contribution and attribution | Triple Whale | Required sales/ad connections and measurement package |
| Custom commerce BI | Glew or Polar Analytics | Sources and the cost of the required reporting setup |
| WooCommerce or Shopify store analysis | Metorik | Platform grouping and order/store limits |
Keep the existing setup until the replacement answers the required questions. A new chart is easy to approve; a missing scheduled report tends to be noticed later.
Which tool should you shortlist first?
Choose the missing report first, then check its sources, calculations, and delivery needs. For combined ecommerce sales and customer reporting, start by checking whether Putler supports your accounts and fits your revenue bracket.
For attribution or a custom data stack, use the same checklist with the relevant specialist. Keep Databox if it already does the job at a cost and effort level you’re comfortable with.
If you need help matching your reporting needs to the product, you can book a consultation.
Frequently asked questions
What is the best Databox alternative?
The best fit depends on the report you’re replacing. Putler focuses on combined ecommerce sales and customer reporting; Metorik on WooCommerce or Shopify analytics; Triple Whale on marketing measurement; and Glew or Polar on commerce BI. Check source coverage and package limits before choosing.
Is Databox good for ecommerce?
Databox can support ecommerce dashboards and reporting, including calculations and dataset joins on eligible plans. A specialist may be more convenient for ready-made customer, product, or combined revenue reports. Compare the required report and setup effort rather than assuming Databox cannot combine data.
Which Databox alternative is best for Shopify?
Metorik is worth comparing for store reporting and email automation, while Triple Whale and Polar cover marketing measurement and broader analytics. Putler is relevant when Shopify is part of a connected sales setup. The choice depends on the report and other sources you need.
Is there a free or cheap Databox alternative?
Triple Whale offers a free plan. Putler starts at $20/month within its entry revenue bracket, and Metorik starts at $25/month within its entry order/store limits. Databox also has a free offering, so compare actual allowances instead of assuming switching will automatically be cheaper.
What is the best analytics tool for Etsy and Amazon sellers?
Putler’s published integrations include both Etsy and Amazon. Amazon support also exists in other tools here, including Triple Whale and Polar. Check the exact marketplace connection, region, and data coverage; an advertising connection isn’t the same as a sales connection.
Can Databox combine Shopify and PayPal revenue accurately?
Databox supports combining data through calculations and, on eligible plans, dataset joins. Accuracy depends on the report’s design and underlying records. Check whether related storefront and payment records are matched or excluded appropriately, and don’t add two figures that represent the same sale.