
Your accountant asks for last quarter’s refund data. Your support lead needs to look up a disputed transaction from three weeks ago. Your marketing team wants a CSV of completed orders over $100 from the UK.
And everyone ends up in the same place: logging into Stripe. Then PayPal. Then Shopify. Cross-referencing timestamps, hoping the numbers match, copy-pasting into a spreadsheet that someone started months ago but nobody’s maintained.
This is the operational tax of running an eCommerce business. Not the exciting part. Not the strategy.
This is what poor eCommerce transaction management looks like in practice, and it’s costing you more time than you realize.
Putler’s Transactions Dashboard, combined with instant refunds and team access controls, exists specifically to make this part of your business stop hurting. It’s one of the core dashboards of Putler.
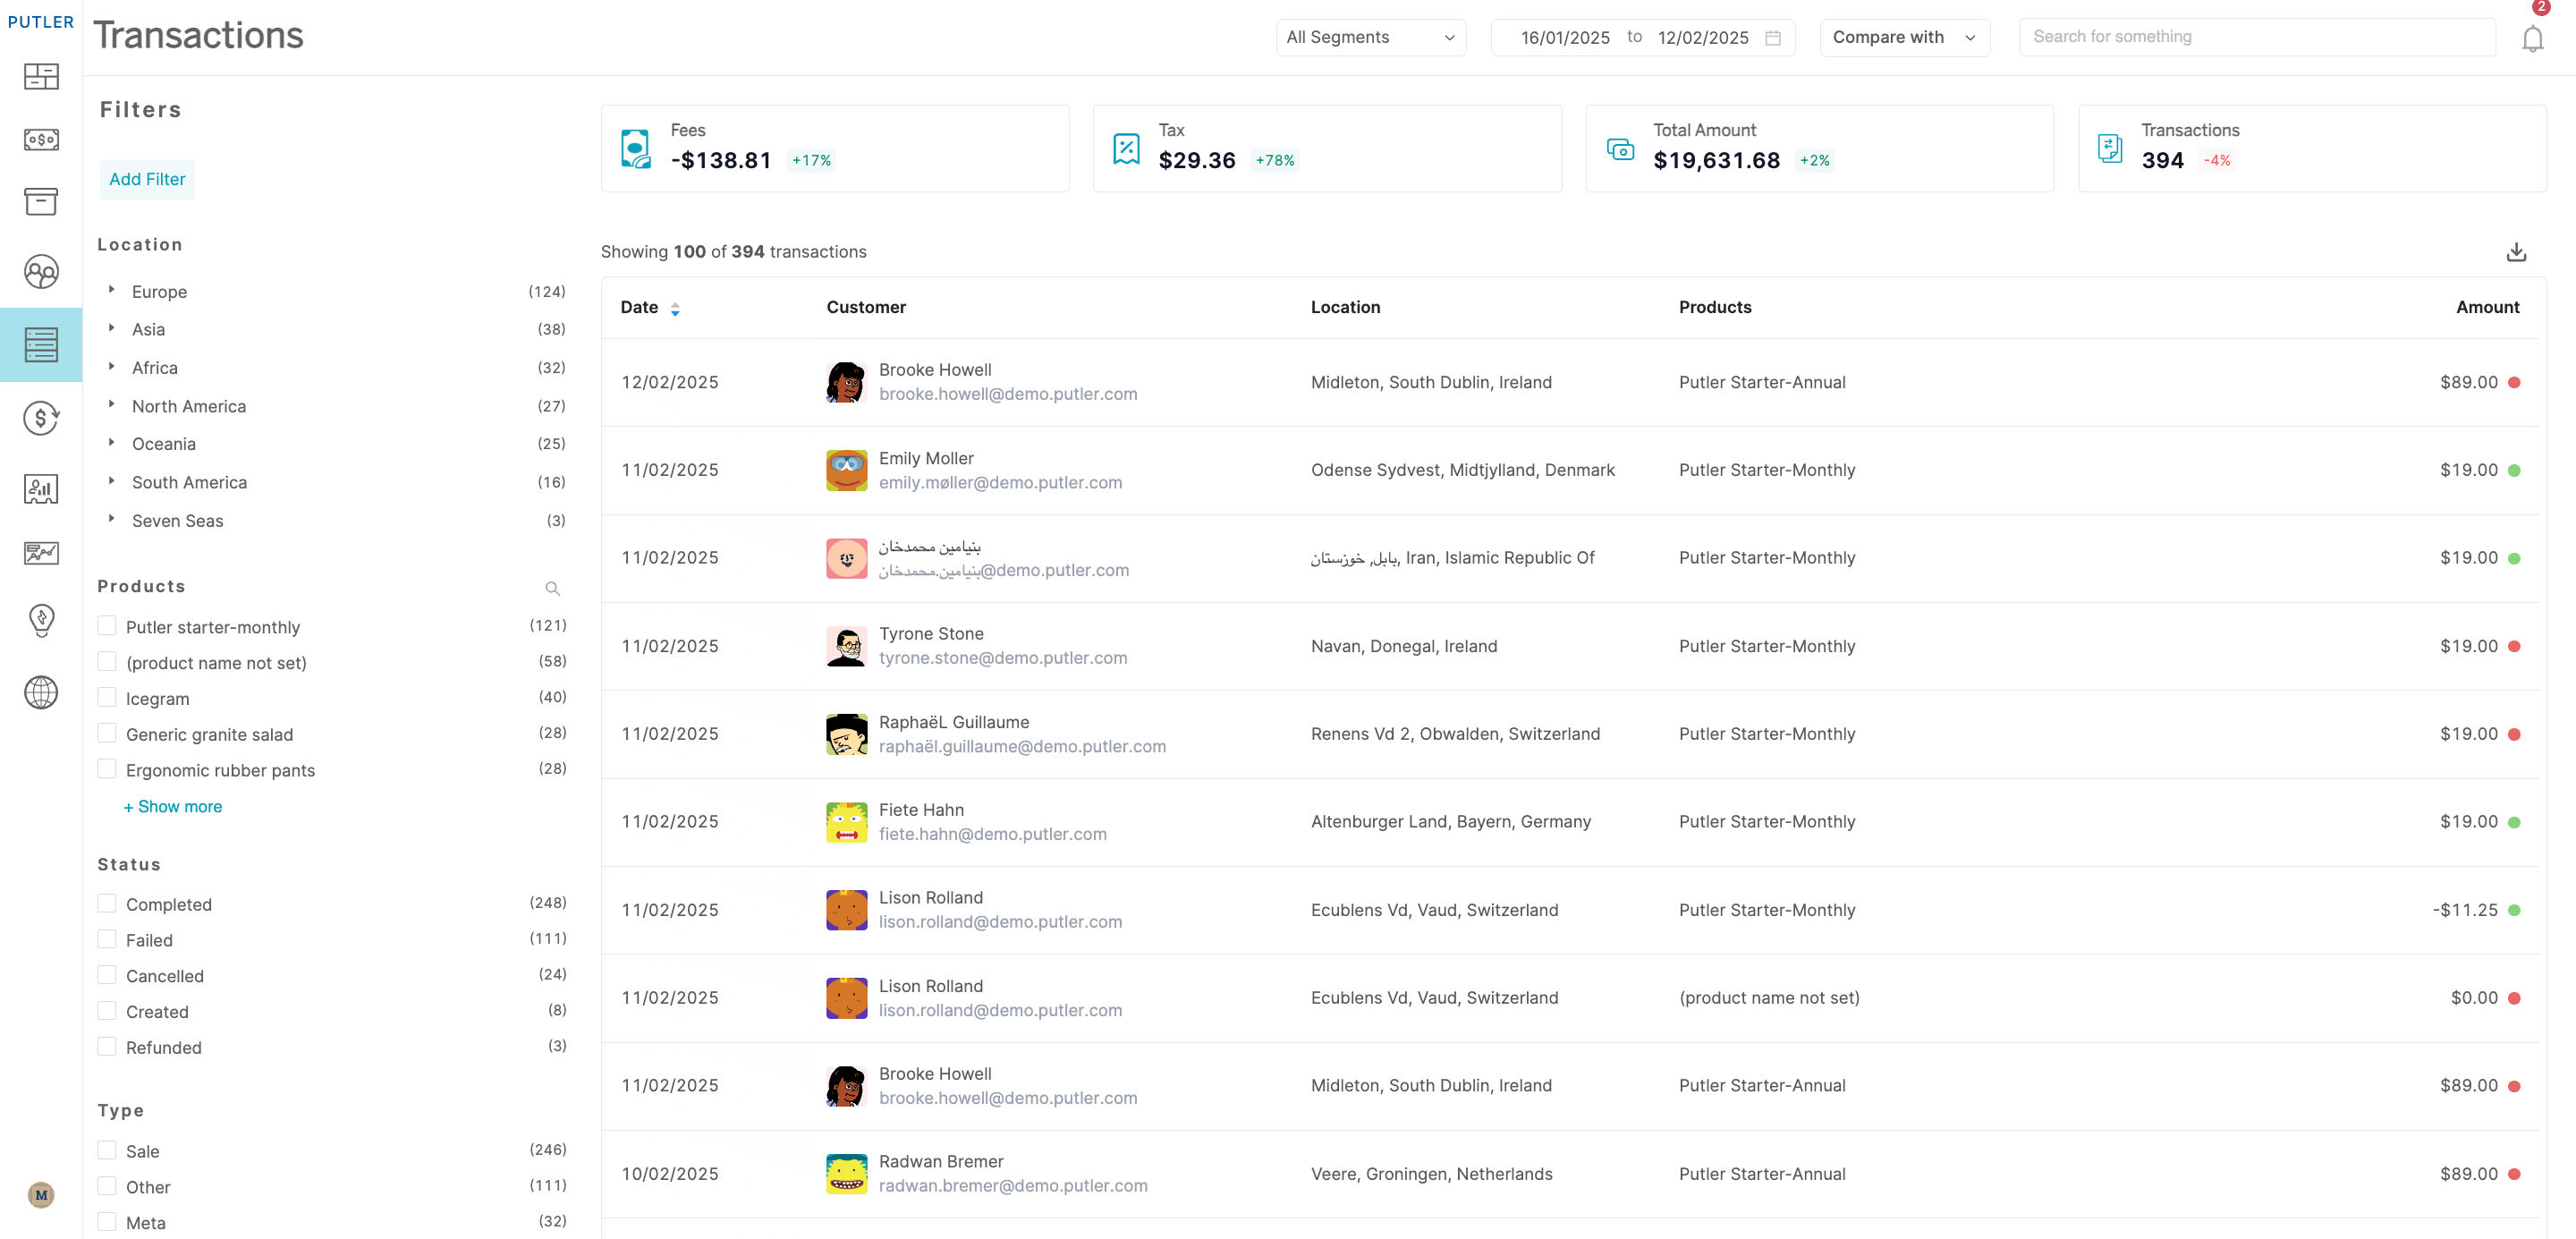
Every transaction, one place, one search
The core problem with eCommerce transaction management is fragmentation. Your transactions live in Stripe, PayPal, Shopify, WooCommerce, Razorpay, or some combination of all of them.
Each platform has its own format, its own filters, its own export quirks. Reconciling them into a single view requires either a manual spreadsheet or an expensive BI tool.
Putler pulls every transaction from every connected source into one list. Sales are marked green. Refunds are marked red. The total amount across your selected date range is shown at the top: net revenue, refunds, shipping, taxes, fees, discounts, and commissions, all broken out.
But the real power is in the filters. Four ways to slice your transaction data:
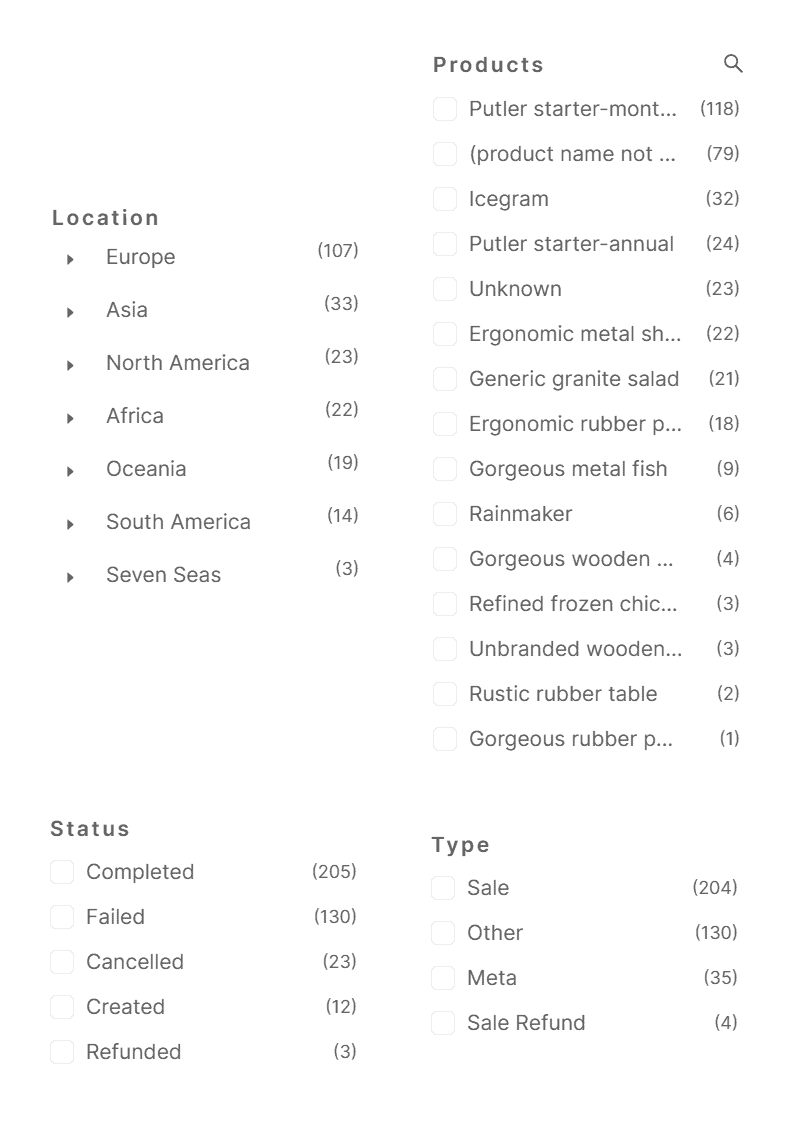
Location: Filter transactions by geography, from continent down to street level (if you collect addresses). When your accountant asks “how much did we sell in Germany last quarter?” the answer is a few clicks away. No spreadsheet gymnastics.
Product: Isolate transactions for a specific item. Useful for tracking a product launch, investigating a sudden spike in returns for one SKU, or pulling every order that included a specific item for a targeted campaign.
Status: Filter by completed, refunded, pending, or failed. When your finance team needs a clean view of only settled transactions for month-end reporting, they apply one filter and export. No manually removing refunds from a raw data dump.
Type: Filter by transaction type (sale, refund, etc.). When someone asks “how many refunds did we process in February?” you don’t need to count rows in a spreadsheet. Filter, read the number, done.
Combine any of these. “Completed sales over $200 from Australia in Q3” is a few clicks, not a pivot table. Once you have the view you need, hit export.
Putler sends you the CSV instantly via email. Your accountant, your marketing team, and your tax preparer all get exactly the data they asked for, in the format they can actually use.
The numbers your finance team actually needs
Filters help you find the right transactions. But your finance team also needs the totals, and not just revenue. The Transactions Dashboard shows four metrics across the top for your selected date range:
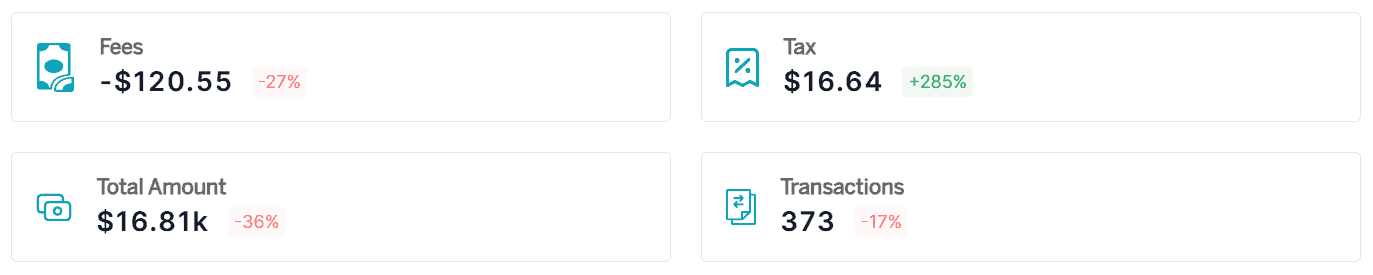
Total amount: The sum of everything — net revenue, refunds, shipping, taxes, fees, discounts, and commissions combined. This is the complete picture of money that moved through your business in the selected period. Not just what landed in your account, but every line item that contributed to or subtracted from it.
Transactions: The total count of transactions completed. For subscription businesses, this is a quick pulse on customer activity. A sudden drop in transaction count tells a different story than a drop in revenue — maybe fewer orders are coming in, or maybe a few large orders are masking a decline in volume.
Fees: The total fees incurred across all payment gateways and platforms. Every Stripe charge, every PayPal fee, every platform commission, all in one number. If you’re paying $2,000/month in processing fees across three gateways, you’d never see that total without consolidating the data first. Now you can track it month over month and spot if costs are creeping up.
Taxes: Total taxes incurred across all transactions. Come tax filing season, this is the number your accountant asks for first. Instead of pulling tax data from Stripe, then PayPal, then Shopify, and hoping the categories match, Putler gives you the consolidated figure for whatever date range you select. Set it to the fiscal quarter, export, done.
These metrics update with every filter you apply. Filter by location and you see fees and taxes for just that region. Filter by product and you see the total amount for just that item. The numbers always reflect the current view, not some static summary.
Below the metrics, the transactions list shows every individual transaction: green for sales, red for refunds. Each row is expandable into a full details card.
And the entire list is exportable as CSV, so your finance team gets the raw data in the format they already work with.
Refunds without the gateway runaround
Here’s a workflow that happens dozens of times a week in most eCommerce operations:
Customer emails asking for a refund. Support agent opens Putler, finds the customer’s transaction. Then has to stop, open a new tab, log into Stripe or PayPal, search for the same transaction again, process the refund, go back to the support ticket, and confirm it’s done.
Five minutes minimum. More if the payment gateway is slow or the agent doesn’t have login credentials.
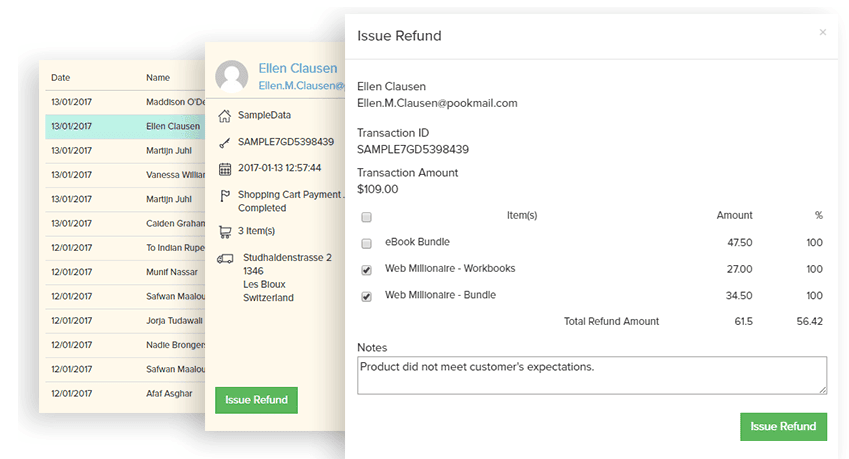
Putler eliminates the middle steps. Your support team can process full or partial refunds directly from within Putler, for transactions from PayPal, Stripe, and Shopify.
Find the transaction, click refund, confirm. Done. No logging into payment gateways. No switching tabs. No sharing sensitive credentials.
For a team handling 20+ refund requests a week, this alone saves hours. But the bigger win is accuracy.
Every refund processed through Putler is immediately reflected in your transaction list, your metrics, and your exports. No lag between “refund issued in Stripe” and “refund showing up in the report.” The numbers stay clean in real time.
And if your support team works in a separate helpdesk or CRM, Putler’s Chrome extension lets them pull up complete customer profiles and transaction details right inside their existing tool. No switching to Putler separately. The context follows them wherever they work.
Team access: everyone sees what they need, nothing they don’t
The other operational headache is access control. Your support team needs to look up orders and process refunds. Your marketing analyst needs to dig into customer and product data.
Your admin needs the full financial picture. But giving everyone full access to your payment gateways is a security problem, and most analytics tools charge per seat.
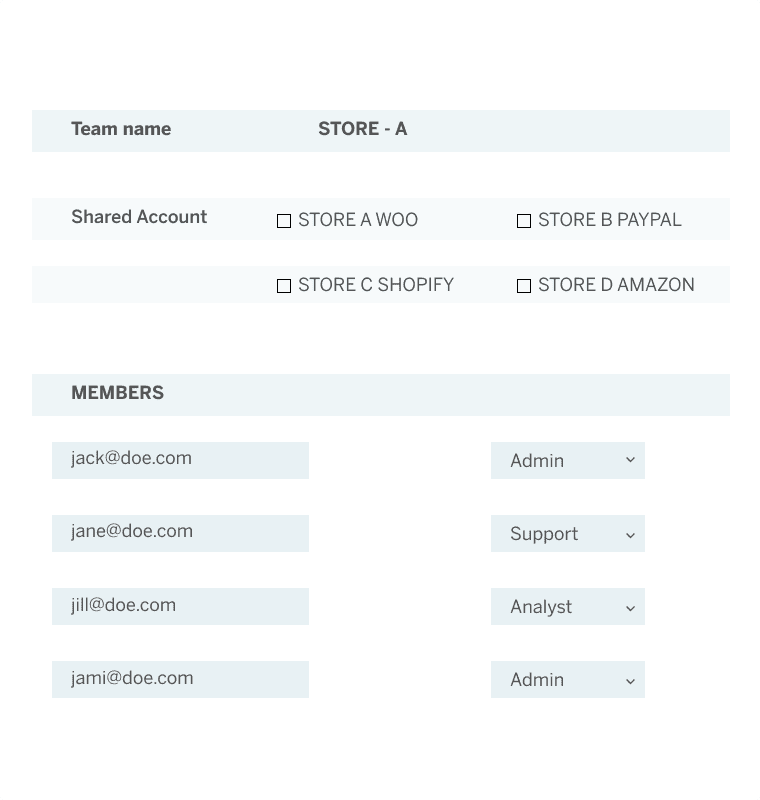
Putler solves this with three built-in roles and unlimited team members at no extra cost:
Admin: Full access to every dashboard and every metric. This is the business owner or finance lead who needs the complete picture: revenue, costs, margins, everything.
Support: Access to the Sales, Transactions, and Time Machine dashboards, but no financial metrics visible. They can see individual orders, look up customer invoices, process refunds, and manage subscriptions. They can’t see your total revenue, net sales, or other numbers they don’t need for their job. This means you never have to share your Stripe or PayPal login with your support team again.
Analyst: Access to Products, Customers, Audience, Time Machine, and Holiday Season Insights dashboards, but again, no financial metrics. Perfect for your marketing team, consultants, or data analysts who need to understand customer behavior, product performance, and traffic patterns without seeing the bottom line.
No per-seat charge means your entire team can be in Putler. The intern running social media gets an Analyst view. The freelance customer support agent gets Support access. Your co-founder gets Admin. Everyone has what they need, no one has more than they should.
What your Monday morning looks like after this
Finance reporting
❌ Without Putler: Log into each gateway, download separate CSVs, merge in Excel, clean formatting, remove test transactions. Two hours before anyone sees actual numbers.
✅ With Putler: Open the Transactions Dashboard, set the date range, filter for completed transactions, export CSV. Five minutes. Currency conversion, timezone normalization, and deduplication already handled.
Customer disputes
❌ Without Putler: Ping the owner for Stripe credentials, wait for a response, log in, search for the transaction, copy details into the support ticket, hope the amounts match.
✅ With Putler: Search the customer’s email, see the full transaction history in seconds, process the refund if needed, close the ticket. No credentials shared. No waiting. No mismatch risk.
Refund reporting
❌ Without Putler: Spend an afternoon producing a Q4 refunds CSV you’re not entirely sure is complete.
✅ With Putler: Filter by type (refund), set the date range to Q4, export. One minute. Complete. Auditable.
Tax season
❌ Without Putler: Pull transaction data from every platform, convert currencies manually, sort completed vs pending, hope nothing fell through the cracks between Stripe and Shopify.
✅ With Putler: Your tax preparer gets a single clean CSV with everything accounted for. No gaps, no duplicates, no manual currency math.
The bottom line
Transaction tracking, refunds, and team access aren’t the glamorous parts of running a store. But they’re the parts that eat hours every week when they’re not handled well, and the parts where a small mistake in reconciliation or a shared password can cause real damage.
Good eCommerce transaction management isn’t just about finding orders faster, it’s about giving every person on your team the right data, at the right time, without the gateway runaround.
Putler’s Transactions Dashboard puts every transaction from every platform in one filterable, searchable, exportable list.
Instant refunds cut a five-minute gateway runaround down to seconds. And role-based team access means everyone on your team gets exactly the view they need, with no extra cost per seat.
- Sales Analytics: How to Track and Improve Your Store Performance
- eCommerce Analytics 101: A Complete Beginner’s Guide
- How Online Businesses Can Increase Customer Lifetime Value
- Customer Retention Strategies: Proven Tactics to Keep Customers Coming Back
- Sales Forecasting: Methods, Tools and Best Practices