Business owners juggle multiple hats. Due to this time crunch, they often overlook one of the most critical aspects of running a business a.k.a measuring business performance.
In this article, I will provide you an easy solution that is custom-made for business owners. It tracks critical metrics, provides real-time reports, and helps keep a tab on all important aspects of every business – sales, orders, products, customers and website traffic.
Continue reading the discover this magic tool…
Go to place to get your business overview: Putler’s Home Dashboard
Pulter is a tool made by business owners for business owners. We understand all the key metrics that a business owner needs to have access to at any point in time. They need to have a complete business overview in order to make sound and profitable decisions for their business.
So we make all these critical KPIs available in a single place. Putler’s Home Dashboard is a great example of all the key metrics that a business owner must track. Take a look at how it looks here –
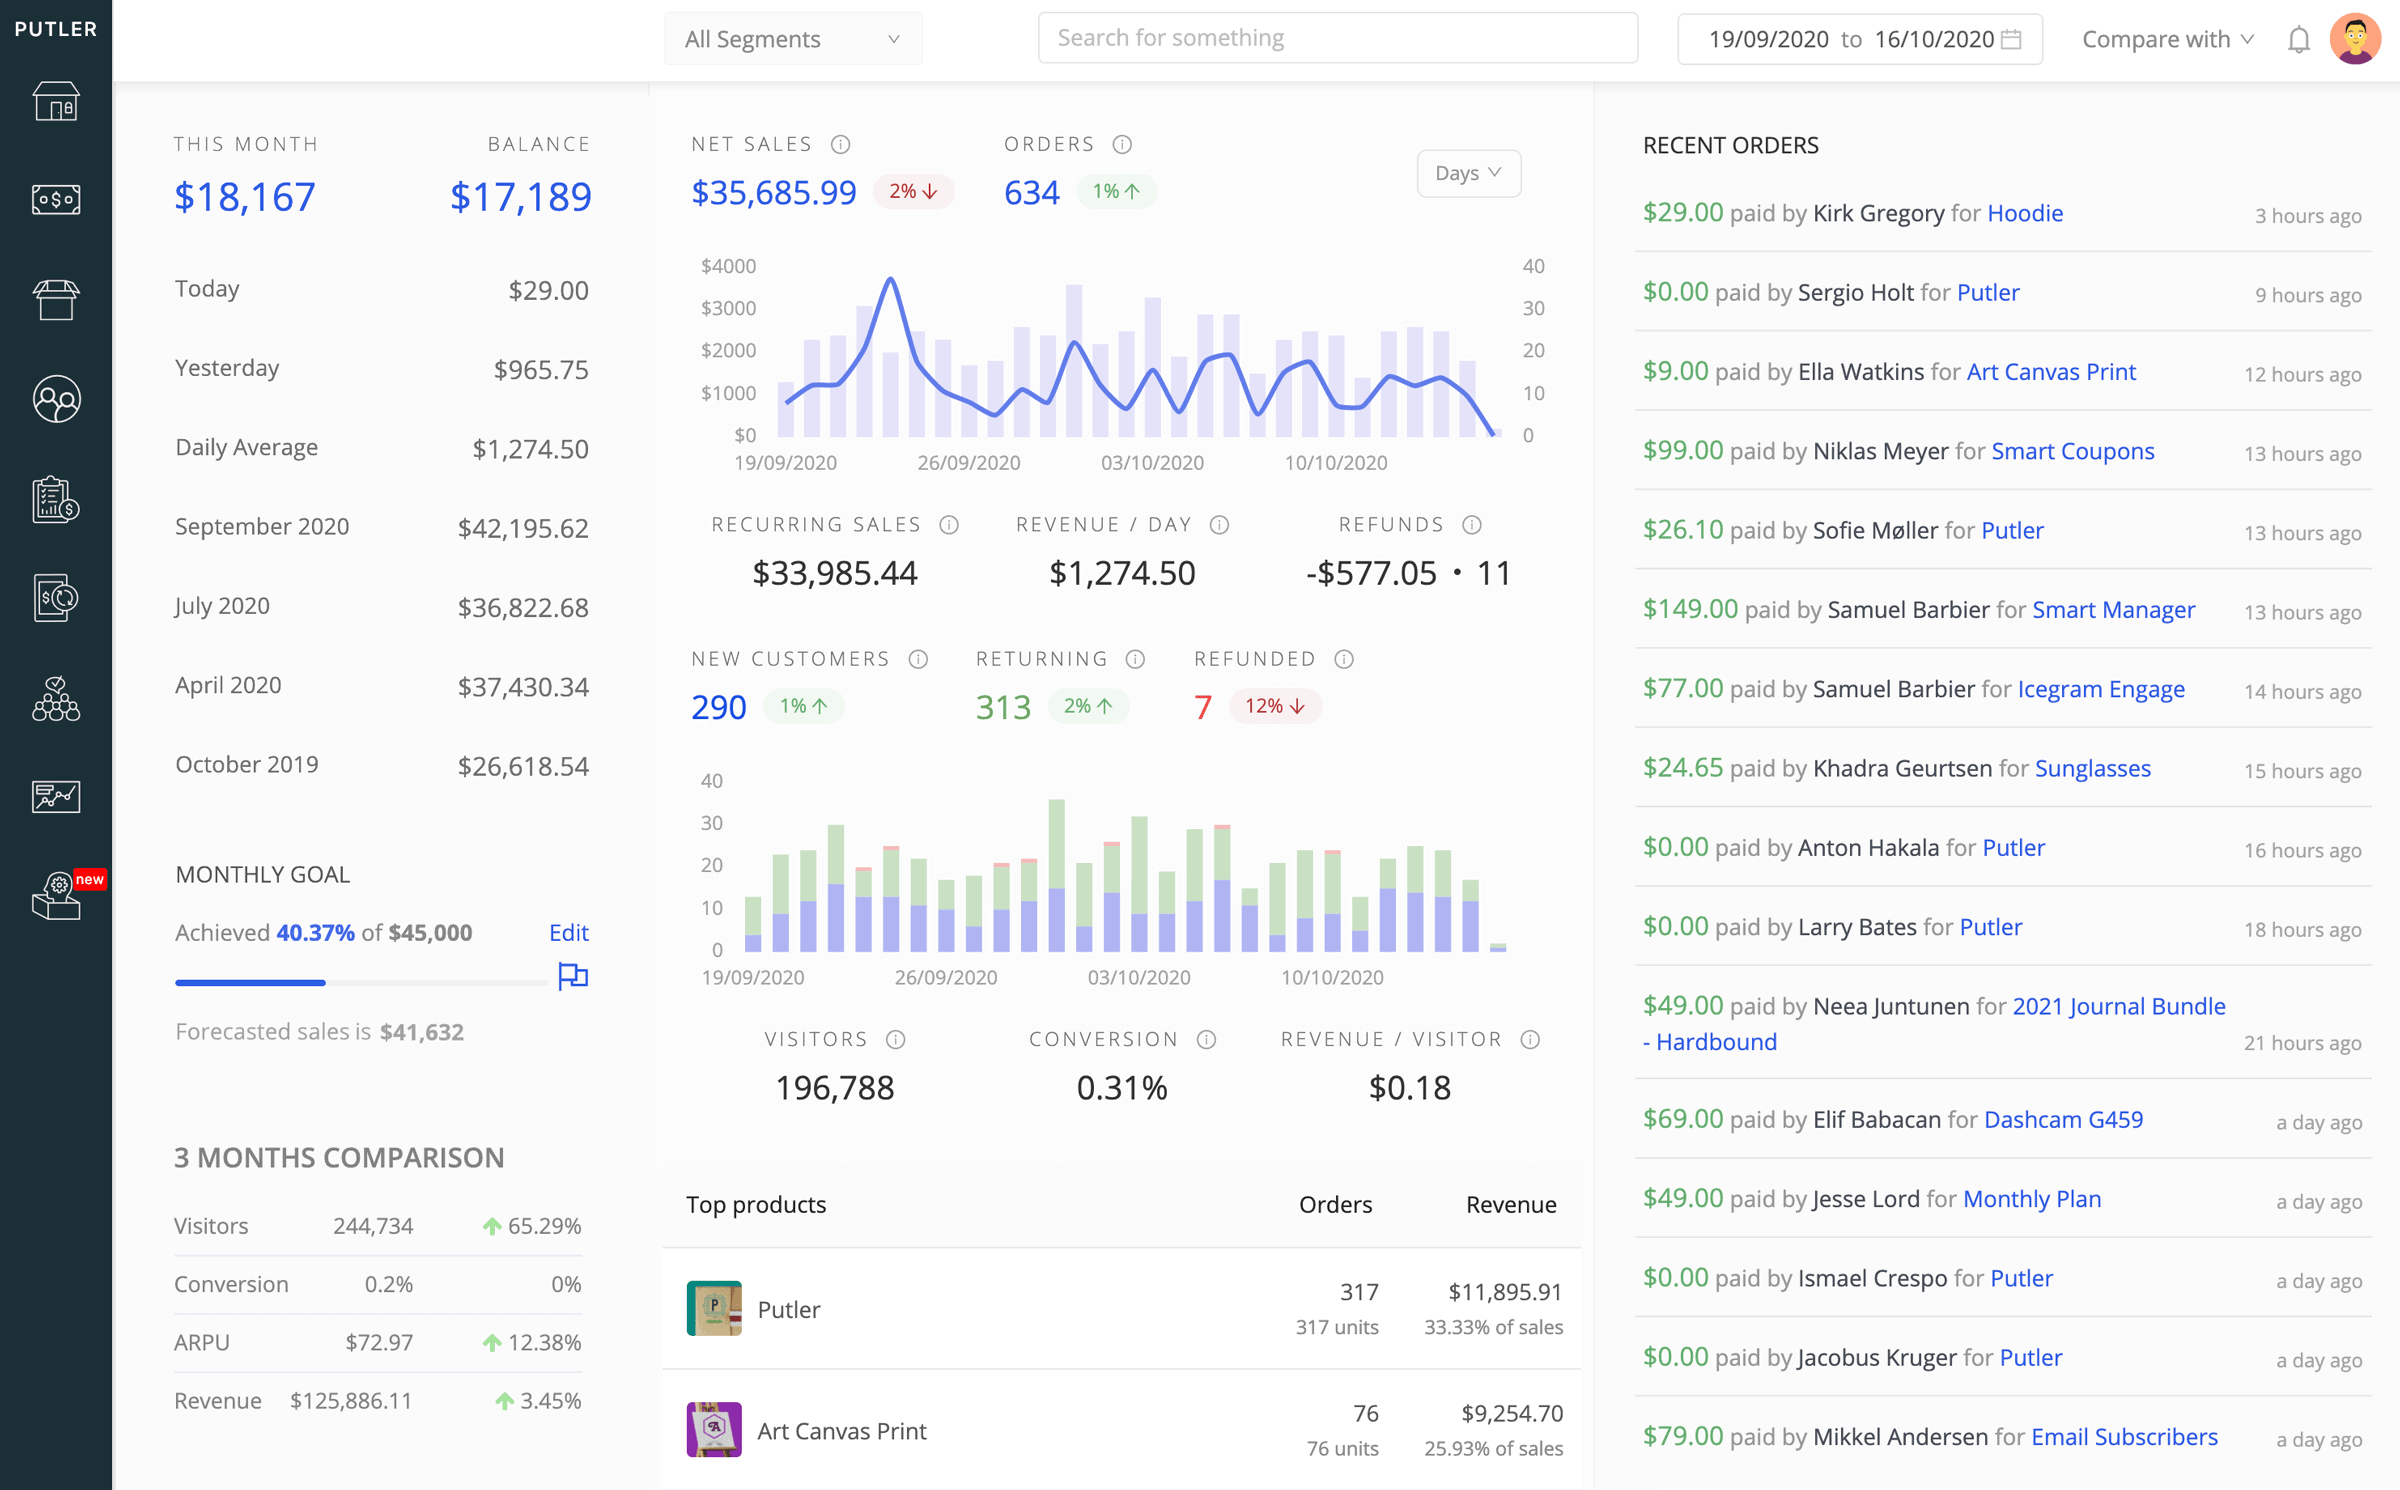
Critical Sales KPI’s
Sales is the yardstick for business success. Putler recognises this and displays all important sales numbers on the Home dashboard.
Here are some critical sales KPI’s
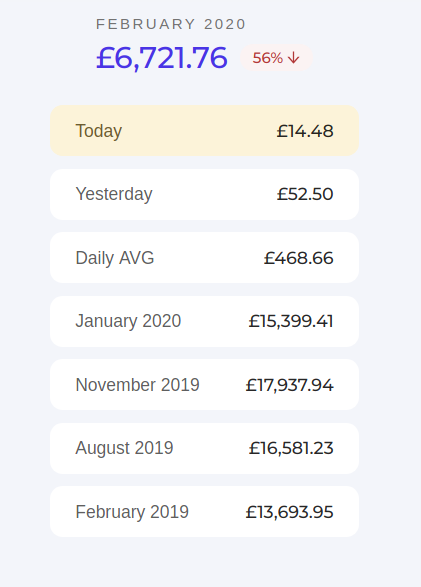
- Current month’s sales
- Today’s sales
- Yesterday’s sales
- Daily average
- Last month’s sales
- Sales 3 months’ prior
- Sales 6 months’ prior
- Sales 12 months’ prior
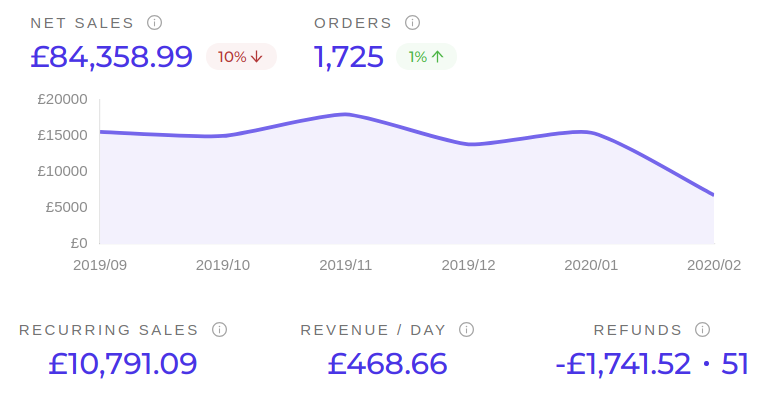
Sales Analytics Graphs
This graph gives you an overview of the sales and orders in the selected date range.
It also gives important sales KPI’s like;
- Recurring sales
- Revenue/day
- Refunds
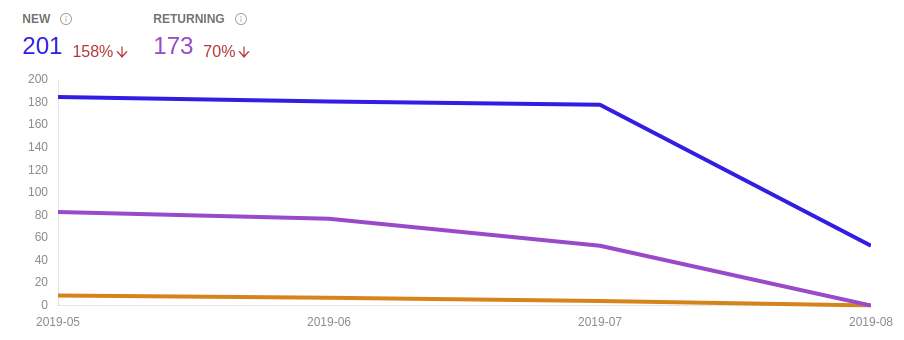
Customer Analytics Graphs
This graph gives you an overview of your customer base for the selected date range in the date picker.
You can easily find out 3 main customer KPI’s for your business:
- New customers
- Returning customers
- Refunded customers
Here’s how this graph looks:
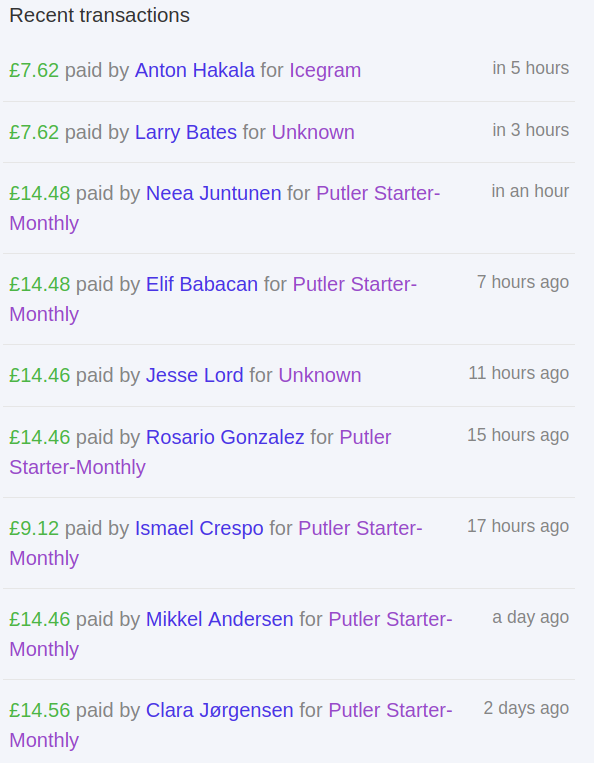
Transaction Activity
Every business owner is interested in knowing what is happening in their business at any point in time.
Putler’s Transaction Activity gives you a complete list of transactions that takes place in your business in the selected date range.
It provides information about the customer and his corresponding transaction activity – (refund, payment completion, order cancellation)
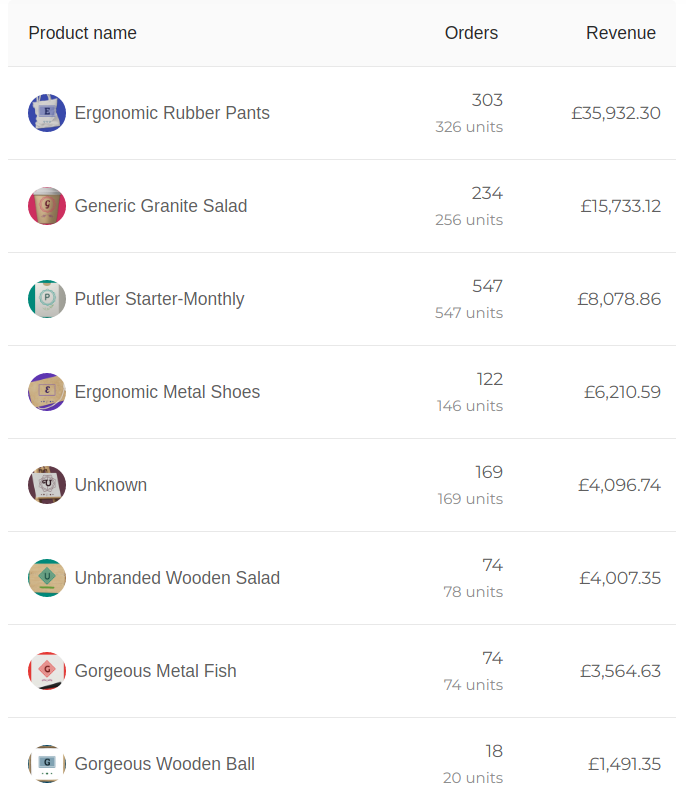
Product Leaderboard
This feature is specially dedicated to products.
It gives a complete idea of how your products are performing during the selected date range.
The Product leader board features the top 10 products on your store.
Now, what if you have less than 10 products on your store?
No issues, Putler will still process all your products and make a list of the best performing product to the least performing product.
Take a look at the Product Leaderboard now;
Practical ways to use the Home dashboard
- Know the pulse of your business by viewing the critical sales KPI’s
- Create product strategies like upsells, downsells, bundles based on their performance on the product leaderboard.
- Keep an eye on the transaction activity and act on transactions like refunds, cancellation etc.
- Take a look at your customer growth and formulate strategies to grow these numbers.
Over to you!
I hope you found this article useful. I encourage you to use Putler or any other tool of your preference to get a complete overview of your business. It will help you stay on top of your numbers, spot opportunities, tackle threats and grow your business overall.
Feel free to leave a comment if you feel we missed out on an important metric in the comment section. Your feedback is most welcome.
Get a complete overview of your business in under 5 minutes
Take Putler’s 14 day free trial. No coding or credit card required.
Try Putler For Free
Is it possible to make the graphs smaller? I prefer the older look as it’s more compact. With the new home display the graphs take up a lot of room so I have to scroll down.
Also some info is missing like conversion rate and total traffic to site (now just shows customers).
I also prefer the menu at the left to go to different screens as it takes one click. The new one takes 2 since it uses a drop down.
Cheers,
Jesse
Hi Jesse,
Thanks for the feedback. We have improved the Home Dashboard and are making it look more compact. We have also added the conversion and traffic info. Our main goal is to retain as many features as possible and also provide new useful ones. Feel free to give feedback on the other dashboards as well.