
It is the middle of a planning meeting. Someone asks, what is revenue going to look like next quarter?
If you are running a small or mid-sized business, here is what usually happens next. You take the average of the last few months, add a vague growth assumption, and call it a forecast. Maybe you pull up Shopify or Stripe and squint at a chart. Maybe you go with your gut.
That is not forecasting. That is a guess wearing a spreadsheet.
A real revenue forecast does three things:
- Takes your actual historical data as the input
- Identifies the pattern (trend, seasonality, growth rate) in that data
- Projects that pattern forward in a defensible, testable way
Done right, it tells you what to expect, what to plan for, and when to worry. Done wrong, it gives you false confidence and bad hiring decisions. According to Outreach research, only 43% of sales leaders forecast within 10% accuracy. The rest are essentially flying blind.
This guide walks you through how to forecast revenue based on historical data the way founders actually need to. Practical, no PhD required, built around the data you already have.
What you need before you start
Before you build any forecast, you need three things in place:
- At least 12 months of historical revenue data. 24 months is better. Less than 12 and you cannot see seasonality clearly.
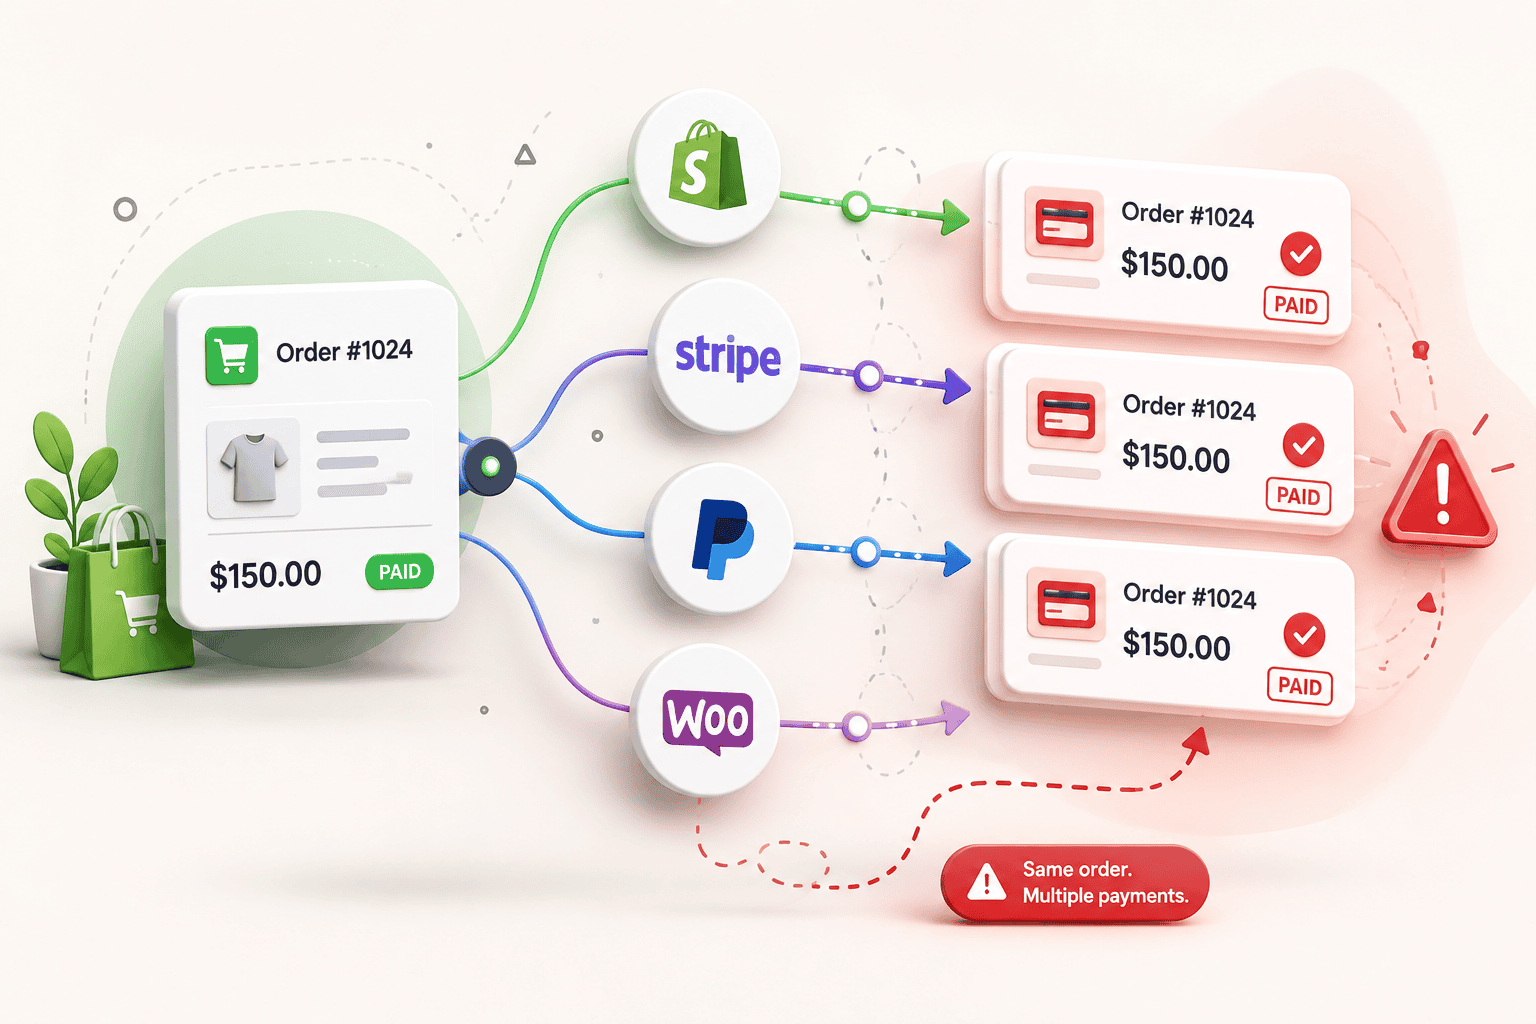
- Clean numbers. Refunds backed out. Currencies normalized. Duplicate orders removed. Test transactions excluded.
- Context on the anomalies. If December was a 300% spike, is it BFCM or a one-off viral moment? You need to know which.
Skip these steps and your forecast will be confident garbage.
How to forecast revenue based on historical data: 5 methods
There are dozens of forecasting methods. For most founders, these five cover 95% of what you need.
1. The historical average method
The simplest one. Take the average of your monthly revenue over the past 12 months and project it forward.
Formula: Forecast = Sum of last 12 months ÷ 12
Example: Last year you did $480,000 in revenue. Monthly average is $40,000. Forecast for next month: $40,000.
When to use it: Stable, non-seasonal businesses with predictable monthly revenue.
When to skip it: Any business with growth, seasonality, or recent changes. Which is most businesses.
2. The moving average method
A smarter version. Instead of averaging the whole year, you average the most recent 3 or 6 months and roll that forward. This adapts to recent trends.
Formula: Forecast = Sum of last 3 months ÷ 3
Example: Your last three months were $42K, $45K, and $48K. Moving average forecast for next month: $45,000.
When to use it: Businesses with mild growth where recent months are more relevant than older ones.
When to skip it: Heavily seasonal businesses. A 3-month average in November will overshoot January wildly.
3. The year-over-year (YoY) growth method
This is the one most founders actually need. Take the same month from last year and apply your current growth rate.
Formula: Forecast = Same month last year × (1 + Growth rate)
Example: November 2024 revenue was $60,000. Your YoY growth has been running at 25%. Forecast for November 2025: $60,000 × 1.25 = $75,000.
When to use it: Seasonal businesses. Anyone doing BFCM, holiday spikes, or summer dips. This is the method that respects how your business actually behaves.
When to skip it: Businesses less than 18 months old (no comparable data) or businesses that pivoted recently.
4. The compound annual growth rate (CAGR) method
For longer-term forecasts. CAGR smooths your growth rate across multiple years, so a single great year doesn’t skew your projection.
Formula: CAGR = (Ending revenue ÷ Starting revenue)^(1/years) – 1
Example: You did $200K in 2022 and $450K in 2024 (2 years of growth). CAGR = ($450K ÷ $200K)^(1/2) – 1 = 0.5 = 50% per year. Forecast for 2025: $450K × 1.5 = $675K.
When to use it: 12-month or multi-year forecasts. Board decks. Investor conversations.
When to skip it: Short-term monthly forecasts. CAGR is for the long view.
5. Linear trend forecasting (regression)
When your revenue is growing in a relatively straight line, you can fit a trend line through it and project that line forward.
Formula: y = mx + b (where m is the slope and b is the starting point)
Example: Plot your monthly revenue in Excel or Google Sheets. Use the FORECAST.LINEAR() function. It does the math for you and gives you the next data point on the trend line.
When to use it: Steadily growing businesses without strong seasonality.
When to skip it: Hockey-stick growth (linear underestimates), seasonal businesses (linear ignores the cycle), or declining businesses (the trend is misleading).
A practical 4-step workflow
Methods are useful only if you have a process to apply them. Here is how to forecast revenue based on historical data in practice.
Step 1: Gather and clean your data
Pull 12 to 24 months of monthly revenue. Strip out refunds, chargebacks, test transactions, and currency mismatches. List any one-off events (a viral post, an outage, a big enterprise deal) so you can decide whether to include or exclude them.
Step 2: Look for the shape of your data
Plot the numbers in a chart. Then ask three questions:
- Is there a clear trend (up, down, flat)?
- Is there seasonality (same months spiking or dipping every year)?
- Are there outliers (months that are clearly not normal)?
The answers tell you which method fits. Stable and flat → historical average. Trending up → moving average or linear. Seasonal → YoY. Long horizon → CAGR.
Step 3: Build three scenarios, not one number
A single forecast is a trap. Build three:
- Best case: Apply your highest reasonable growth rate
- Most likely: Apply your average growth rate
- Worst case: Apply your lowest reasonable growth rate (or 0% growth)
Make decisions based on the most likely case. Plan cash flow against the worst case.
Step 4: Compare to reality every month
The forecast is not done when you build it. At the end of each month, compare actuals to forecast. If you are consistently off in the same direction, your method is wrong or your inputs are stale. Adjust.
Three quick examples
Shopify store forecasting Q4 revenue
A DTC brand did $80K in Q4 last year. YoY growth this year is running at 30%. Q4 forecast: $80K × 1.30 = $104K. Run the math separately for October, November (with the BFCM spike), and December, then sum.
SaaS forecasting next-month MRR
You have $50K MRR today. Average monthly net new MRR for the last 3 months has been $4,200. Churn has been 3.5%. Next month forecast: $50K + $4,200 – ($50K × 0.035) = $52,450.
Agency forecasting Q1 revenue
Your retainer base is $35K/month, locked in. Project pipeline for Q1 is $90K (probability-weighted at 70% = $63K). Q1 forecast: ($35K × 3) + $63K = $168K.
5 mistakes founders keep making
- Forecasting from too little data. Three months of data is not a trend. It is a snapshot.
- Ignoring seasonality. Using a 3-month average to forecast December is how founders accidentally overshoot inventory by 60%.
- One forecast instead of three. A single number with no scenarios gives you no flexibility when things move.
- Mixing one-time and recurring revenue. One big enterprise deal in your MRR forecast will throw off the entire trajectory.
- Treating the forecast as a prediction. A forecast is a planning tool. It is supposed to be revised. Founders who don’t revise are founders who get surprised.
Tools to use
Spreadsheet (Excel or Google Sheets)
Free, flexible, good for getting started. Use built-in functions like AVERAGE(), FORECAST.LINEAR(), and TREND(). The downside: you have to update the data manually every month, and one broken formula kills the whole sheet.
Built-in platform dashboards (Shopify, Stripe)
Shopify Analytics and Stripe Dashboard both show historical revenue, but neither does proper forecasting. They are reporting tools, not forecasting tools.
Dedicated analytics tools
If you want forecasting that runs on your real, multi-channel data without you maintaining a spreadsheet, this is where dedicated tools come in. Putler has a built-in forecasting dashboard called Time Machine that takes your starting revenue, growth rate, and churn rate, then projects 12 months forward.
You can adjust the inputs to model best-case and worst-case scenarios, and it works across Shopify, WooCommerce, Stripe, PayPal, and other connected sources in one view.
It is not a replacement for understanding the methods above. It is what saves you from rebuilding the spreadsheet every month.
So what now?
Forecasting revenue based on historical data is not about predicting the future. It is about making better decisions in the present.
Start small. Pull 12 months of revenue. Pick one method (YoY is the right starting point for most businesses). Build three scenarios. Compare to actuals at the end of every month. That is it.
The founders who get this right don’t have crystal balls. They just have one forecast that gets a little better every month, and the discipline to update it.