Generating an insight is easy. Generating the right one is the hard part.
I did not understand this until I started building in this space. I assumed the difficulty would live in the analysis. The math, the detection, the moment the machine looks at a column of numbers and finds the one that moved. That part took about a week.
The other part has taken every week since.
A system can tell you sessions dropped 14% almost instantly. What it cannot easily tell you is whether that 14% is the most important thing that happened this week, or the least.
Whether it is noise, or the first crack of something that will cost you real money by the end of the month. Whether you should drop everything, or scroll past.
The math was never the bottleneck. The judgment is.
And once you see that, you start to notice something uncomfortable about nearly every analytics tool in existence.
They have all poured their effort into the easy half. They generate. They surface. They describe. The hard half, where someone decides what any of it actually means and what you should do about it, they quietly leave to you.
They describe your data. They never reach diagnostic analytics, the part that tells you why.
The whole industry stops at “what happened”
There is a well-worn ladder in analytics, and it goes like this.
- Descriptive analytics tells you what happened.
- Diagnostic analytics tells you why it happened.
- Predictive analytics tells you what is likely to happen next.
- Prescriptive analytics tells you what to do about it.
Four rungs: hindsight, insight, foresight, action.
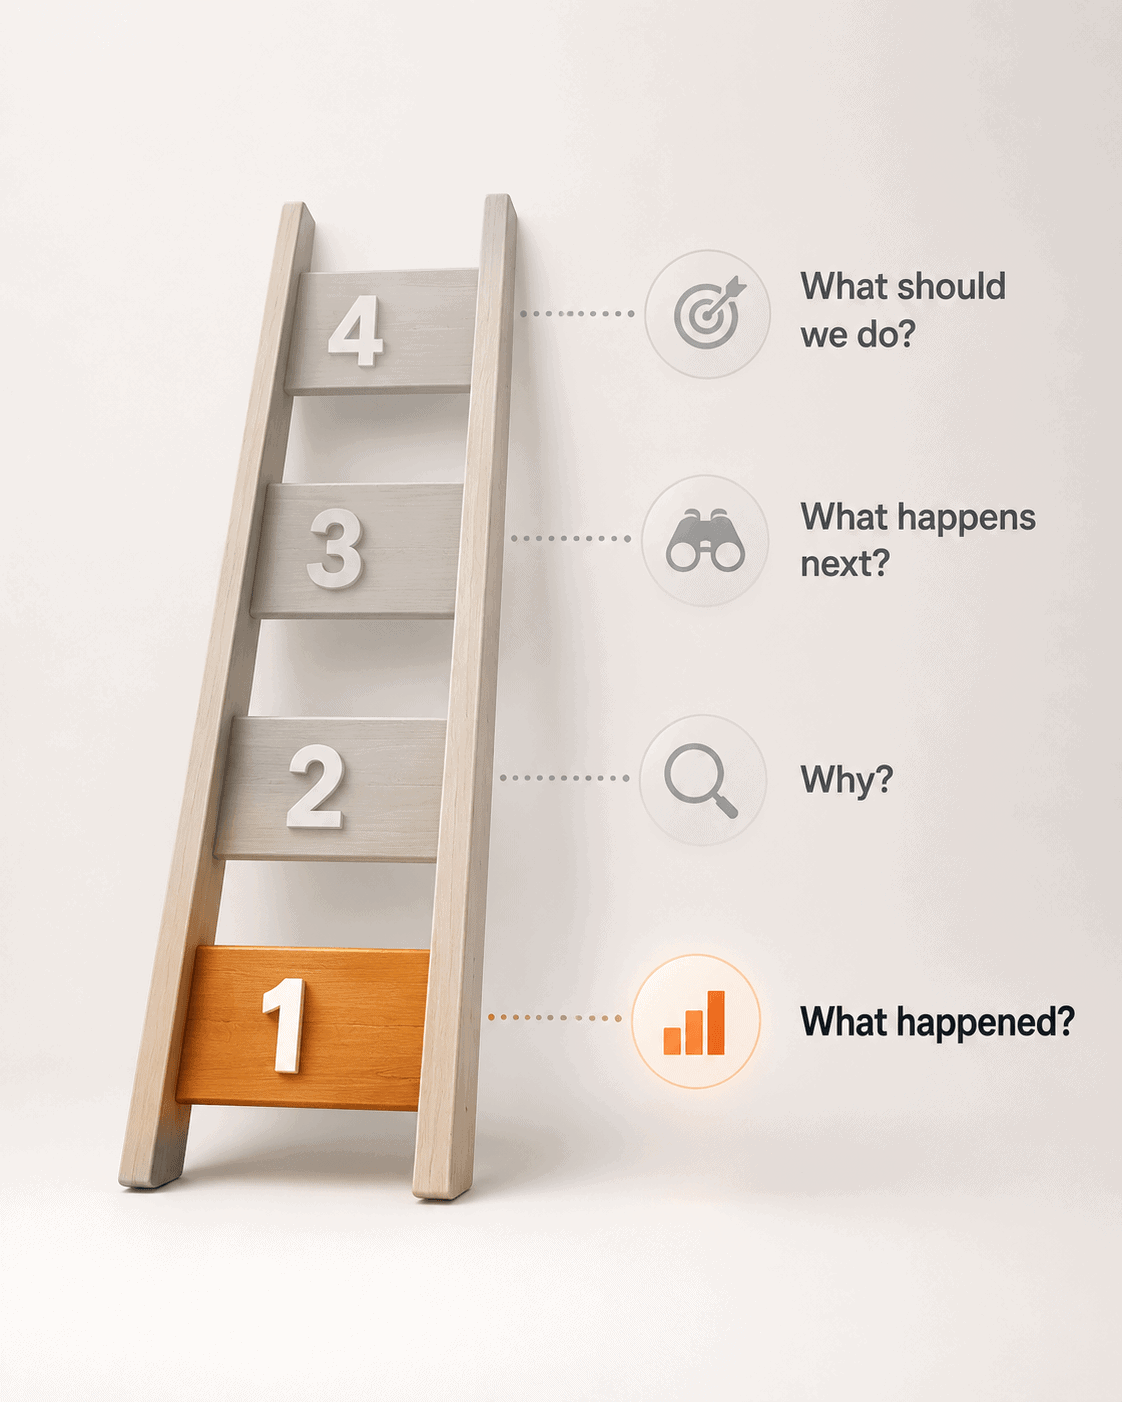
Here is the uncomfortable truth about the tools most businesses actually use. They live almost entirely on the first rung.
They are description engines, often very good ones. They will show you that revenue dipped, that traffic shifted, that a cohort churned, all rendered in clean charts with a tidy percentage next to an arrow.
What they will not do is climb to the second rung.
They will not tell you why revenue dipped. That is diagnostic analytics, and it is where the value begins and where almost every tool stops short.
The “why” is the thing you actually need. It is also the thing the dashboard politely declines to provide.
Description is cheap. Diagnosis is expensive. So the industry sells description and calls it insight.
The longer I sit with this, the stranger it gets. We have spent twenty years and a staggering amount of money building tools that are exceptional at telling us what already happened, and we have decided that the part which would actually change a decision is somebody else’s job.
Usually the job of a person who does not exist on the team. An analyst the business could never afford and was never going to hire.
The ladder has four rungs. Most tools climb the first one well, then stop.
Why descriptive analytics is the easy part
Tools do not stop at description out of laziness. They stop because the first rung is genuinely achievable, and every rung after it is genuinely hard.
I want to be fair here, because description is not trivial work. Getting clean, trustworthy numbers is genuinely hard.
Tracking that fires correctly, attribution that holds up, data from five sources that actually reconciles into one honest figure. The teams who do this well have earned every bit of the respect they get, and anyone who has wired up event tracking knows it is not for the faint of heart.
But once the data is clean, turning it into a description is the easy part. Count this week, count last week, compare, render the difference. No judgment, no risk. The number is the number.
The hard part is everything after the number.
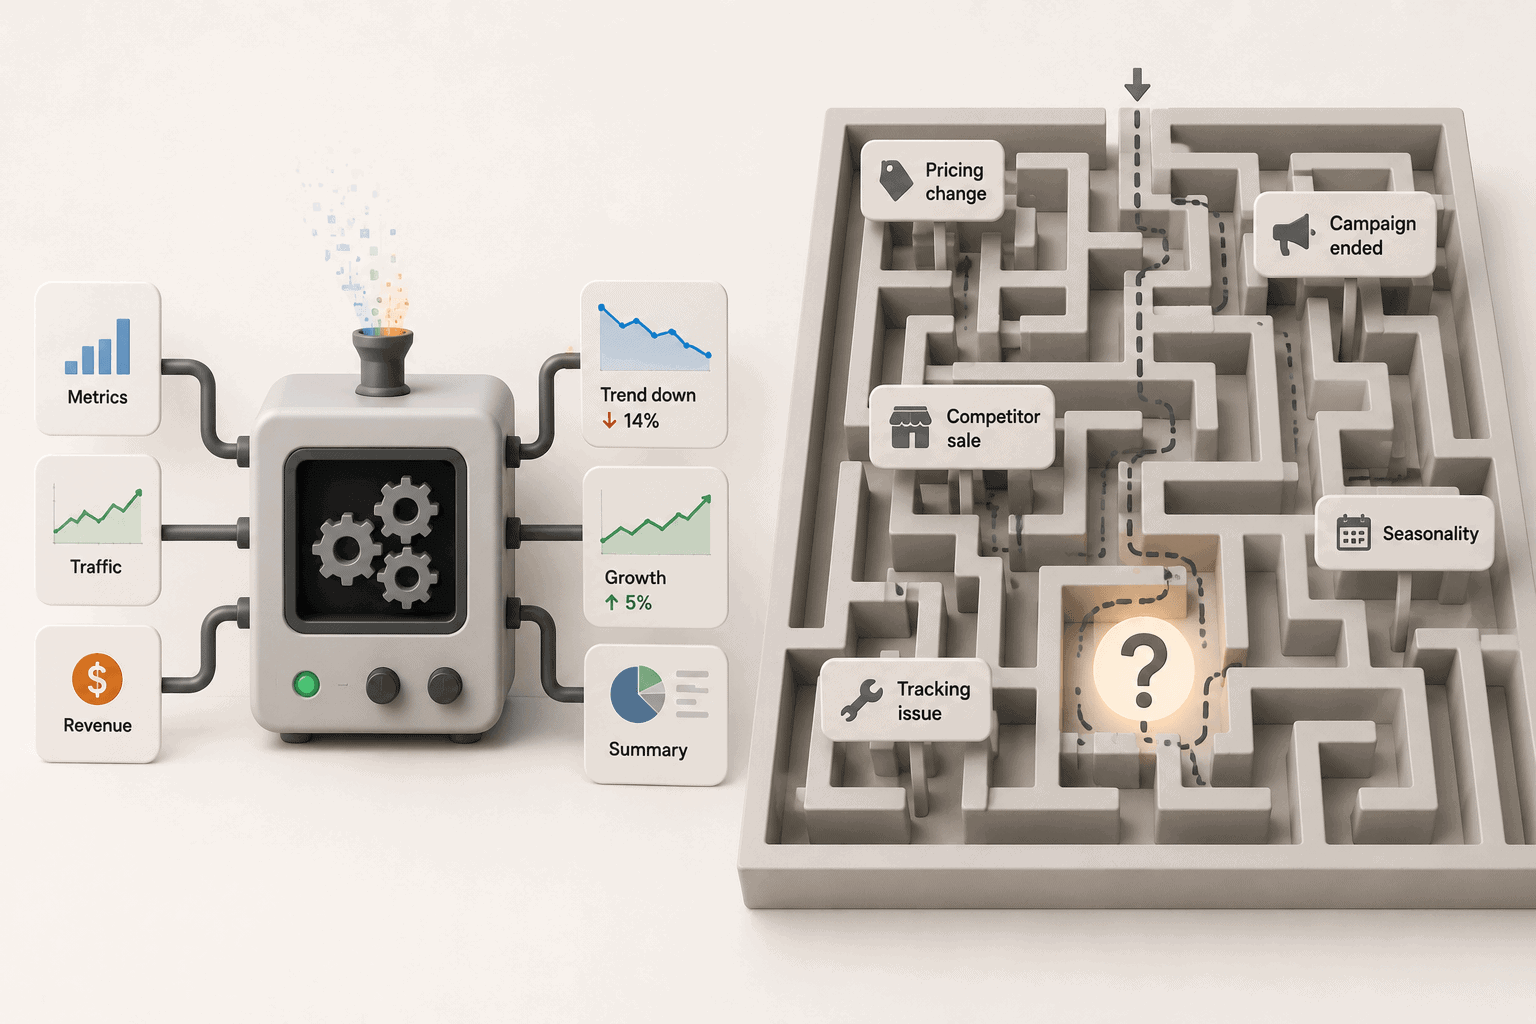
Diagnosis is a different animal.
To tell you why revenue dipped, the tool has to know things that do not live inside the dataset:
- That you changed the pricing page on Tuesday
- That a campaign ended Thursday
- That a competitor ran a sale all week
- That last January dipped too, and it turned out to be nothing
The cause almost never lives in the data. The cause lives in the context around the data, and the context is messy, scattered, and mostly stored in someone’s head.
Description is a problem you can finish. Diagnosis is a problem that keeps asking you for more.
And it gets harder from there, not easier. Because even once you crack the “why,” you walk straight into a second problem that has nothing to do with how smart the tool is.
It has to do with how much it says.
And here is where the two ideas meet. You cannot diagnose what matters until you have decided what matters. Diagnosis is judgment applied to data.
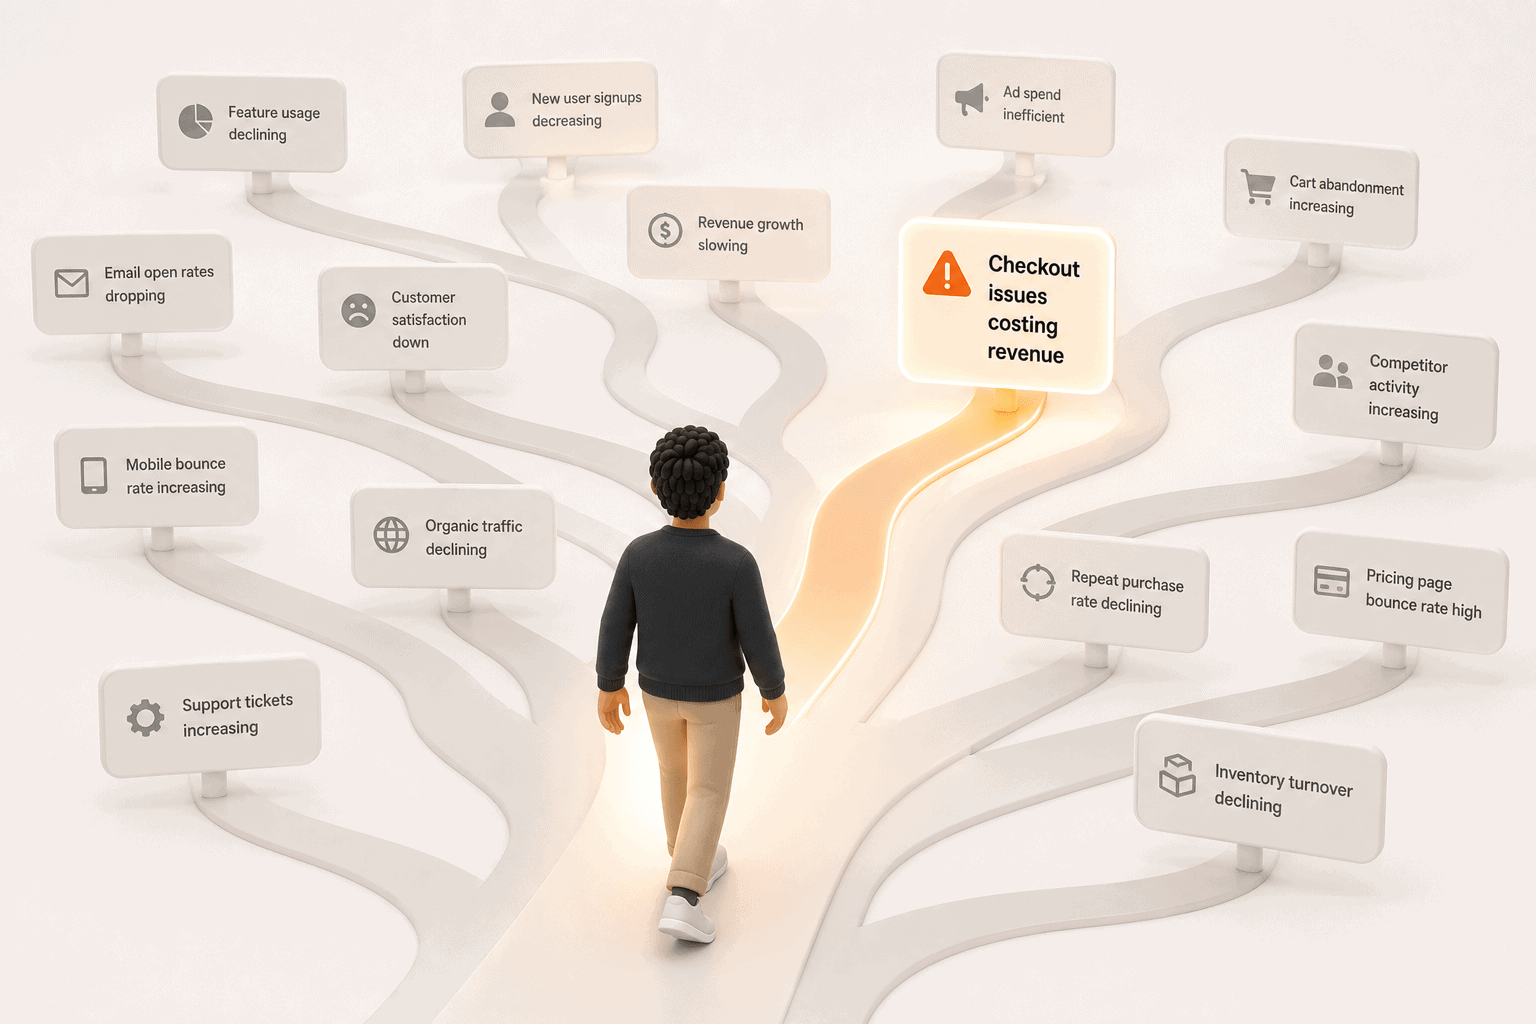
Before a tool can tell you why the thing that matters happened, it has to first decide which of the hundred things is the one worth explaining. The “why” is useless if it is the why of the wrong thing.
So the diagnosis problem turns out to sit on top of a deeper one. The deciding.
More insight, less clarity
This is where the deciding starts to bite.
You would think the answer is more insights. Surface everything the tool notices, and the important thing is in there somewhere.
It is. That is exactly the problem.
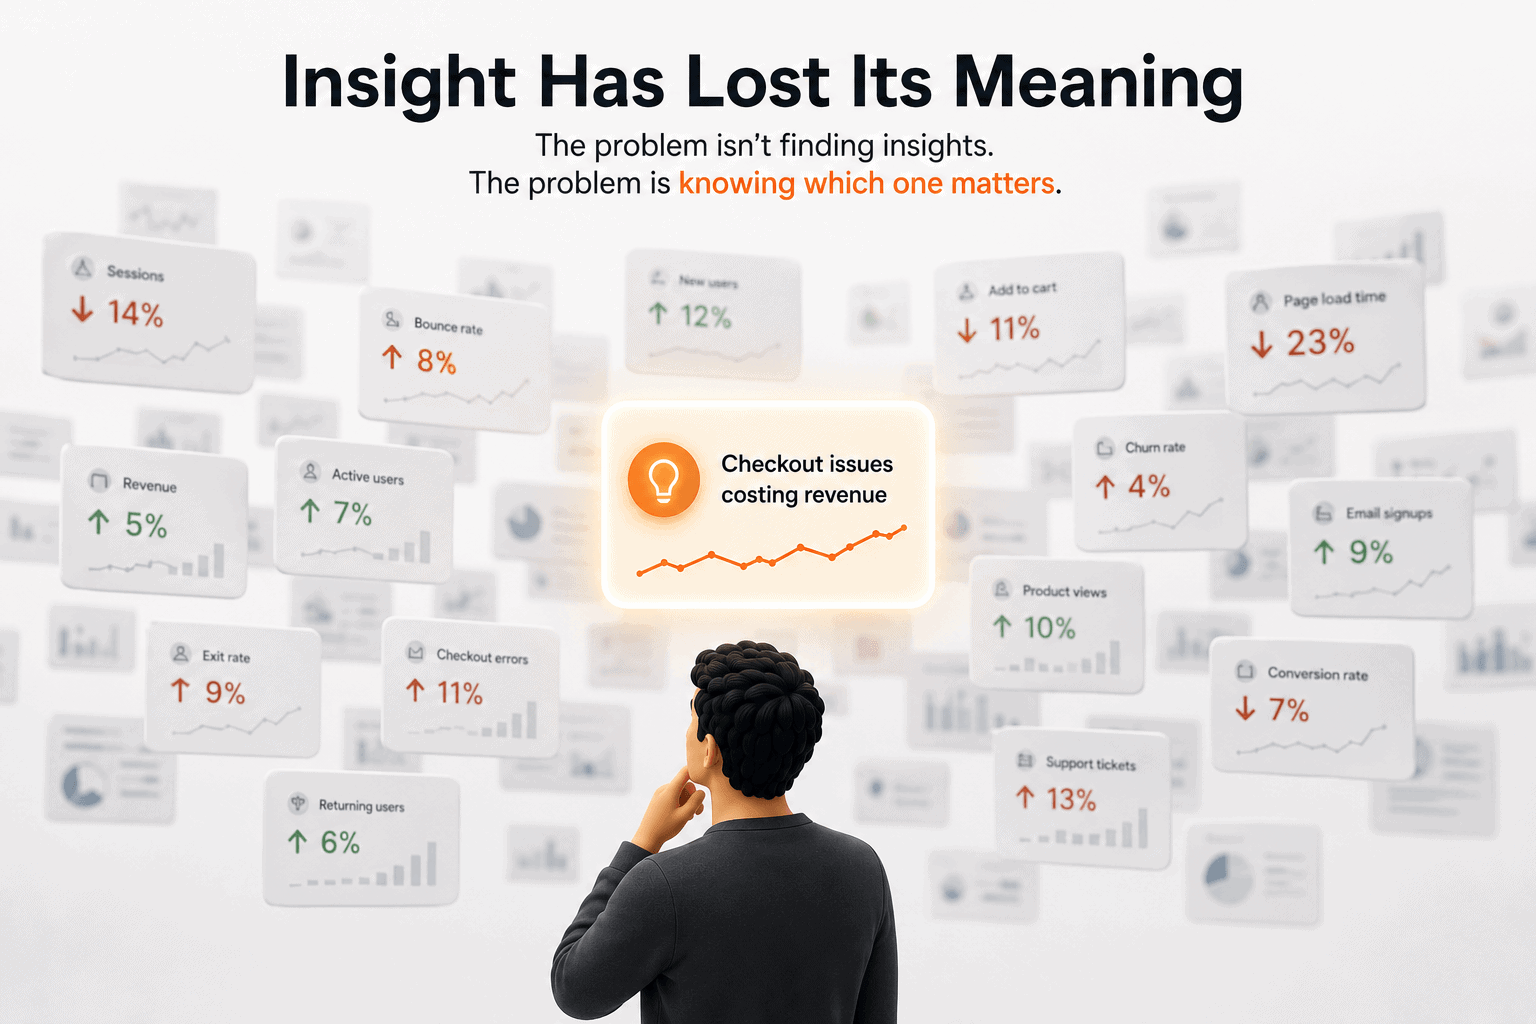
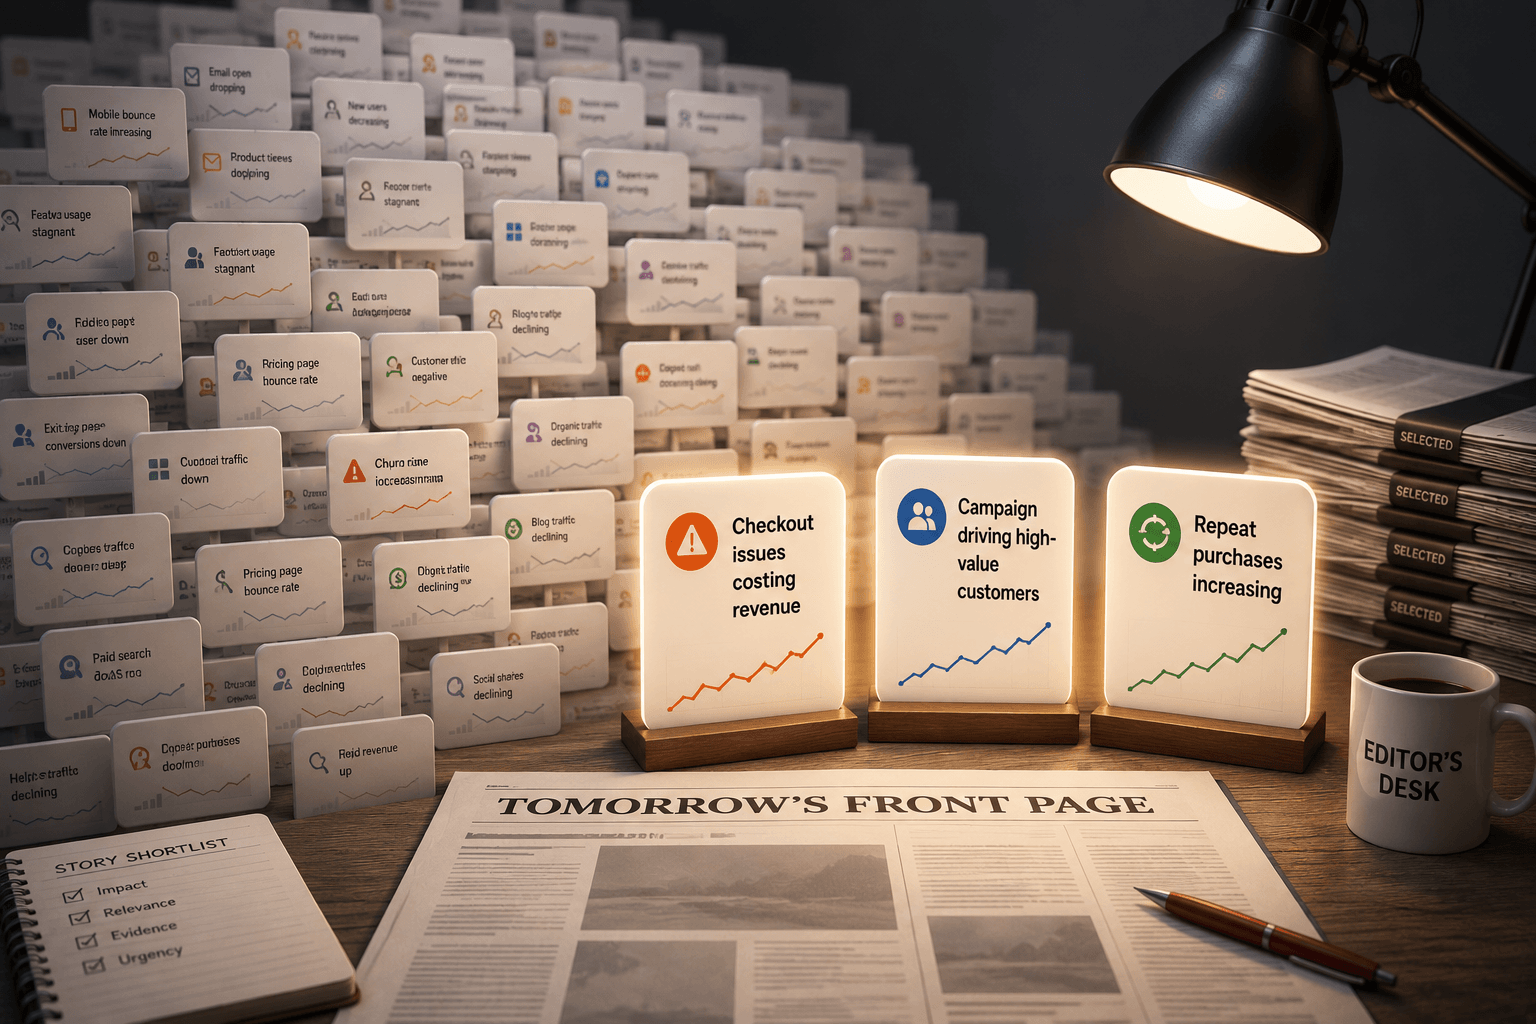
When a tool flags everything, the one insight that matters drowns. Your store had a good week and a checkout bug and a slow product page and a returning-customer dip and ten other true things.
The tool lists all fourteen. And now you, on a Monday morning, with a coffee and ten minutes, get to work out which one actually matters.
The tool did its job. It just handed the hard part back to you.
A tool that surfaces everything has made no decision at all. It has moved the deciding onto you.
Insights behave the same way. Past a certain point, each new one does not make you more informed. It makes you less able to move.
And the cost is not the work of generating it. The cost is your attention, which is the one thing nobody can give back to you.
The most useful thing a tool can do is often to say less. To have decided, before anything reached you, that thirteen of those fourteen things were not worth your morning.
That decision, what to leave out, turns out to be the hardest thing to build. And it is not a feature you bolt on at the end. It is editorial judgment, and it is the whole job.
The editorial problem
Here is the realization that reorganized how I think about this whole space.
The hard part of analytics is not the analysis. It is the editing.
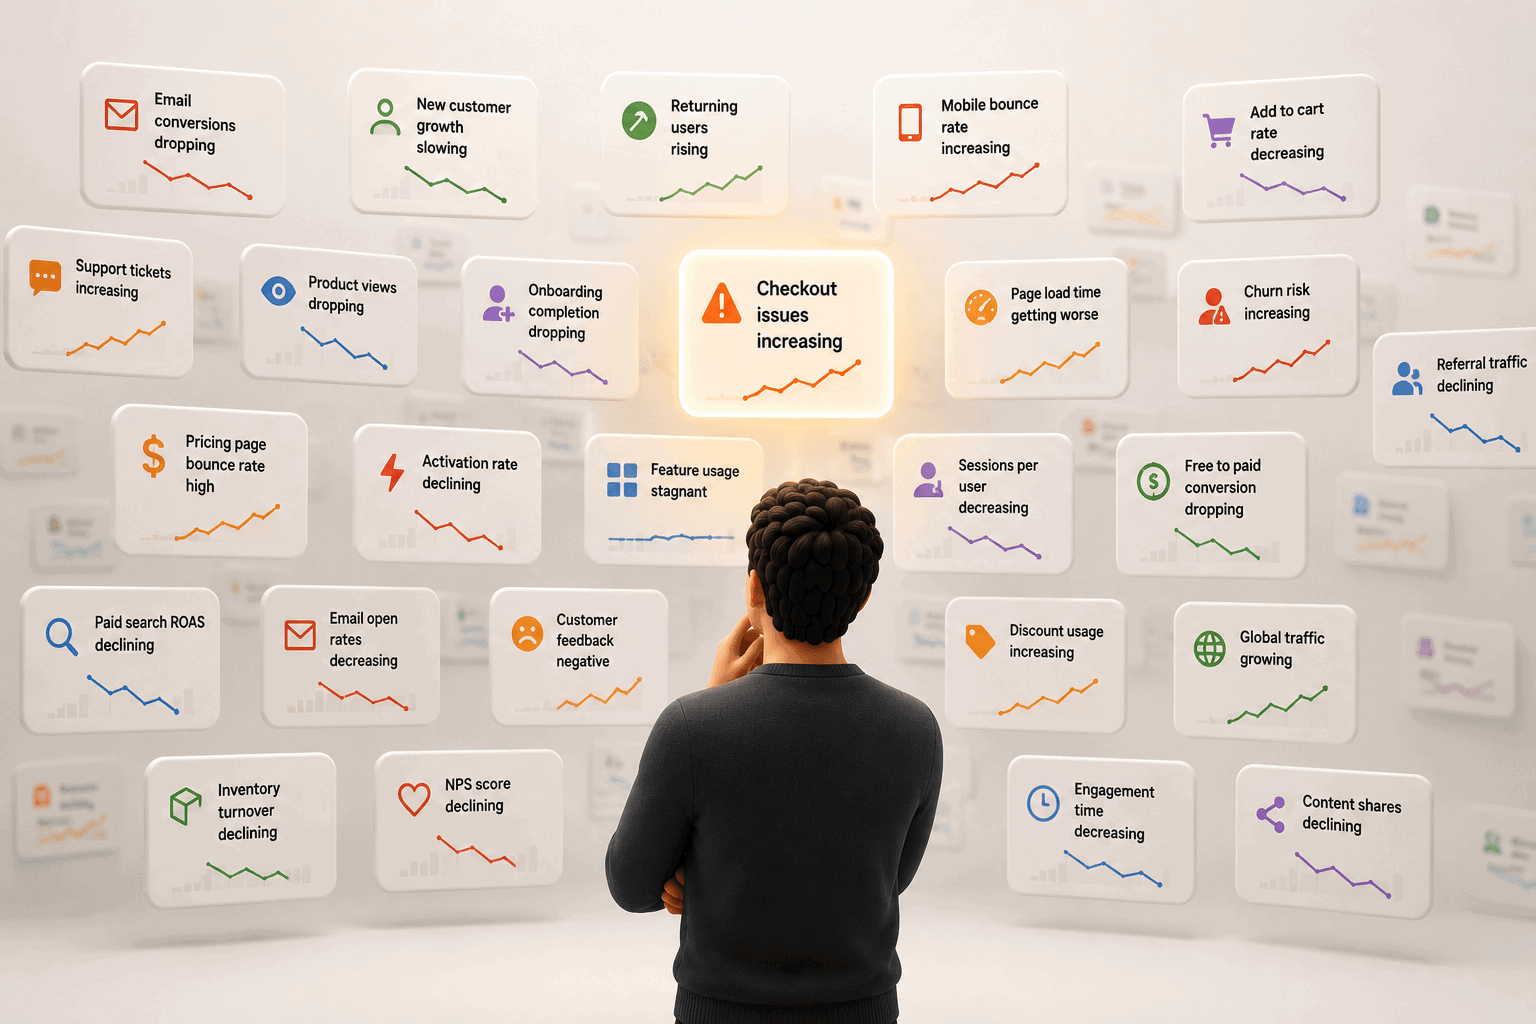
A tool that narrates your data tells you everything that happened. Sessions here, revenue there, this cohort up, that page down. It is a running commentary on your business: accurate, complete, and almost useless. Because a complete account of everything is, in practice, the same as no account at all.
Guided action is the opposite of narration. It does not tell you the hundred things that happened. It tells you the one thing to do.
The distance between those two, between narrating the data and guiding the action, is the entire problem. And it is not a gap in computing power. It is a gap in judgment.
Strip away the newsroom and the job is just this: looking at everything that happened and deciding what is worth someone’s attention. That is not a reporting skill. It is a judgment skill. And it is exactly the skill analytics tools have never had.
Your store generated a hundred true facts last week. Finding all hundred is the easy part. Deciding which three belong on your front page this morning, and letting the other ninety-seven go, is the hard part.
Anyone can generate a thousand insights. The skill is deciding which one you say out loud.
This is the editorial intelligence problem, and it is the thing I keep colliding with as we build. Real diagnostic analytics is not just answering “why.” It is first deciding which “why” is worth answering.
Generating candidate insights was the first week of work. Teaching a system which ones deserve to be surfaced, and why, and which to stay silent about, has been the work of every week since.
Most tools never even attempt it. They narrate brilliantly and decide nothing.
Surfacing means taking a position
Here is the part nobody likes to admit.
To decide what matters, a tool has to be willing to be wrong.
An editor who only ever runs the safe, obvious story runs a boring paper that no one trusts. The editor earns trust by taking a position. By saying this is the thing today, knowing they might be wrong about it.
Judgment is not the absence of risk. Judgment is the willingness to take the risk and own it.
Most analytics tools are built to avoid exactly this. Surfacing everything is the safe move. If the tool shows you all fourteen things, it can never be blamed for missing one.
It has quietly traded usefulness for deniability. It refuses to be wrong, and in refusing, it refuses to be useful.
But there is a deeper reason tools struggle to take a position, and it is the one that matters most.
To know what is worth surfacing, you have to know what actually moves the business. And most tools can only see half of it.
A tool that watches only your website traffic can tell you sessions dropped. It cannot tell you whether those sessions were ever going to buy.
A tool that watches only your revenue can tell you sales dipped. It cannot tell you why. Each one sees a slice, takes its best guess, and hopes the slice it happened to see is the slice that mattered.
You cannot edit a story when you can only read half the page.
Real editorial judgment in analytics needs the whole picture. It needs to see the behavior and the money in the same frame.
To know that a traffic source is not just sending visitors, but sending the visitors who actually pay. To know that a checkout dip is not a rounding error, but the leak draining this month’s revenue.
The insight that deserves your front page is almost always the one where behavior and money meet. A tool that sees only one of them is editing blind.
The bar
For twenty years, analytics tools have competed on who can describe your data most completely. More charts. More metrics. More insights, faster.
That race is over, and it was the wrong race.
The next one is about judgment. About which tool can look at the hundred true things that happened to your business and tell you the one that matters this morning. Not narrate. Decide. And to decide, it has to see the whole picture: what your customers did, and what it did to your revenue, in the same place, at the same time.
Descriptive analytics is solved. Diagnostic analytics is the frontier. And the tool that finally connects what happened to what it cost you is the one that stops describing your data, and starts diagnosing it.
That tool is closer than you think.