
I have spent years thinking about everything wrong with analytics.
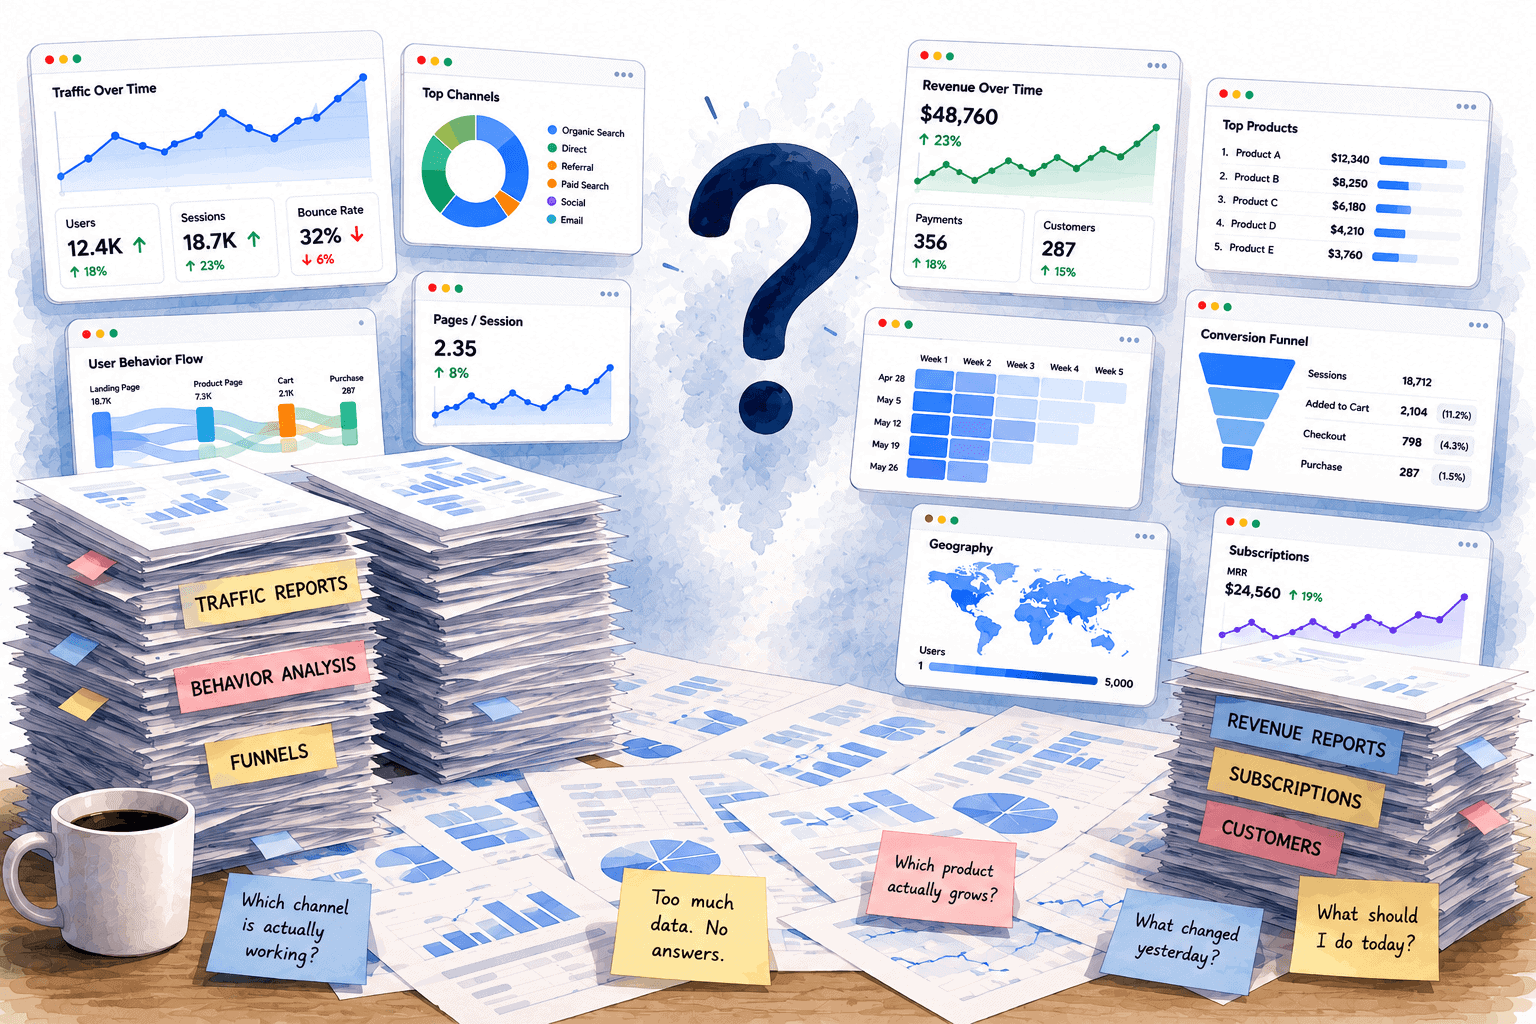
About how founders open Google Analytics and walk away with data but no answers.
About what separates a useful insight from a number wearing a percentage sign.
About why nearly every tool describes your data instead of diagnosing it.
That is a lot of time spent on the problem.
At some point, complaining about a thing stops being useful. So I went looking for the solution instead. Something I could point a founder to and say, “Here, this is the answer.”
I could not find one. So I built it myself, analytics for founders who do not have time to be their own analyst.
Here is what I built, and why.
What I found instead
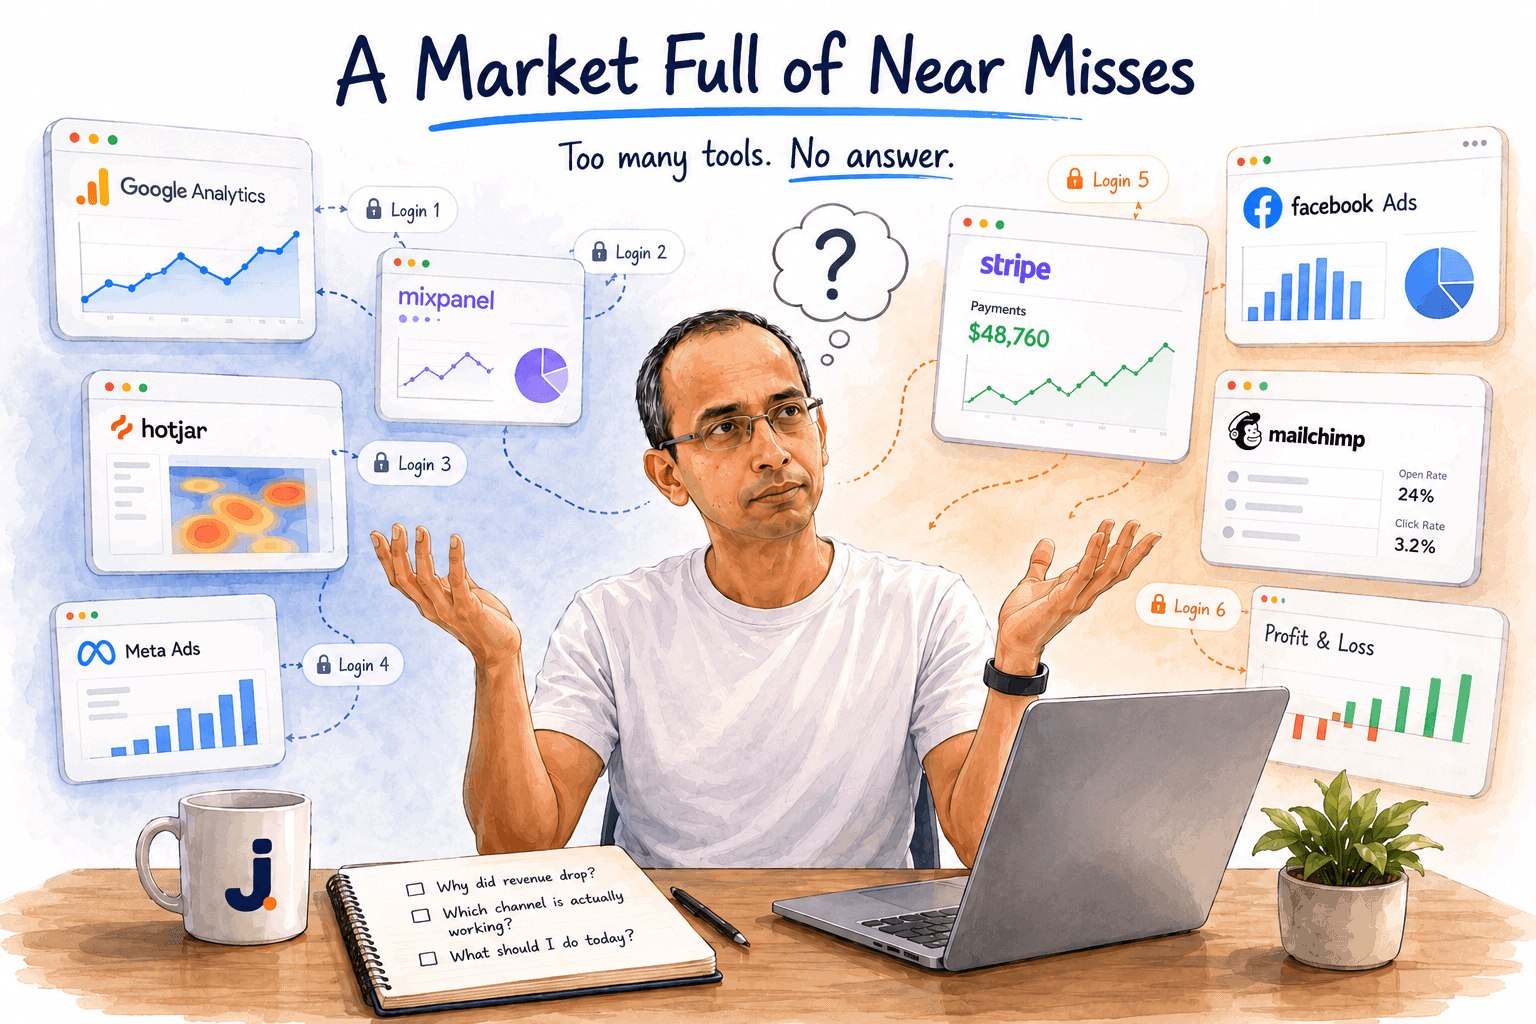
A market full of near-misses.
- Too fragmented: Some answers worked, but only if you stitched together four or five tools. Each one had its own login, its own dashboard, its own bill. And you still had to do the thinking yourself, in the gaps between them.
- Too expensive: Others were built for big companies with a data team and the budget to match. Made for the enterprise, sold to the enterprise. Out of reach for a founder doing $400k a year who needs an answer before lunch.
- Too incomplete: Some came close, but they only saw half the picture. Your traffic, or your money. Never both, in one place, working together.
So I stopped waiting for someone else to build it.
What I actually believe about analytics
I started with a simple conviction.
A founder should not have to be an analyst to understand their own business.
Every tool I had used assumed the opposite. They handed you the raw material, the charts and the filters and the hundred metrics, and quietly trusted you to do the hard part yourself. To know which number mattered. To work out why it moved. To decide what to do about it.
That is not a tool. That is homework.
So the thing I wanted to build started from a different place. Not “here is your data, go figure it out.” Instead: here is what changed, here is why, here is what to do next.
The analyst’s job, done for you.
Two beliefs shaped everything after that.
The first is that an insight has to take a position. A tool that surfaces all forty things it noticed has not actually helped you. It has just moved the sorting onto your desk.
Real help means having the judgment to say, ignore those thirty-nine, this is the one, and here is what I would do.
The second is that you cannot take that position from half the picture. Behavior without money is a guess. Money without behavior is a mystery. To know which insight actually matters, a tool has to see what your customers did and what it did to your revenue, in the same frame, at the same time.
Most tools see one or the other.
The whole thing falls apart without both.
So I built it
It is called Jeano.

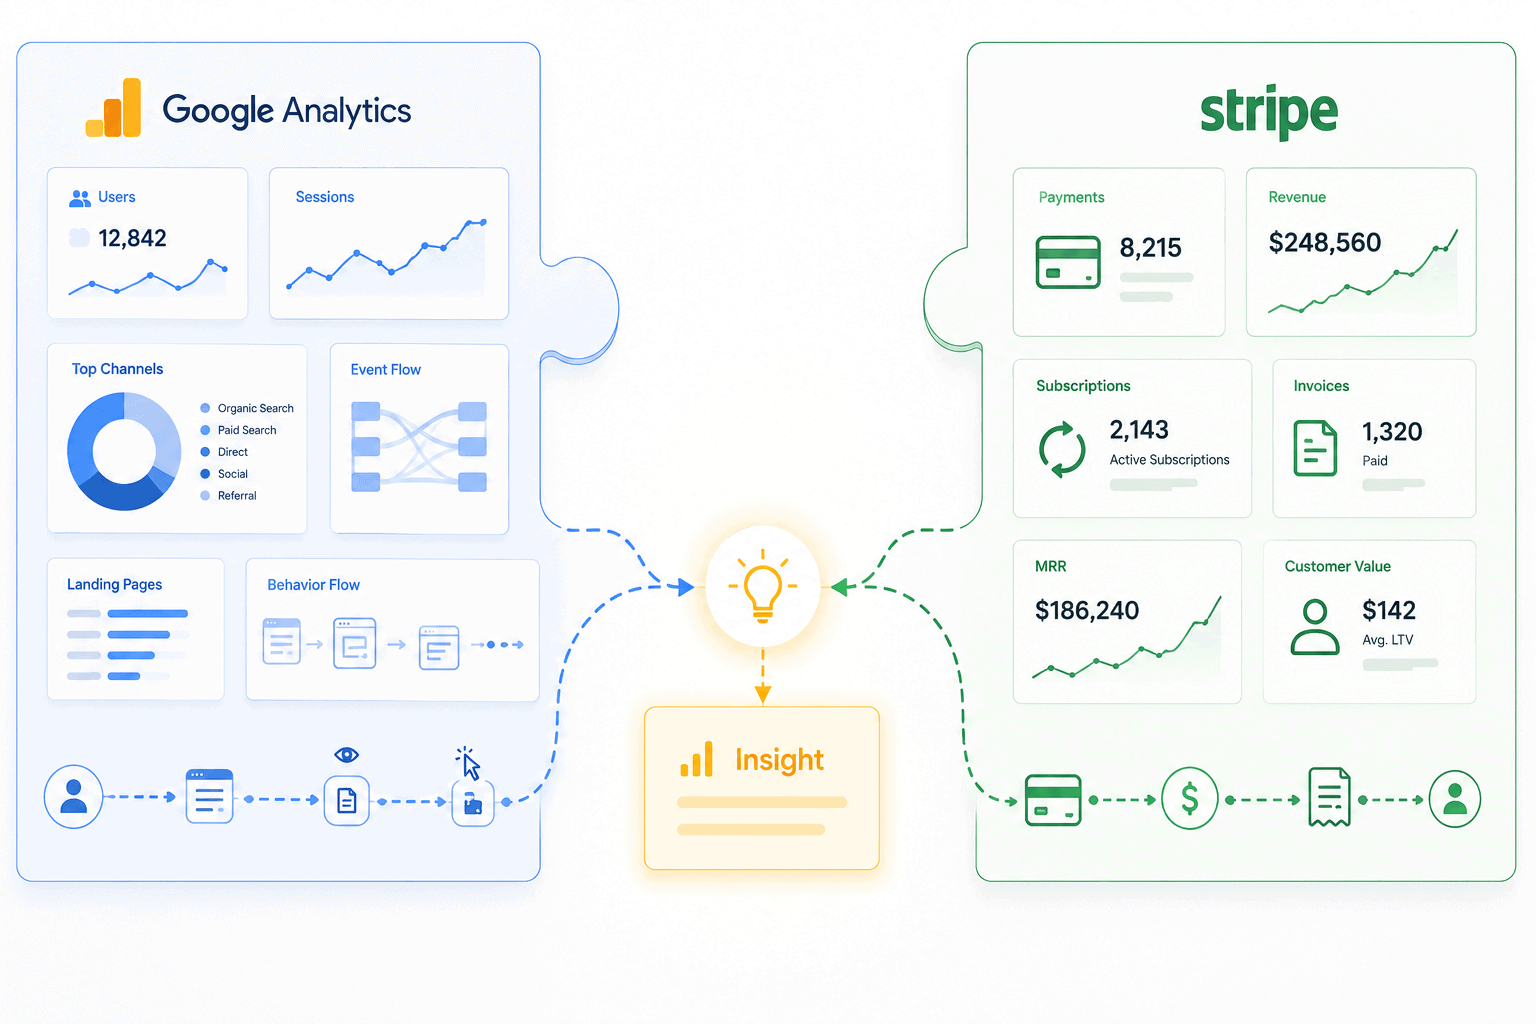
Jeano connects to two things you already use. Google Analytics, which knows what your visitors did, and Stripe, which knows what they paid. Then it does the part no other tool does. It reads both together, the way a good analyst would, and every morning it hands you a short written brief.
And here is the part that actually matters. Jeano does not show you everything it finds. It decides what you need to know, and leaves the rest out.
A brief, in plain English. Written the way a person would explain it, not the way a dashboard reports it. No jargon to decode, no metrics to look up. Just a clear account of what happened and what it means for your business.
Here is what that looks like in practice.
Open Google Analytics on a Monday and you might see this:
- Sessions down 18%
- Revenue down 12%
Two true numbers, and no idea what to do with them.
Here is the same week, the way Jeano puts it:
Revenue dropped 12% this week, and paid traffic is the reason. Facebook traffic fell 47% after a campaign quietly stopped delivering, an estimated $3,240 in lost revenue. Organic traffic held steady, so this is not a demand problem. Start by checking the Facebook campaign before you touch landing pages or pricing.
Same data underneath. One version makes you open six more reports to work out what happened. The other reads like a note from someone who already did.
And that is where the name comes from, too.
The name does not stand for anything clever. I wanted something that sounded like a person, because that is the point. Jeano is meant to feel less like software you operate and more like someone who works for you.
Someone who reads the numbers so you do not have to, and tells you the one thing that matters while there is still time to act on it.
Why it starts with Google Analytics and Stripe
I could have connected Jeano to a dozen sources on day one. I chose not to.
Not because it will stay this way. More sources are coming, and soon. But everything has to start somewhere, and I wanted to start where it matters most.
Because the most important question a small business has is almost always the same one, and it lives exactly where these two tools meet. Did the traffic turn into money? Not did traffic go up. Not did revenue move. Did the people who showed up become the people who paid?
That question needs both halves to answer. What people did, and what they paid. On their own, each gives you only a partial picture, and a partial picture is often worse than none, because it feels like an answer while pointing you the wrong way.
Put them together, though, and the partial views become a complete one:
- The campaign that drove a flood of visitors who never bought stops looking like a win.
- The quiet channel that sends fewer but better people finally gets its credit.
- The drop in revenue gets a cause instead of a shrug.
That is the wedge. Behavior and money, read together, so the insight that was always hiding in the gap finally has somewhere to live.
This is where Jeano starts, not where it stops. We begin where the most valuable answer lives, and we go wider from there. More sources, more of the picture, soon.
How Jeano works
Three things arrive every morning, without you opening anything.
The brief: A short, written summary of what happened since yesterday. It reads like a note from someone who already did the analysis. One morning it might open with “Checkout load time crossed five seconds yesterday, and it cost you a 20% drop in completed orders.” A headline you understand instantly, a plain explanation underneath, and the few things worth doing about it today. On your dashboard, or in your inbox before you sit down.
What’s working, what’s dragging: Each week, Jeano pulls out the few metrics that actually moved the needle. The things gaining momentum, and the things quietly dragging you down, each with the cause and a suggested action attached. Not “conversion changed.” Instead, “conversion dropped on mobile checkout, here is what it is costing you, here is what to fix first.”
Your business health, in one number: A single read on how the business is doing, from zero to ten, that you can take in at a glance. Click it and the number opens into the parts that built it, so you can see exactly what is lifting the score and what is pulling it down.
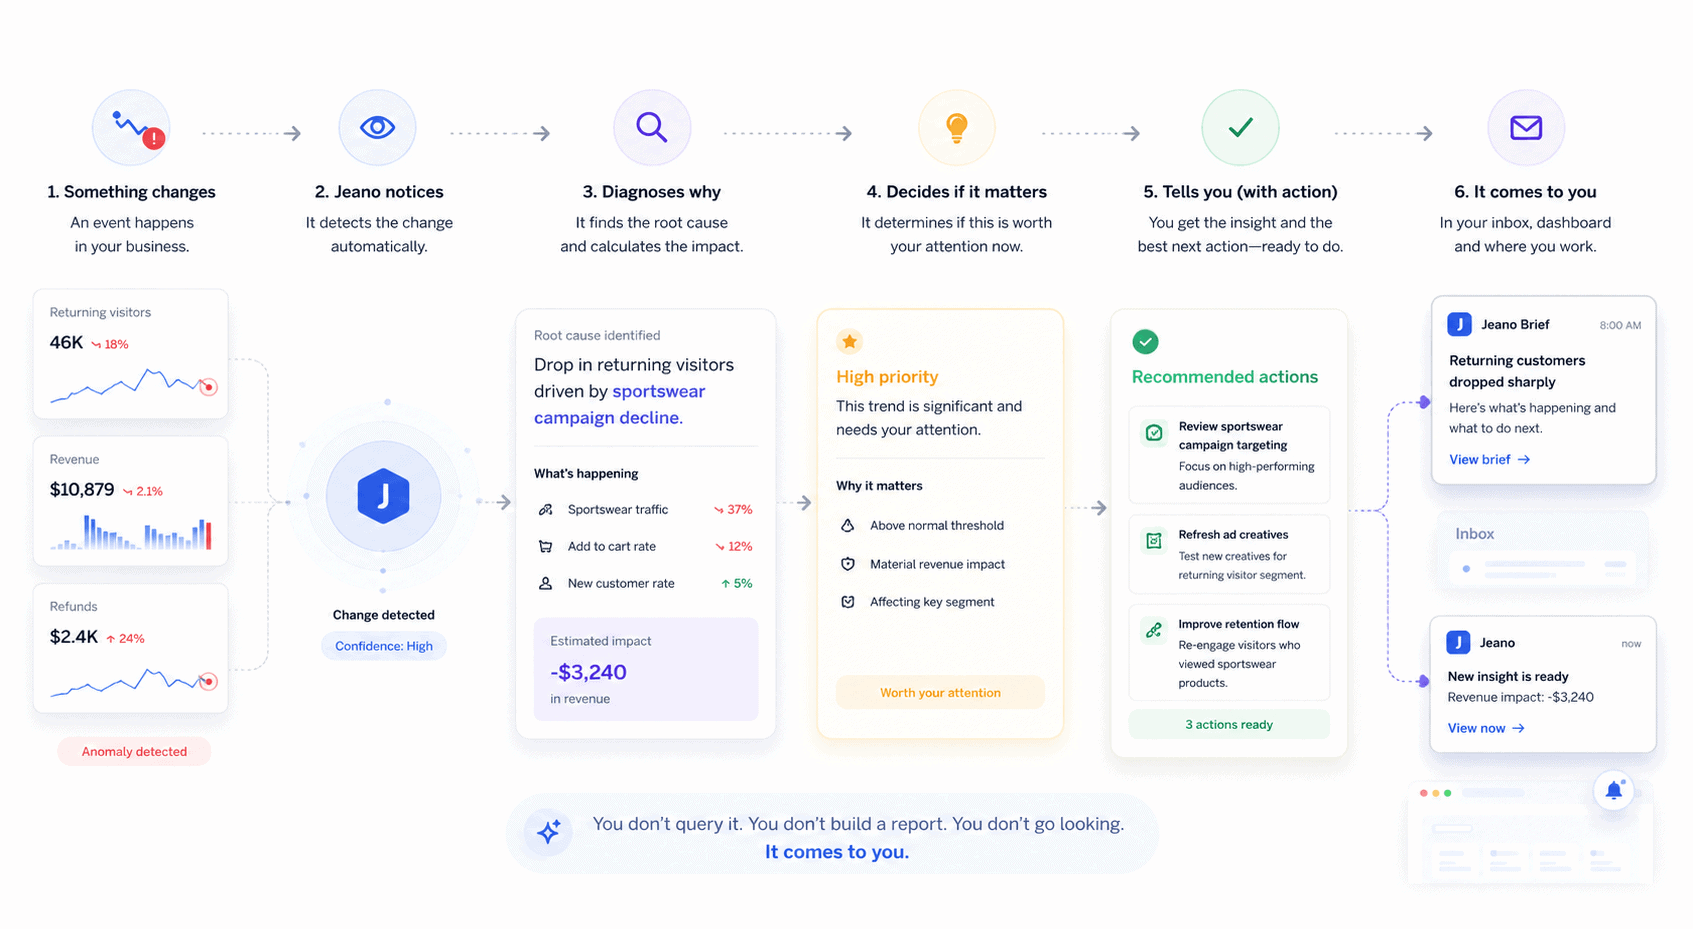
That is the whole loop. Something changes in your business. Jeano notices, works out why, decides whether it is worth your attention, and if it is, tells you, with the action attached.
You do not query it. You do not build a report. You do not go looking.
It comes to you.
The hard part is deciding what not to tell you
Here is the thing that is easy to miss about Jeano.
The clever part is not that it can find insights. Finding insights is the easy part. Any tool with access to your data can generate a hundred true observations before breakfast.
The clever part is that it decides which one you actually need, and stays silent about the other ninety-nine.
That deciding is the whole game. It is also the hardest thing to build, because it cannot be brute-forced. Surfacing everything is trivial and useless. Surfacing the right thing requires judgment, the same judgment a good analyst spends years developing:
- Knowing that this dip matters, and that one is just noise.
- Knowing a founder does not need to hear about a 2% wobble in a metric that does not move the business.
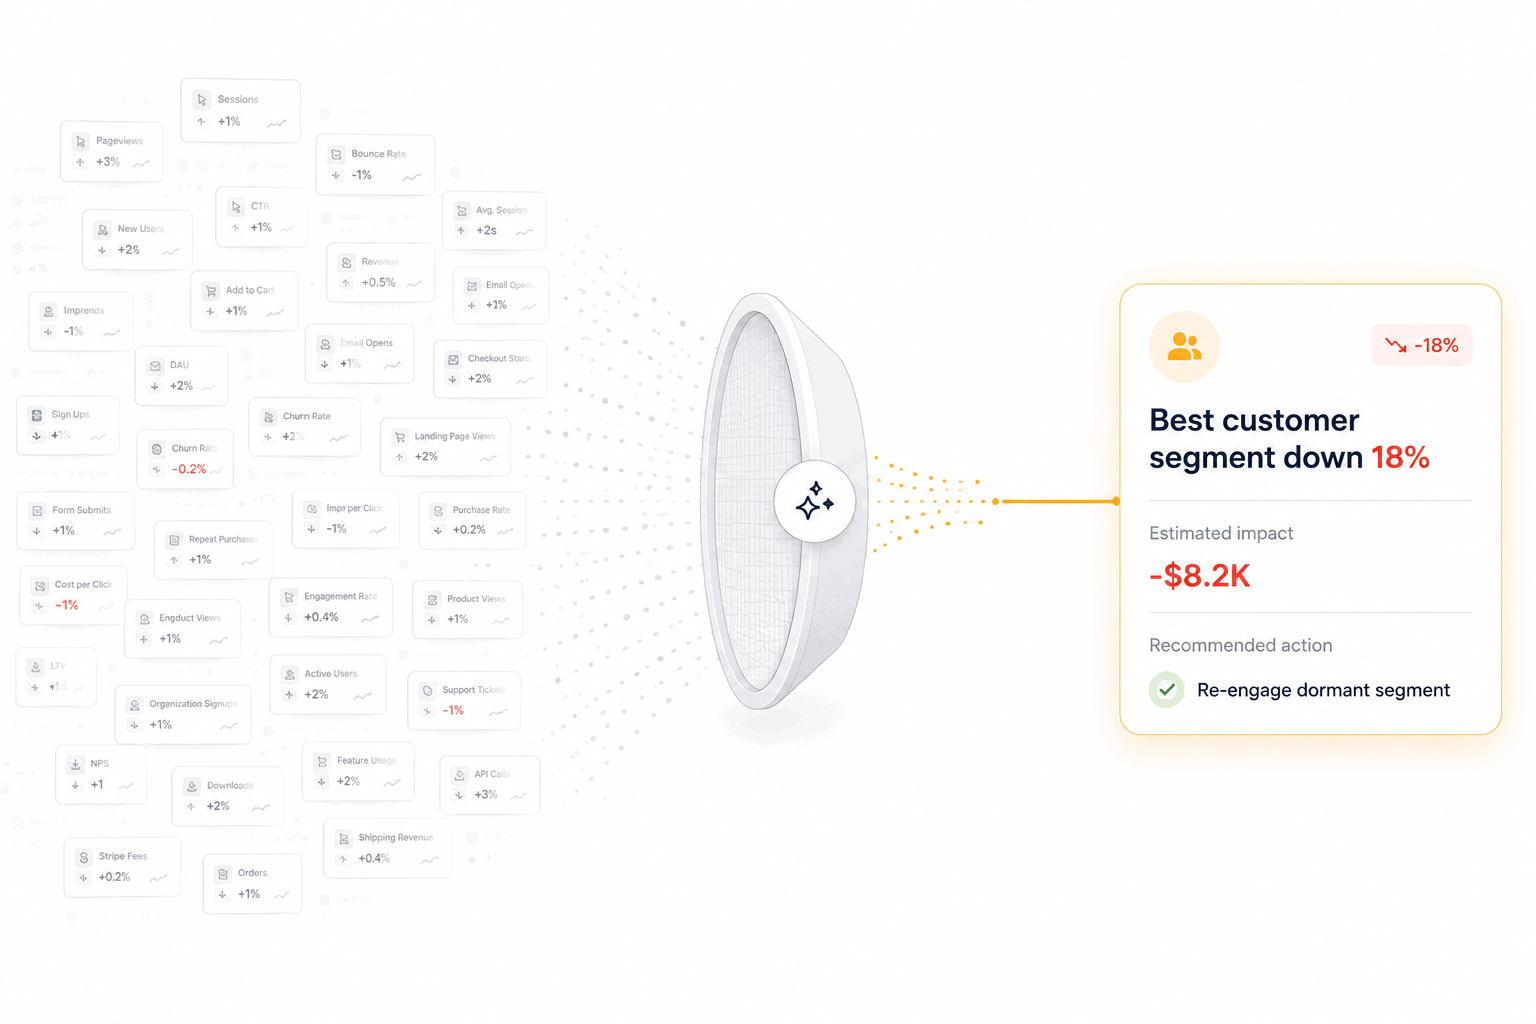
- Knowing they absolutely need to hear that their best customer segment has gone quiet.
This is why seeing both behavior and money matters so much. You cannot decide what is important from half the picture. The judgment only works when the two halves sit together.
Jeano is built to take a position. To look at everything that happened, and then do the uncomfortable, valuable thing that most tools refuse to do.
It tells you what to ignore. And it tells you what to do.
This is the beginning, not the finished thing
I want to be straight with you about where Jeano is today.
Right now it connects to Google Analytics and Stripe. Two sources. That is deliberate, and I have told you why; it is where the most valuable question lives. But I am not going to pretend it is the whole picture, because it is not, yet.
Your business runs on more than two tools. Your ad spend lives in one place, your email in another, your support tickets, your inventory, your subscriptions, each in its own corner. Every one of those holds a piece of the picture Jeano will eventually read.
So here is the plan, said plainly. Jeano starts with behavior and money because that pairing answers the most questions for the most businesses on day one. From there, it widens. More sources, more of the picture, more of the gaps closed, one connection at a time.
Stop doing the analyst’s job yourself
You have been doing the analyst’s job for years. Opening the dashboards, hunting for the story, guessing at what matters and hoping you guessed right.
Jeano is the offer to stop. To let something else do the reading, so you can get back to the part that actually needs you, which is the deciding. It is analytics for founders who would rather make the decision than dig for it.
Jeano is opening up to a first group of founders. If you are tired of opening Google Analytics and closing it again with nothing, this is the moment to get in early. The waitlist is open now, and the first founders on it get first access.
- Revenue analytics for eCommerce: 5 tools that show the full picture
- What is descriptive analytics? 5 examples (Harvard Business School Online)
- Detailed analytics, metrics and insights for eCommerce
- Actionable, privacy-compliant analytics for eCommerce
- eCommerce data consolidation: connect 17+ sources in one place