
You had a good month. You can feel it. But when you sit down to pull the numbers, Shopify, Stripe, and GA4 are all telling different stories.
Which one do you report to your team? Which one do you actually believe? That confusion has a name, and a fix.
This guide covers what revenue analytics really means for eCommerce stores and the five tools that give you one number worth trusting.
What is revenue analytics for eCommerce?
Revenue analytics is the process of tracking, measuring, and making sense of the money your store actually earns. Not just traffic. Not just orders.
The full picture, which products are driving revenue, which customers keep coming back, which channels are worth your budget, and where money is quietly leaking out.
The problem is that most eCommerce stores don’t have one place where all of this lives.
You have Shopify for orders, PayPal or Stripe for payments, GA4 for traffic, and maybe a separate tool for email. Each one shows a slice. None of them show the whole thing.
That’s the gap revenue analytics is supposed to close.
Why your revenue numbers don’t add up
If you’ve ever tried to reconcile your Shopify revenue with your Stripe payouts and your GA4 reports, you already know this feeling.
The numbers are never the same. And the gap isn’t random. It’s structural.
Here’s what’s actually happening.
The same sale gets counted multiple times
A customer buys on your Shopify store and pays via PayPal. That one transaction now appears in Shopify as an order and in PayPal as a payment.
If you’re pulling reports from both, you’ve just counted one sale twice. Add Stripe, WooCommerce, and Amazon to the mix and your reported revenue becomes fiction.
GA4 misses more than you think
When a customer checks out through PayPal, Shop Pay, or Apple Pay, they leave your site and return after payment. That redirect breaks the GA4 session.
The purchase often doesn’t get recorded. On average, GA4 undercounts eCommerce revenue by 10 to 20%. For stores with high PayPal usage, that gap can be significantly wider.
Ad platforms overclaim everything.
Meta says it drove $14,000 in sales. Google claims $18,000. Your Shopify dashboard shows $11,500 for the same period. All three are correct by their own logic.
Completely useless for making budget decisions. Every platform measures its own contribution in isolation and has every incentive to look good on your report card.
Manual reconciliation eats your week.
Merchants managing multiple channels report spending 10 to 15 hours every week pulling reports from different dashboards, normalising currencies, deduplicating transactions, and building a view that should already exist in one place.
The result is that most eCommerce sellers are making pricing, inventory, and marketing decisions based on numbers they can’t fully trust. That’s not a data problem. That’s a revenue problem.
5 best revenue analytics tools for eCommerce in 2026
No single tool does everything. The right one depends on where you sell, how many platforms you’re on, and what problem you most need to solve. Here’s an honest breakdown of the five best options.
1. Google Analytics 4: best free baseline for traffic and conversions
GA4 is where most eCommerce stores start, and for good reason. It’s free, it integrates with Google Ads, and it gives you a solid foundation for understanding how visitors find your store and what they do before buying.
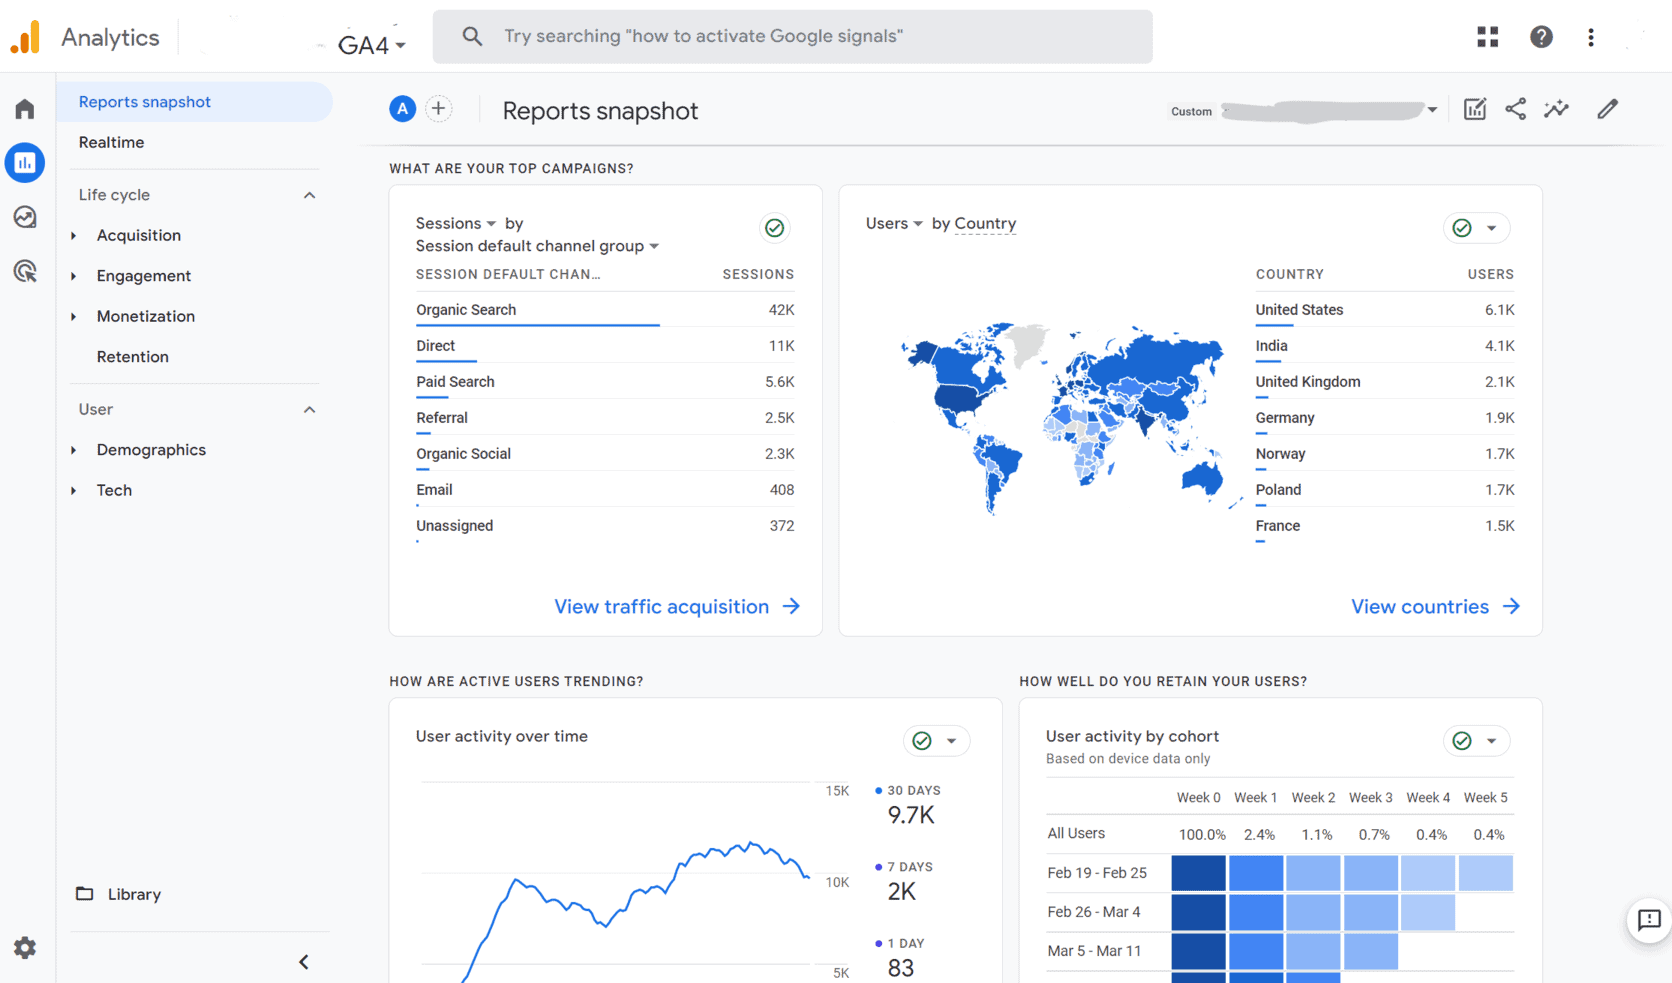
For revenue analytics, GA4 covers the full purchase funnel. You can track product views, add-to-cart events, checkout steps, and completed purchases.
The acquisition reports show which channels drive conversions, not just traffic. The Explorations section lets you build cohort analysis, funnel reports, and path analysis that reveal where revenue leaks happen.
Pricing:
- Free for most stores
- GA4 360 starts at approximately $50,000 per year for enterprise features and unsampled data
Best for: Every eCommerce store as a starting point. GA4 is the baseline, not the complete solution.
Limitations:
- Undercounts eCommerce revenue by 10 to 20% on average due to payment gateway redirects, ad blockers, and Safari ITP
- Only sees your website. Not your Amazon store, Etsy shop, or PayPal transactions
- Setup requires technical configuration. Common mistakes silently break revenue tracking for weeks
2. Triple Whale: best for Shopify DTC brands running paid ads
If your entire business runs on Shopify and you spend heavily on Meta, Google, and TikTok ads, Triple Whale was built for you. It’s the go-to analytics platform for direct-to-consumer brands that need accurate attribution across paid channels.
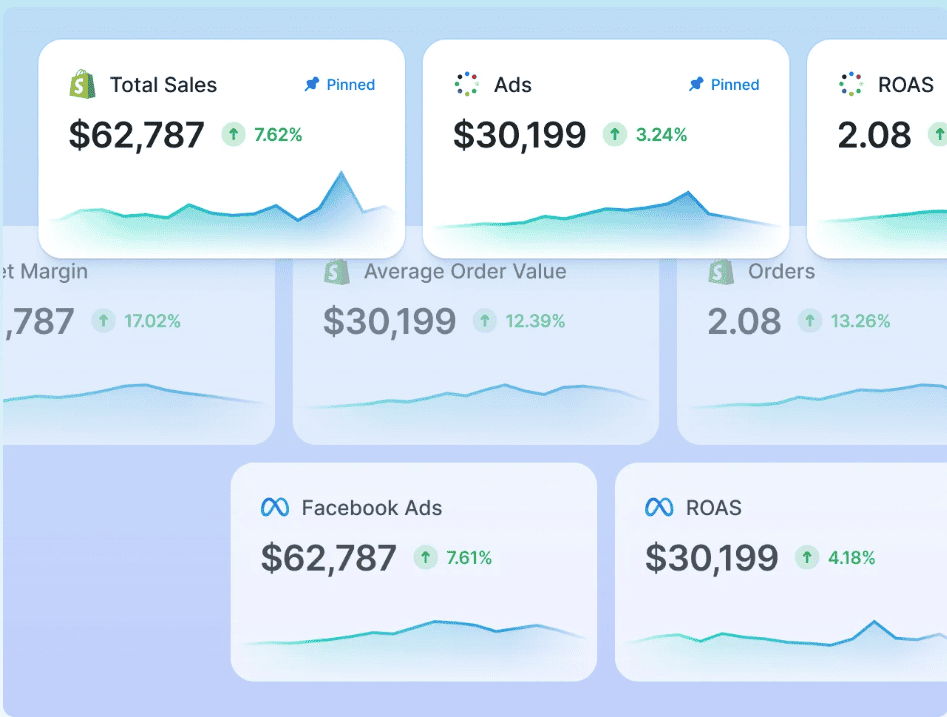
The core of Triple Whale is its first-party pixel (Triple Pixel), which tracks purchase data directly from your store and ties it back to specific ad clicks across every major platform.
This gives you a more honest picture of which campaigns actually drove sales, independent of what Meta or Google claim. The Moby AI assistant surfaces anomalies, answers questions about your data, and helps with budget reallocation decisions.
Pricing:
- Free Founders Dash tier with limited features
- Paid plans start at $149 per month (annual) for stores up to $2M GMV
- Brands at $5M to $7M GMV typically pay $1,100 to $1,300 per month
- Pricing scales with GMV. Your analytics bill grows as your store grows
Best for: Shopify-only DTC brands spending $5,000 or more per month on paid advertising who need reliable attribution and creative performance data.
Limitations:
- Shopify-only. No WooCommerce, Amazon, Etsy, or eBay support
- GMV-based pricing means costs jump unpredictably as revenue grows
- Some G2 and Trustpilot reviews flag attribution bugs and slow support response times
3. Polar Analytics: best for data-savvy Shopify teams
Polar Analytics positions itself as a modern BI tool for eCommerce. It delivers on that promise, but with a caveat. It’s powerful if you have a team that knows how to use it. It’s overwhelming if you don’t.
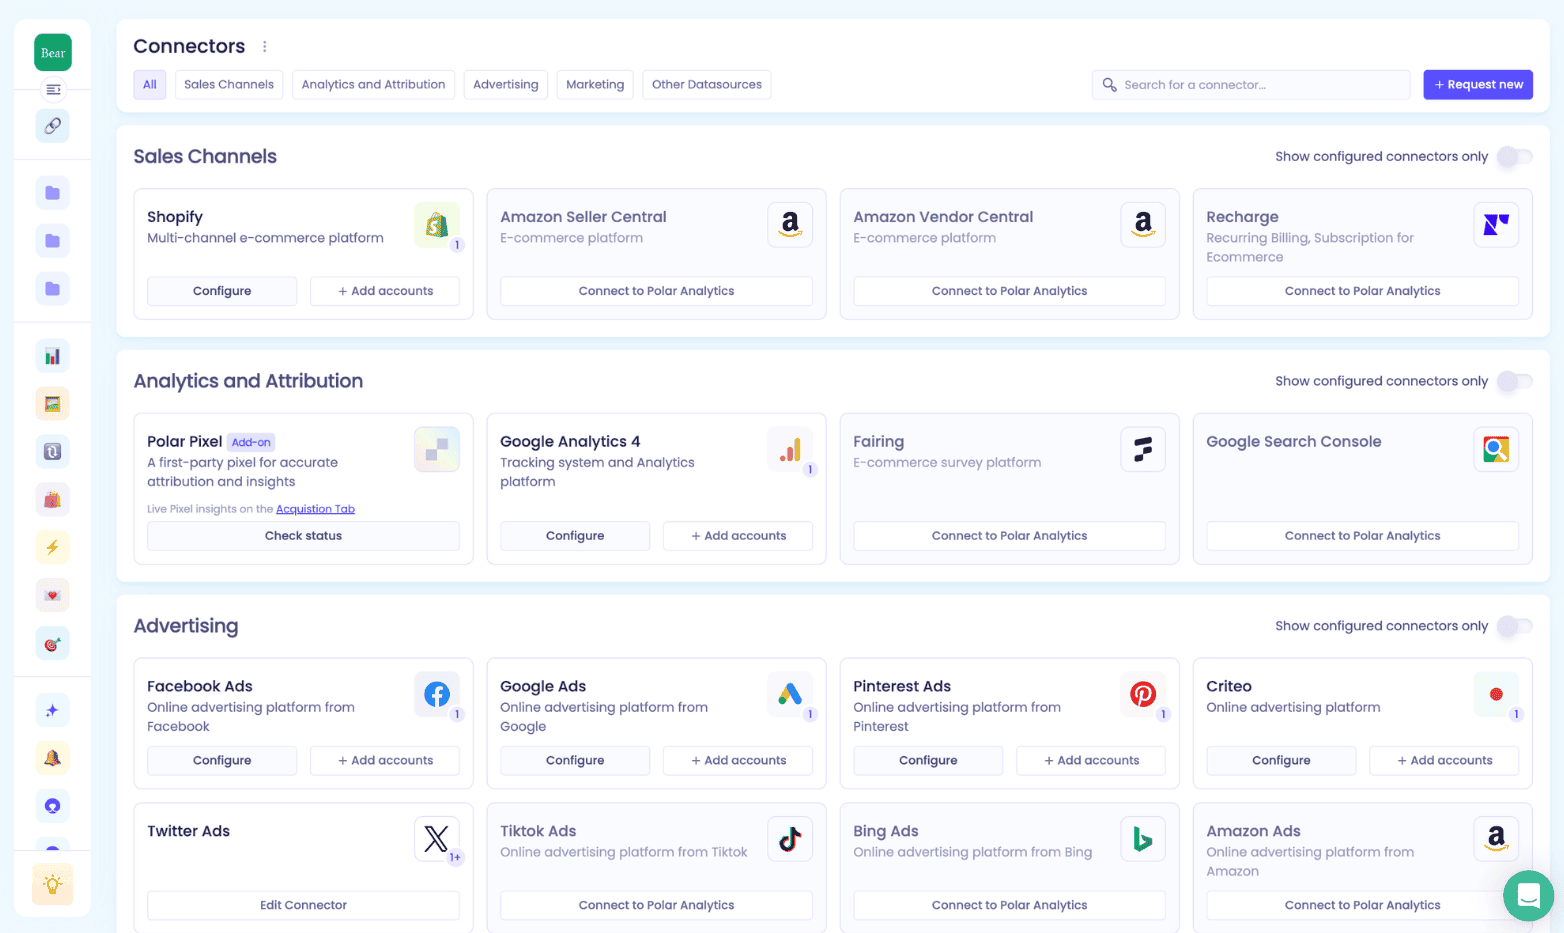
The standout feature is attribution depth. Polar ships its own first-party pixel with cross-device tracking, server-side CAPI enhancement for Meta and Google, and incrementality testing to measure the true causal impact of your campaigns.
Not just correlated credit. All of this feeds into customisable dashboards backed by a dedicated Snowflake database. The Ask Polar AI lets you query your data in plain English without building a custom report.
Pricing:
- Quote-only as of 2026. Pricing page no longer shows public figures
- Publicly available pricing is limited. Entry-level plans have been reported around $400 per month, scaling with GMV
- Contact sales for current rates
Best for: Mid-market Shopify DTC brands and agencies managing multiple brands who need deep attribution accuracy and are comfortable configuring dashboards from scratch.
Limitations:
- Shopify-primary. No WooCommerce, Etsy, or eBay support
- Steep learning curve. G2 reviewers consistently flag complexity and weak onboarding
- Recurring complaints about Meta connector issues and slow API response times
- Pricing opacity makes budgeting difficult without a sales call
4. Metorik: best for WooCommerce and Shopify single-platform stores
Metorik is what good store reporting looks like when it’s done right. It takes your WooCommerce or Shopify data and turns it into clean dashboards, deep segmentation, and actionable customer insights without requiring a data team to run it.
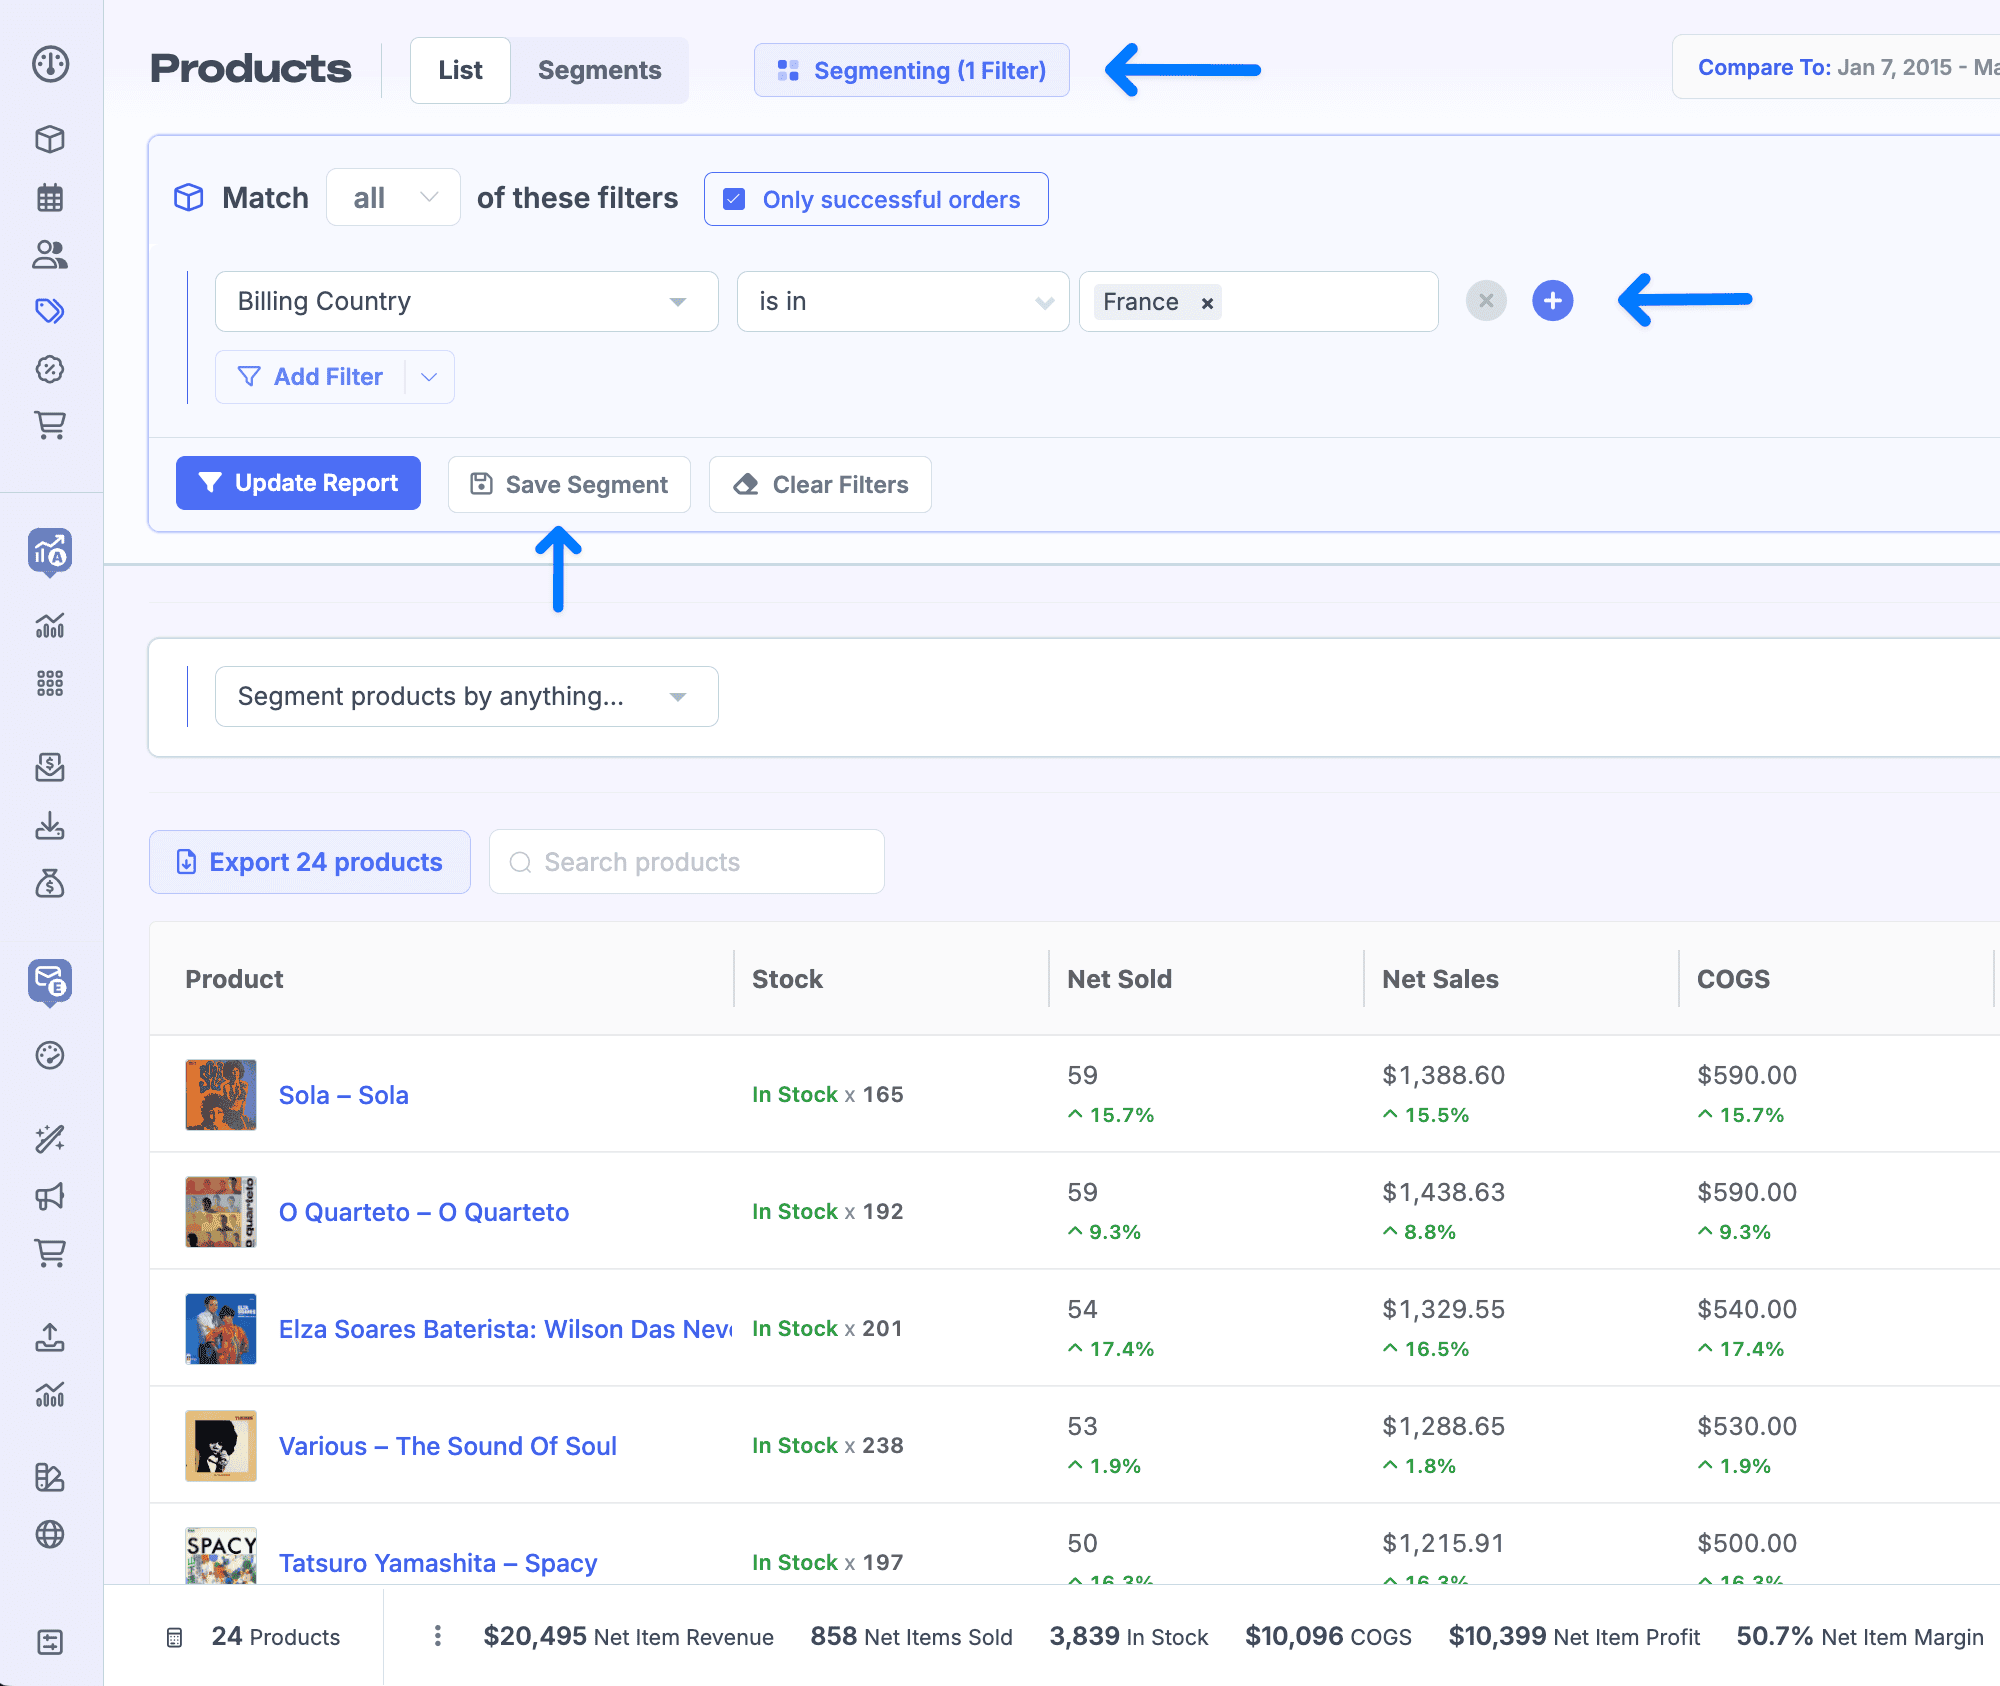
The Superpower Segments feature lets you filter your orders and customers by over 500 conditions: product purchased, country, coupon used, order value, subscription status, and more.
Combine that with cohort analysis, LTV tracking, and built-in subscription metrics (MRR, churn, trial conversions), and you get a level of store intelligence that native platform reporting simply doesn’t offer.
The built-in Engage feature also handles abandoned cart emails and customer broadcasts without needing a separate tool.
Pricing:
- Starts at approximately $42 per month for up to 100 orders
- Scales by monthly order volume. Higher tiers only visible via interactive pricing slider
- 30-day free trial, no credit card required
- Annual billing not currently available. Monthly billing only
Best for: WooCommerce and Shopify store owners who sell on a single platform and want deep reporting, subscription analytics, and email automation in one place.
Limitations:
- No marketplace or payment gateway integrations. Amazon, Etsy, eBay, PayPal, and Stripe are not supported as standalone sources
- Multi-channel sellers cannot unify revenue across platforms
- Cost scales automatically with order volume with no annual discount option
5. Putler: best for multi-channel sellers who sell everywhere
Most analytics tools are built around one platform. Putler is built around one problem: your revenue lives in too many places, the numbers never match, and you have no single view that tells you what your business actually earned.
It connects 17+ data sources including Shopify, WooCommerce, Etsy, Amazon, eBay, PayPal, Stripe, Braintree, Razorpay, Google Analytics, Search Console, Mailchimp, and more, and pulls everything into one unified revenue dashboard.
Every transaction runs through an automatic consolidation engine. The same sale appearing in both WooCommerce and Stripe gets counted once. Currencies convert across 36 supported currencies.
Timezones align automatically. The result is one revenue number that reflects what your business actually earned, across every channel you sell on.
Here’s what that looks like in practice:
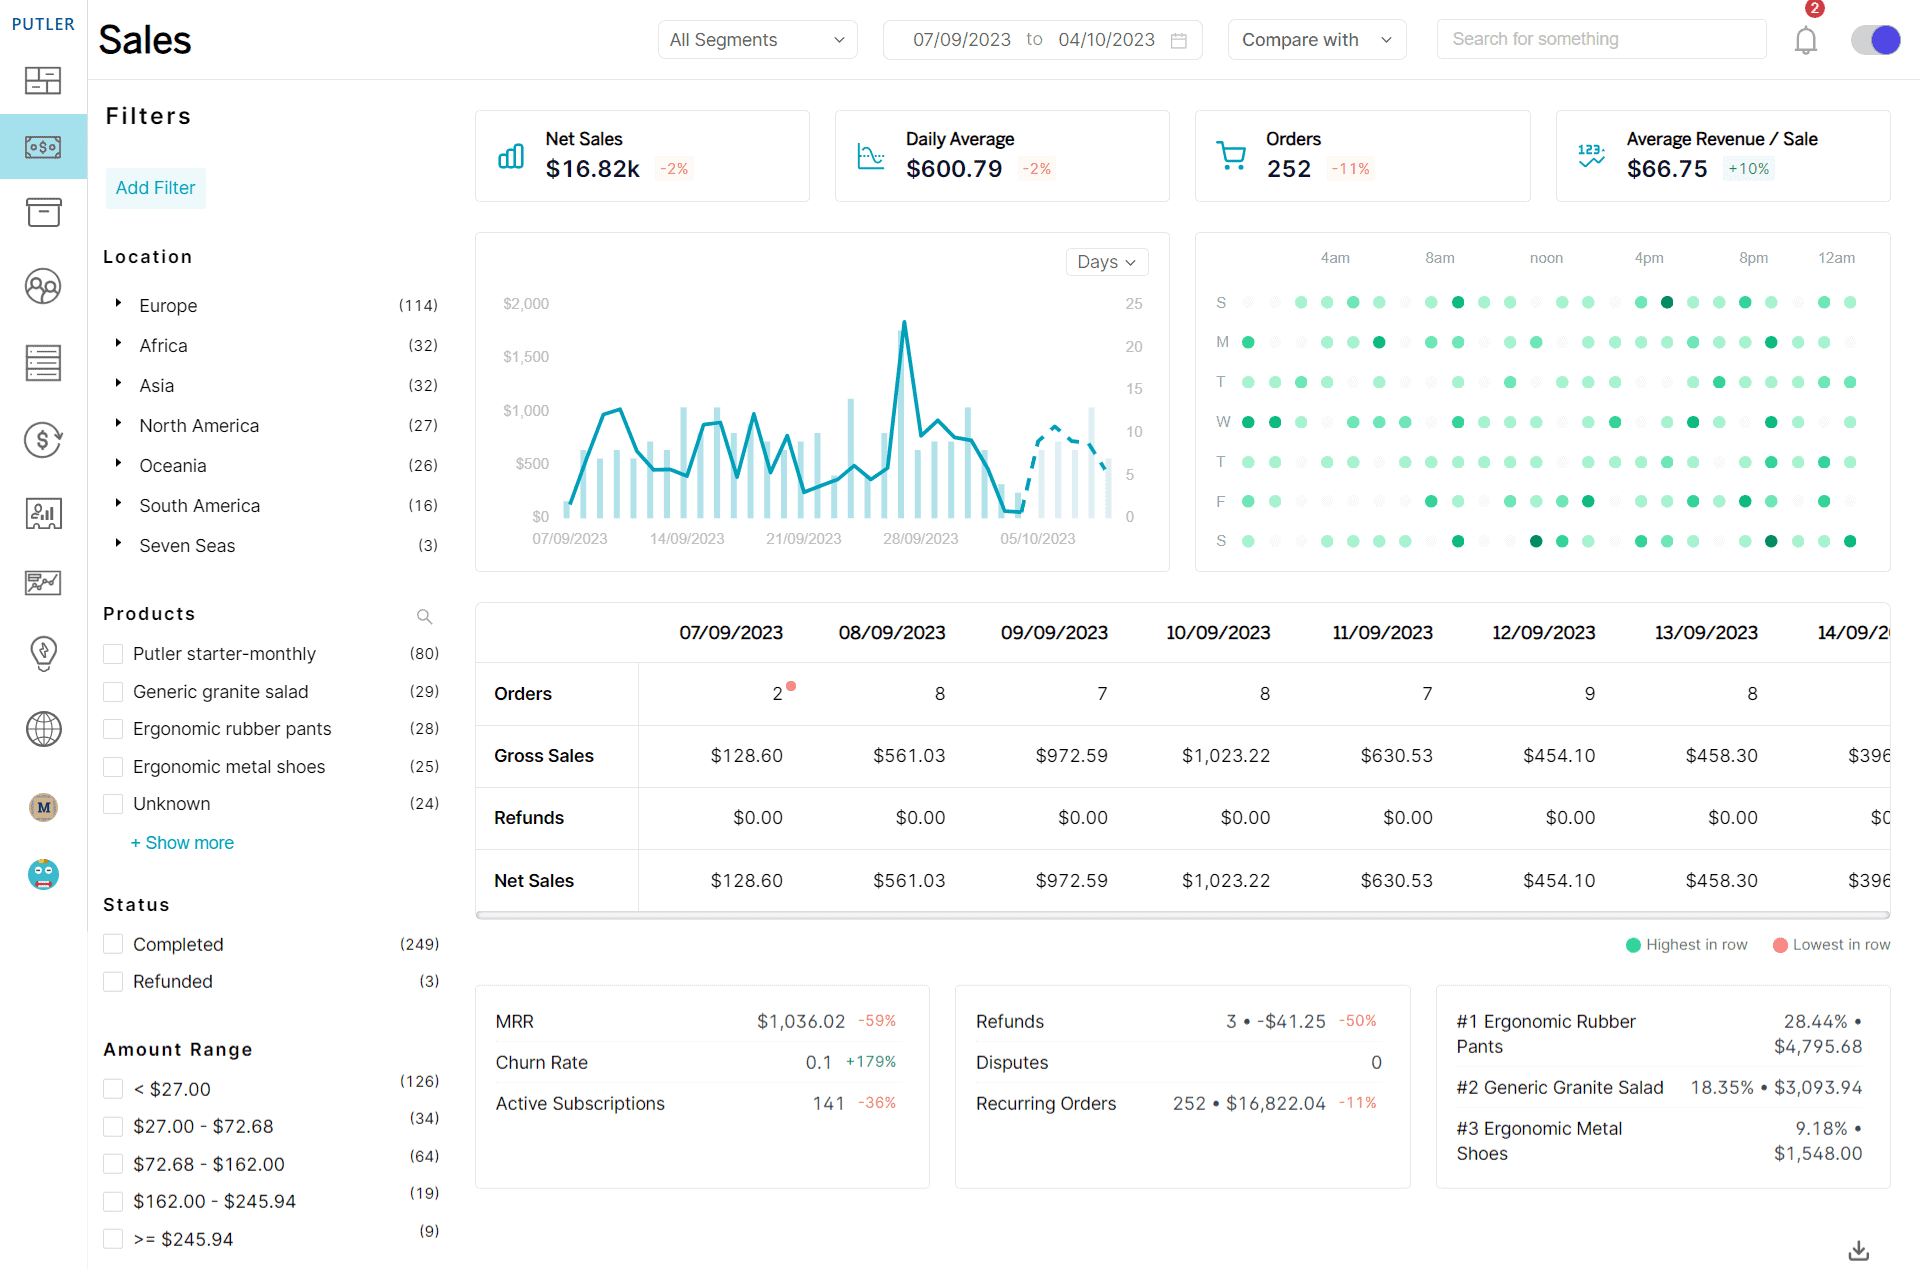
Unified revenue tracking: See total revenue, net revenue, AOV, and ARPU across all connected platforms in one dashboard. Compare daily, weekly, monthly, and yearly performance side by side, without building a single report manually.
Revenue forecasting: The Time Machine dashboard projects your revenue for the next 12 months based on your current growth rate. It also includes a 10x forecast that shows exactly how much growth you need to reach 10x your current revenue. Planning is based on data, not gut feel.
Sales heatmap: A visual breakdown of which days and hours generate the most revenue across all your connected platforms. Use it to time product launches, promotions, and email sends when your buyers are most active.
RFM customer segmentation: Every customer is automatically scored on recency, frequency, and monetary value and sorted into 11 segments: Champions, Loyal Customers, At Risk, About to Sleep, Lost, and more. Each segment comes with revenue-focused action recommendations and one-click Mailchimp or CSV export.
Subscription revenue analytics: MRR, ARR, churn, ARPU, and LTV tracked alongside one-time revenue in the same view. No separate SaaS tool needed. Both revenue streams live in one dashboard.
Product revenue intelligence: See which products drive the most revenue across every connected platform combined. Spot your top earners, identify slow movers, and find frequently bought together patterns for cross-sell opportunities.
Pricing:
- Starts at $20 per month for stores up to $10K monthly revenue
- Scales by revenue band: $50 (up to $30K) → $100 (up to $50K) → $150 (up to $100K) → $250 (up to $200K)
- 14-day free trial, no credit card required
- $1 signup fee covers the first 30 days after trial
Best for: Multi-channel sellers on two or more platforms or payment processors. Stores managing both eCommerce and subscription revenue. Sellers who need a clean, unified revenue picture without enterprise-level pricing.
Limitations:
- Native ad platform integrations (Meta Ads, Google Ads) not yet available
- No dedicated mobile app. Browser-based only
How to pick the right revenue analytics tool for your store
The right tool depends on your setup, not on which product has the most features. Answer these four questions and the choice becomes straightforward.
How many platforms do you sell on?
If you sell on one platform only (Shopify or WooCommerce), tools like Triple Whale or Metorik are built exactly for that. If you sell across two or more platforms, marketplaces, or payment gateways, you need a tool that can consolidate and deduplicate across all of them. That’s where Putler is the only option on this list that covers the full picture.
How much do you spend on paid ads?
If Meta, Google, and TikTok ads are the core of your growth strategy and you need accurate attribution at the campaign level, Triple Whale or Polar Analytics are built for that job. GA4 handles the baseline for free. But if paid ads are not your primary growth channel, you’re paying for attribution depth you won’t use.
Do you have subscription revenue?
If your store has both one-time and recurring revenue (subscriptions, memberships, or SaaS plans alongside product sales), you need a tool that handles both in the same view. Metorik covers WooCommerce Subscriptions well. Putler handles subscription and one-time revenue together across every connected platform.
What’s your budget?
GA4 is free and covers the basics. Metorik starts at $25 per month and scales with order volume. Putler starts at $20 per month and scales with revenue. Triple Whale and Polar Analytics are built for higher-GMV brands and priced accordingly. Expect to pay $500 or more per month once your store hits meaningful scale.
Get clear on your revenue, starting today
The problem isn’t that your data doesn’t exist. It’s that it lives in five different places, each telling a slightly different story.
The tools in this list each solve a piece of that. The right one depends entirely on where your revenue actually comes from.
If you’re on one platform and running paid ads, start with GA4 and layer in Triple Whale or Polar. If you’re on WooCommerce and want deep single-platform reporting, Metorik is hard to beat.
And if your revenue is spread across multiple storefronts, marketplaces, and payment gateways, Putler is the only tool here that brings all of it together automatically. It gives you one number you can actually trust.
- eCommerce revenue attribution: why your data is wrong and how to fix it
- Google Analytics limitations: every GA4 gap and how to fix them
- Best WooCommerce analytics alternatives for ecommerce sellers
- eCommerce data consolidation: connect 17+ sources with Putler
- Cross platform analytics for ecommerce: one view across every channel