

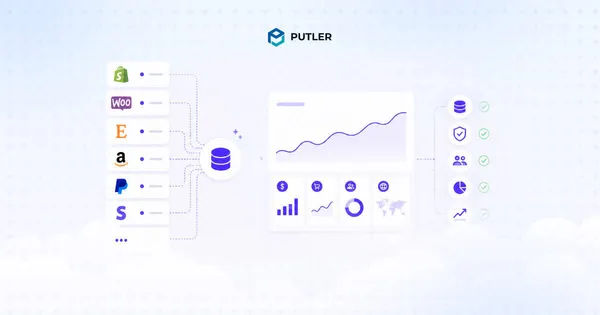
You sell on Shopify. Maybe Etsy too. Amazon. PayPal processes some orders, Stripe handles the rest.
Someone asks: “What was our total revenue last month?”
You open four tabs. Get four different numbers. Spend 45 minutes in a spreadsheet. Still not confident in the answer.
The average eCommerce seller now manages 3+ channels. Platform-reported revenue can often inflate actual sales figures. And 34% of businesses face revenue loss due to decisions made from conflicting, incomplete data.
Cross platform analytics helps businesses consolidate data from multiple systems into a unified reporting layer for more accurate revenue, customer, and performance analysis.
The term “cross platform analytics” can mean different things depending on the industry. In mobile apps, it often refers to tracking users across devices and operating systems.
In eCommerce, it usually means combining store, marketplace, payment, and marketing data into one reporting system. This article focuses specifically on cross platform analytics for eCommerce businesses.
What is cross platform analytics for eCommerce?
Cross platform analytics for eCommerce is the practice of consolidating data from every selling channel, payment processor, marketplace, and marketing platform into a single source of truth.
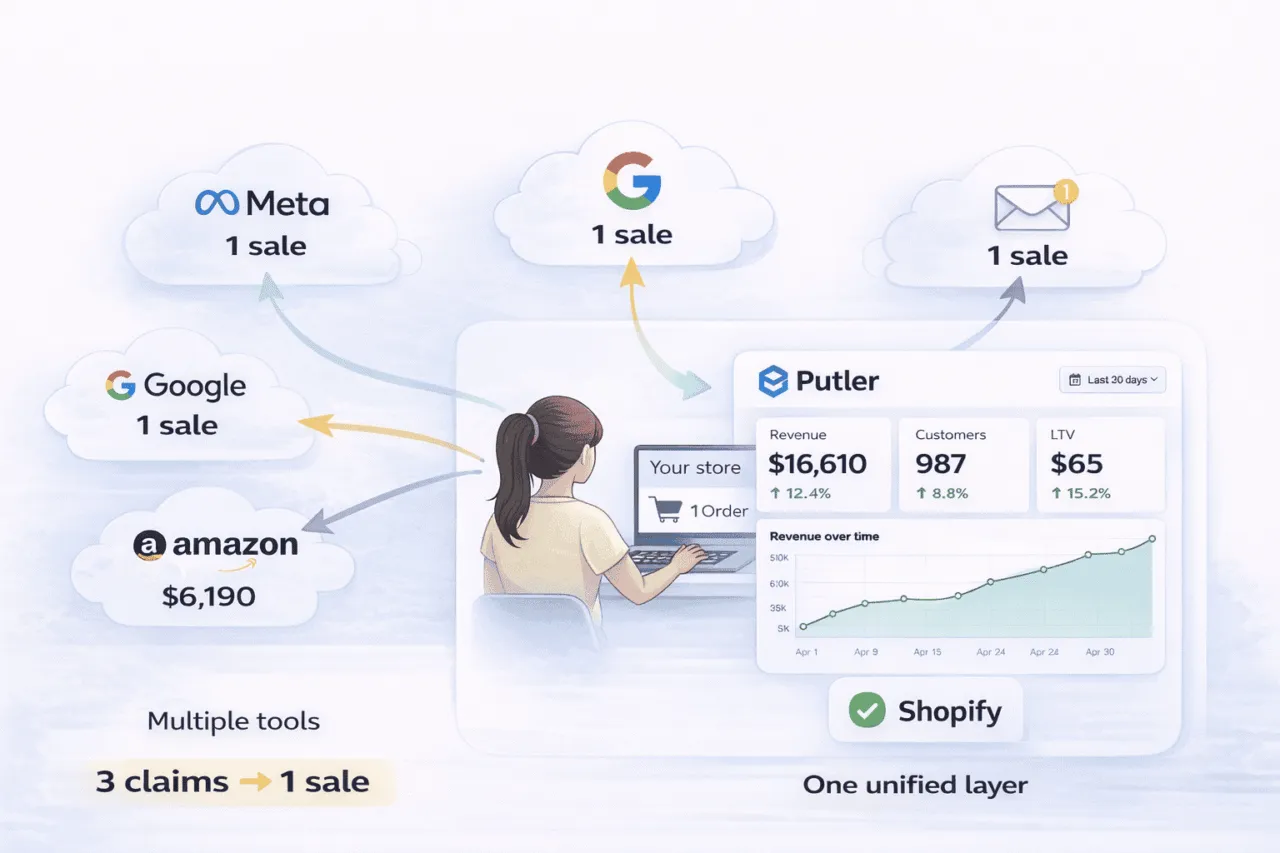
Instead of checking separate reports in Shopify, Amazon, Etsy, or PayPal, cross platform analytics combines data from multiple systems into one reporting environment.
The difference from single-platform analytics comes down to this:
| Single-platform analytics | Cross platform analytics |
|---|---|
| Tracks data from one platform | Combines data from multiple systems |
| Limited customer visibility | Unified customer insights |
| Different revenue definitions | Standardized reporting |
| Difficult to compare channels | Easier cross-channel analysis |
Shopify Analytics tells you what happened on Shopify. Etsy Stats tells you what happened on Etsy. Cross platform analytics tells you what happened across your entire business.
For multi-platform sellers, relying only on platform-specific reports often creates gaps in revenue, customer, and performance analysis.
Why your platform data never agrees
If you sell across multiple platforms, you have probably seen this already: Shopify reports one number, PayPal shows another, and GA4 reports something different again.
This happens because every platform measures revenue, attribution, and transactions differently.
Every platform claims the same sale
A customer might discover your product through a Meta ad, return later through Google Shopping, and finally purchase after clicking an email campaign.
Each platform may then claim credit for the same purchase, even though only one order actually happened.
Many eCommerce brands discover that platform-reported attribution often overstates actual performance because multiple systems claim the same conversion.
In complex multi-channel setups, platform-reported revenue inflates actual revenue.
As a result, reported ROAS can appear stronger than actual business performance when attribution overlap is not accounted for.
The double counting problem
Payment gateways stack this problem further.
Sell through WooCommerce and accept PayPal. That one transaction now lives in two places: your WooCommerce order history and your PayPal transaction log.
A concrete example: a seller running Shopify + Etsy + Amazon + PayPal had platforms reporting €147K in combined revenue while the bank account showed €98K.
That €49K gap is not fraud. It is double counting, attribution overlap, and conflicting revenue definitions all stacked together.
Each platform defines revenue differently too:
- Shopify: gross sales including taxes and shipping
- PayPal: net settlements after fees
- GA4: purchases converted at yesterday’s exchange rate
- Amazon: operates as a data walled garden and shares nothing
When these reporting differences stack together, getting a consistent revenue picture becomes difficult.
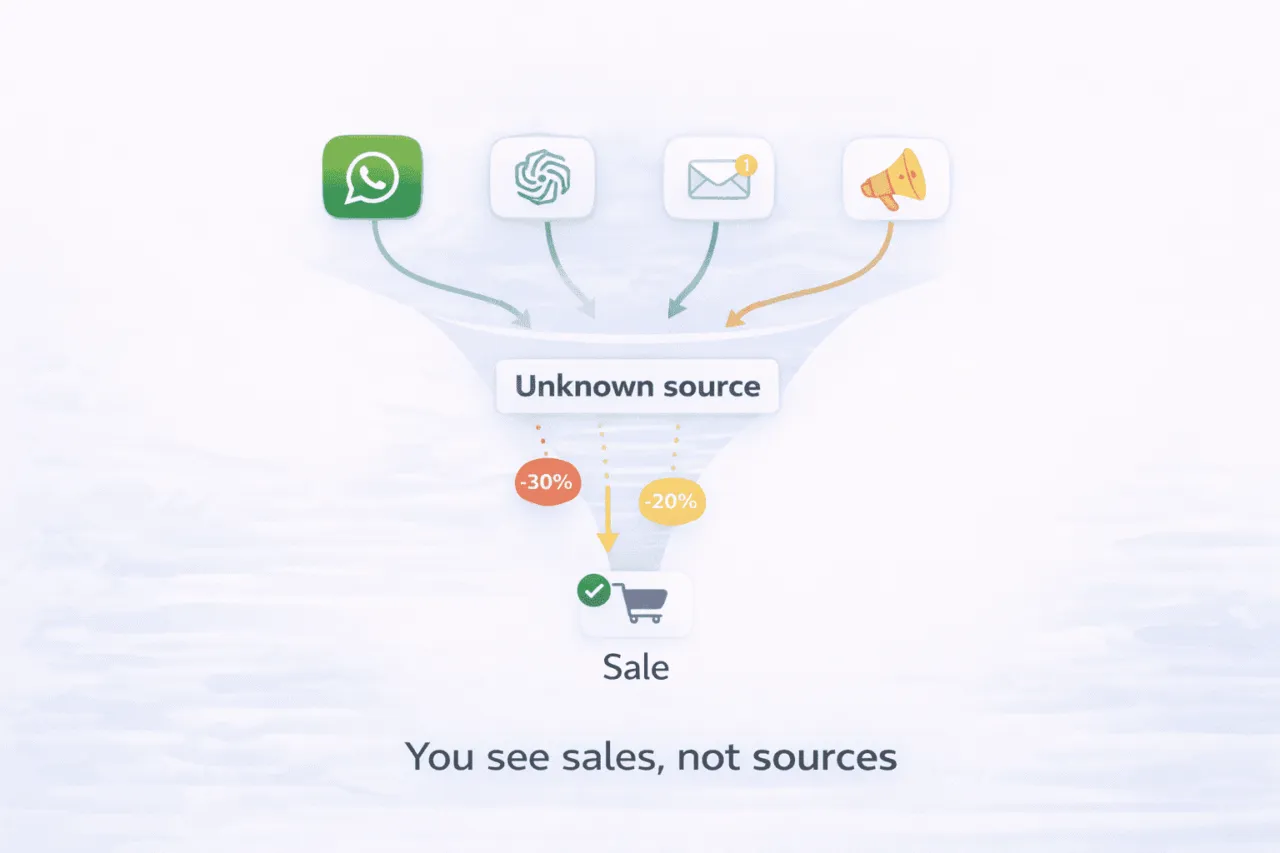
Dark traffic and lost attribution
Not every customer journey can be tracked accurately across platforms and devices.
A significant amount of traffic now comes through private channels like WhatsApp, Slack, SMS, email, where referral data is often unavailable.
Some customer journeys also begin in AI search tools or private communities that provide limited referral visibility.
Privacy changes made everything worse
Privacy changes have made attribution and cross-platform tracking even more difficult in recent years.
Safari and Firefox already block many third-party cookies by default, which further limits tracking visibility across devices and channels.
Benefits of cross platform analytics for eCommerce businesses
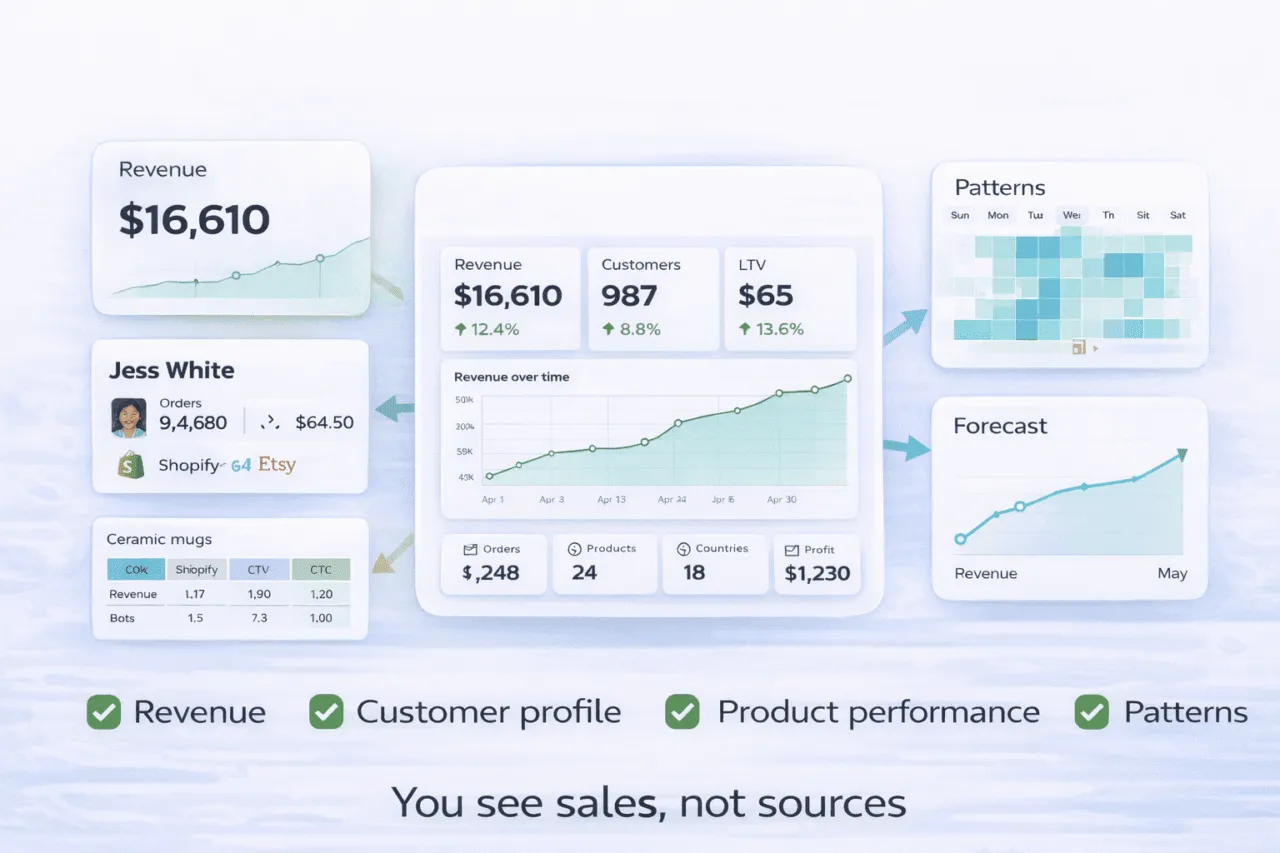
When reporting data is consolidated across platforms, businesses can analyze performance more consistently and make decisions with fewer reporting gaps.
More consistent revenue reporting
Cross platform analytics helps reconcile revenue data across stores, marketplaces, and payment gateways into a more consistent reporting view.
This reduces manual spreadsheet reconciliation and makes it easier to compare performance across channels.
Unified customer visibility
Customers often purchase through multiple channels over time.
Cross platform analytics can combine transaction history across platforms so businesses can better understand repeat purchases, customer lifetime value, and buying behavior.
Better product performance analysis
The same product may perform differently across Shopify, Amazon, Etsy, or other marketplaces because of pricing, fees, refunds, and conversion differences.
Unified reporting makes it easier to compare product performance across channels side by side.
Cross-channel purchase insights
Some sales and customer behavior patterns only become visible when data from multiple platforms is analyzed together.
Businesses may discover that purchase timing, repeat buying behavior, or conversion trends vary significantly across channels.
More reliable forecasting
Forecasting becomes more useful when sales, refunds, subscriptions, and payment data are consolidated into one reporting system.
Businesses can make inventory, marketing, and cash flow decisions with a more complete operational view.
These benefits become more noticeable as businesses expand across additional stores, marketplaces, payment gateways, and marketing channels.
The challenge is finding a tool that can consolidate this data reliably without adding unnecessary complexity.
5 cross platform analytics tools for eCommerce sellers
Not every analytics platform handles cross-platform reporting in the same way. Some focus primarily on Shopify analytics, while others are designed for attribution, BI reporting, or enterprise data warehousing.
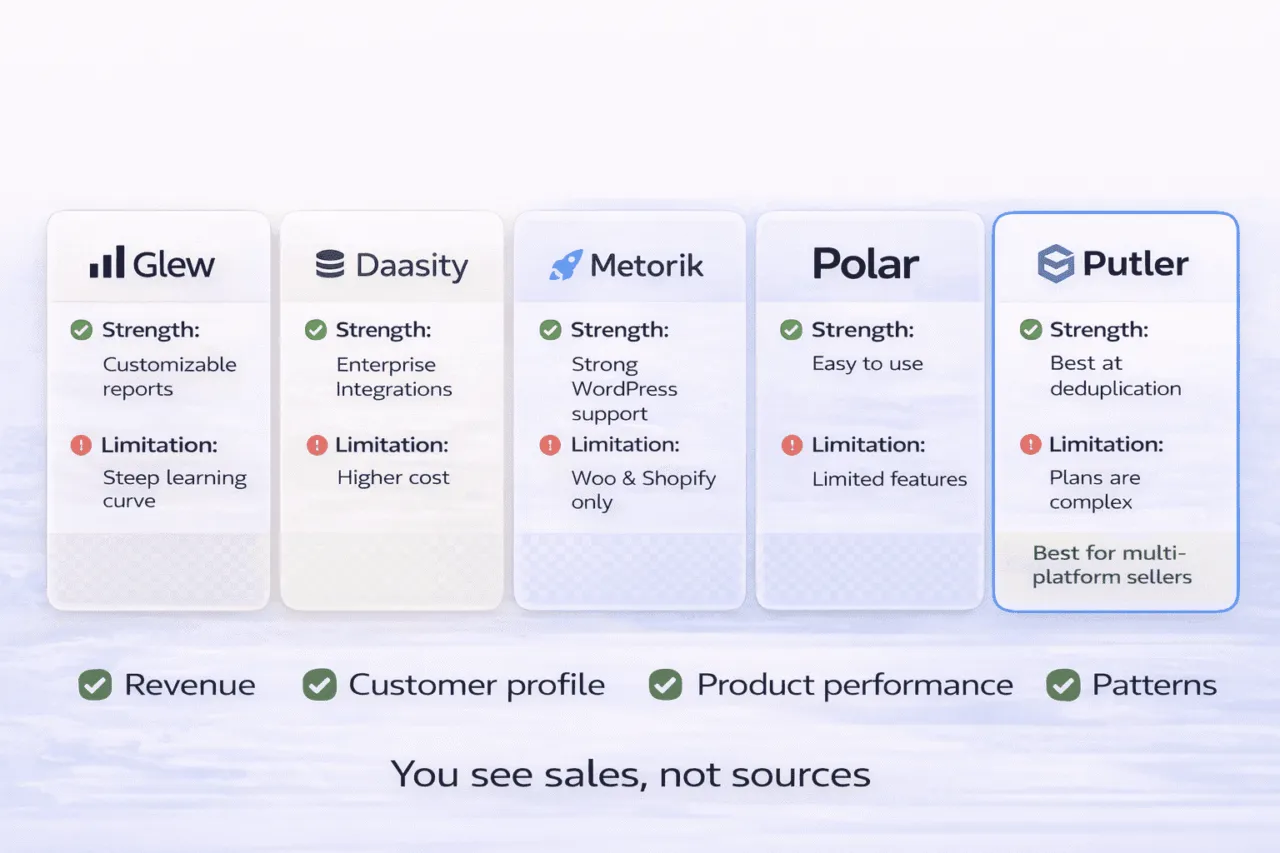
The tools below support different types of cross-platform analytics workflows, including marketplace reporting, payment reconciliation, attribution analysis, and multi-store reporting.
Each connects data across selling channels, payment processors, or marketplaces, and consolidates it into a unified view.
1. Glew
Glew is a commerce analytics platform designed for businesses managing multiple stores, brands, and marketing data sources.
It supports a large integration library and includes pre-built dashboards, with more advanced reporting available on higher-tier plans.
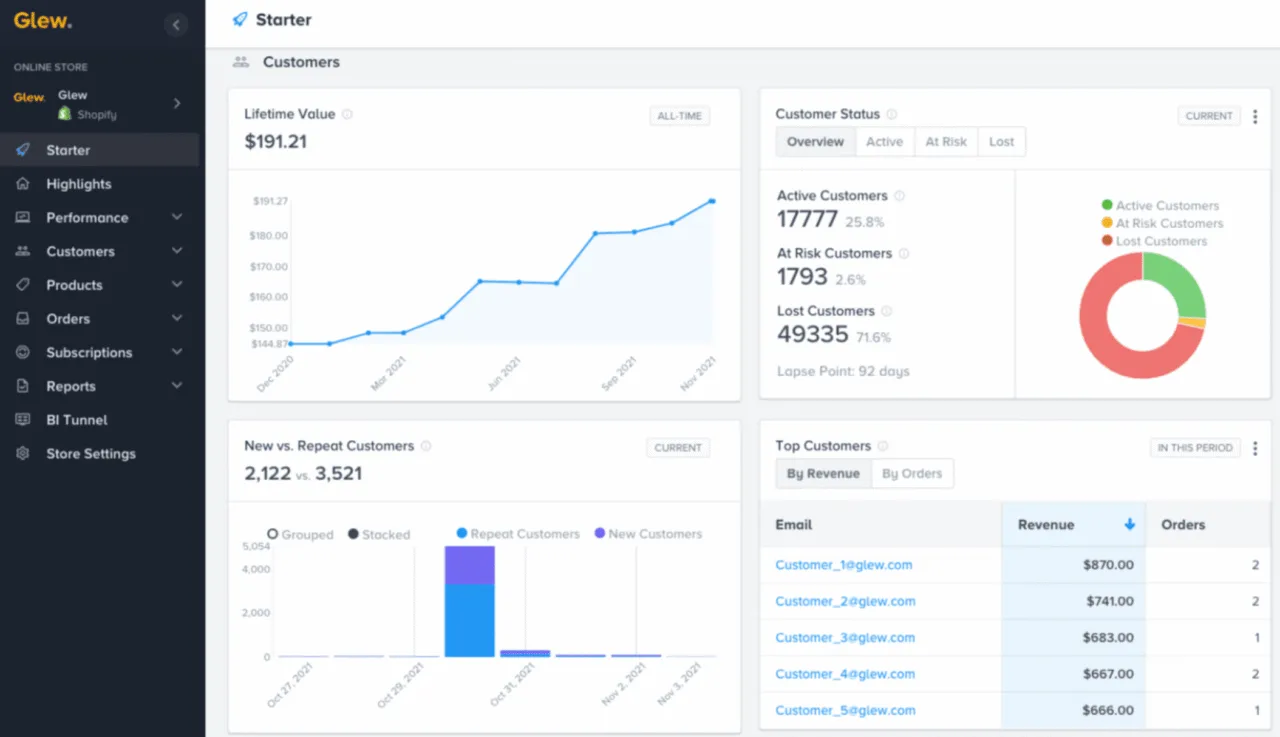
Supported Platforms: Shopify, WooCommerce, BigCommerce, Magento, Amazon, TikTok Shop, Google Ads, Meta Ads, Klaviyo, Mailchimp, ReCharge, and more.
Key features:
- Pre-built KPI dashboards
- Customer segmentation and cohort analysis
- Product profitability reporting
- Multi-store and multi-brand reporting
- Klaviyo and Mailchimp segment syncing
- Custom reporting on higher-tier plans
Pricing:
| Monthly Revenue | Monthly Price |
|---|---|
| Up to $1M | $79/month |
| $1M–$5M | $249/month |
| $5M–$10M | $499/month |
| Above $10M | Custom |
Pricing is annual, and unlimited users are included across plans.
Pros:
- Large integration library compared to many competitors
- Strong selection of pre-built KPI dashboards
- Advanced custom reporting options on higher-tier plans
Cons:
- Slow loading and performance issues flagged consistently in reviews
- Annual-only pricing may not suit smaller businesses
- No Etsy or eBay integration
- Inconsistent support quality
Best suited for: Multi-channel merchants at $1M+ revenue with 5+ data sources who need enterprise-grade consolidated analytics and can commit to annual contracts.
2. Daasity
Daasity is an analytics platform designed for consumer brands selling across eCommerce, Amazon, wholesale, and retail channels.
The platform combines sales, retail, and marketing data into centralized reporting dashboards with support for more advanced BI workflows.
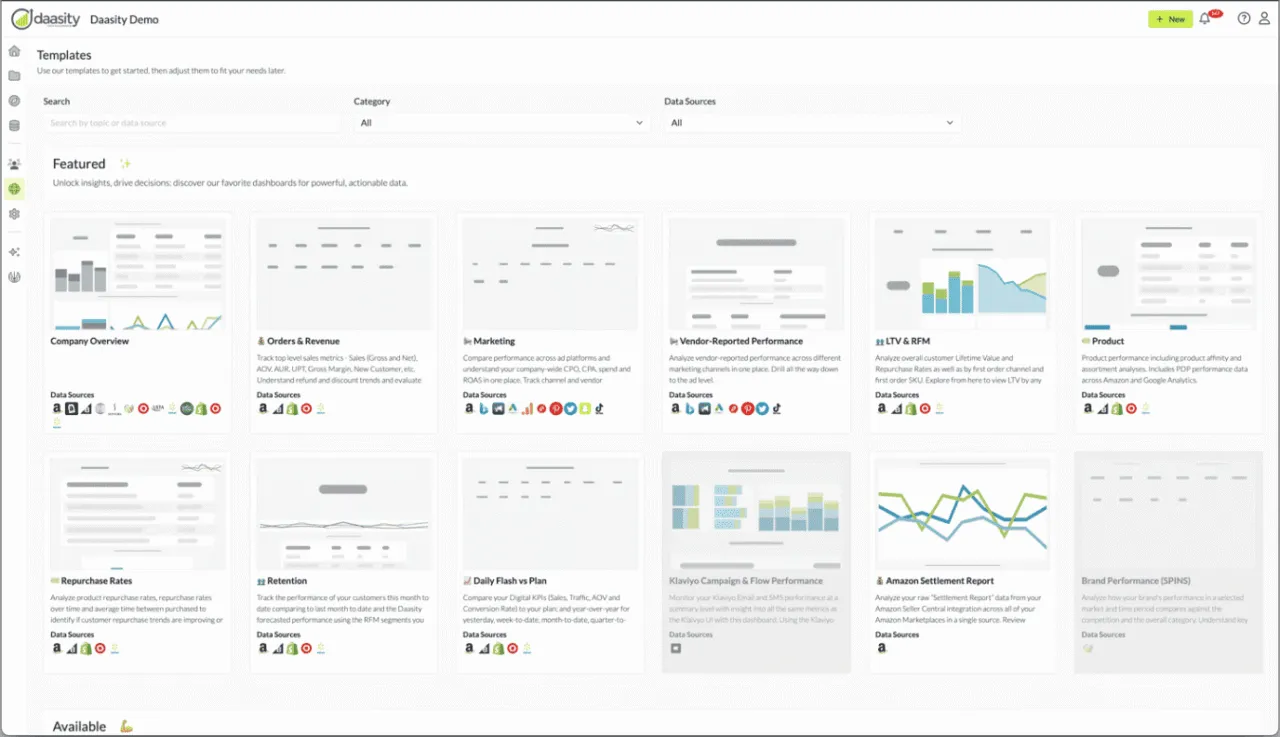
It is the only tool in this list with genuine retail and wholesale data integration, including Nielsen and SPINS syndicated data for brands selling into physical retail.
Supported Platforms: Shopify, BigCommerce, Magento, Amazon Seller Central, Walmart Marketplace, Target, ULTA, Whole Foods portals, Nielsen/SPINS syndicated data, Meta, Google, TikTok, Klaviyo, Attentive, ReCharge, Snowflake, BigQuery, Redshift.
Key features:
- Reporting across DTC, Amazon, wholesale, and retail channels
- Customer cohort and LTV analysis
- RFM segmentation
- Pre-built reporting dashboards
- Audience syncing with advertising and email platforms
- Investor and executive reporting dashboards
Pricing:
| Annual Revenue | Starting Price |
|---|---|
| Under $2M | $199/month |
| $2M–$5M | $499/month |
| $5M–$10M | $699/month |
| $10M–$25M | $899/month |
| Above $25M | Custom |
Pricing details typically require a product demo.
Pros:
- Strong retail and wholesale reporting support
- Reporting workflows designed for DTC consumer brands
- Audience syncing with advertising platforms
Cons:
- Steep learning curve, custom reporting requires Looker and SQL knowledge
- Setup and implementation may require more planning for complex businesses
- Data refreshes overnight, not real-time
- No Etsy, eBay, or WooCommerce support
Best suited for: Consumer brands selling across Shopify, Amazon, retail, and wholesale channels that need centralized operational reporting.
3. Metorik
Metorik is an analytics and customer reporting platform for WooCommerce and Shopify stores.
Founded by Bryce Adams, it serves 10,000+ merchants. It offers more advanced reporting, and customer analysis than the default analytics available in WooCommerce and Shopify.
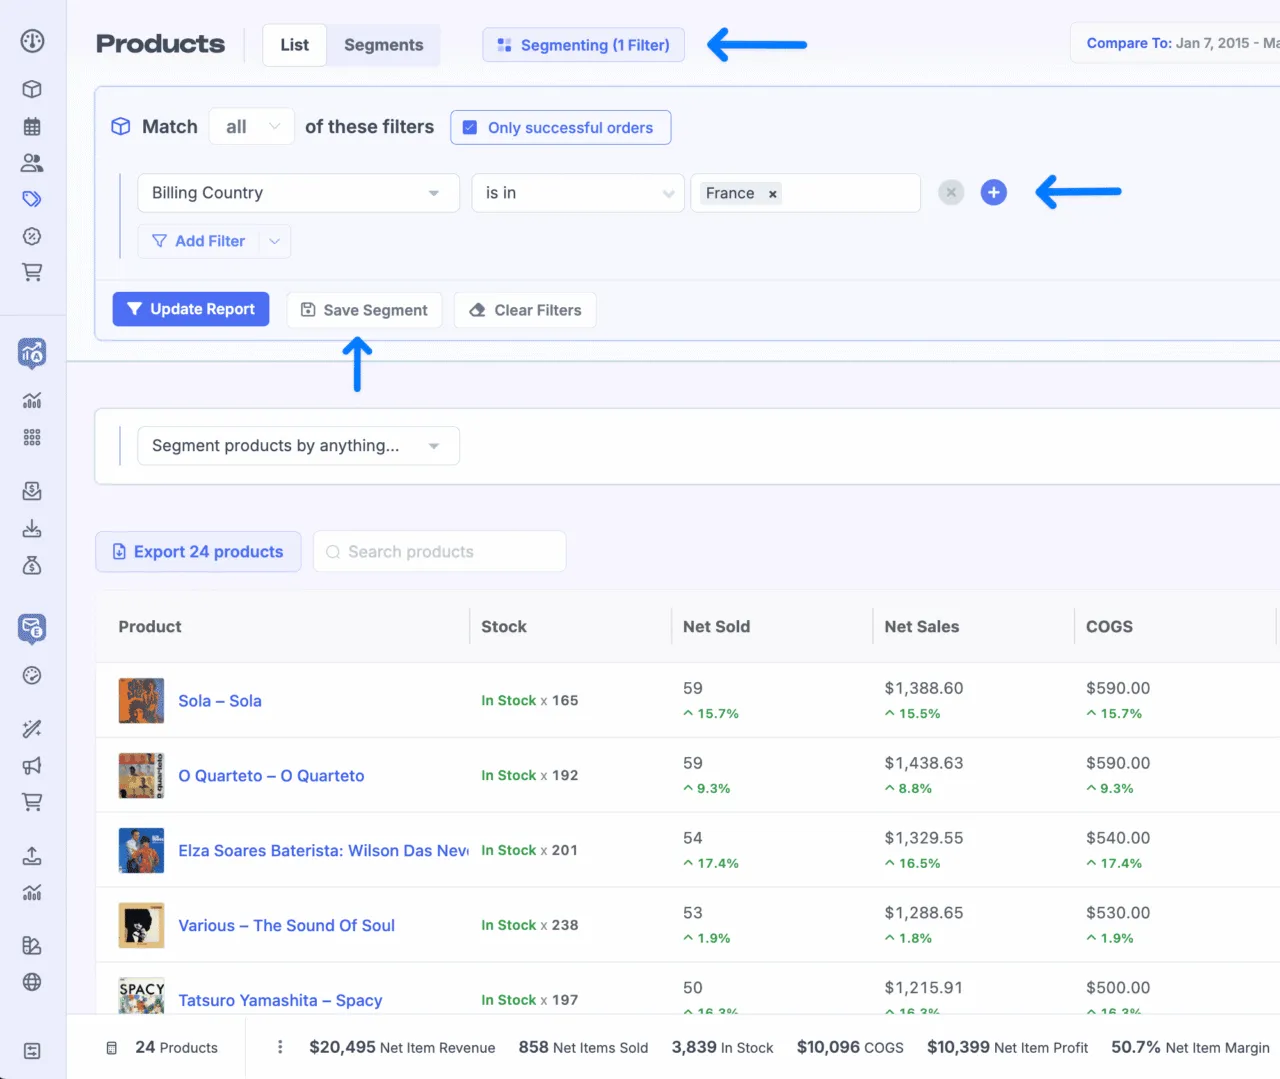
Supported Platforms: WooCommerce and Shopify only. Marketplace integrations such as Etsy, Amazon, and eBay are not supported.
Key features:
- Advanced customer segmentation
- Cohort and retention analysis
- Product cost and profit reporting
- Subscription reporting with MRR and churn tracking
- Built-in email marketing and abandoned cart recovery
- Flexible filtering for customer and order analysis
Pricing:
| Monthly Orders | Approx. Price |
|---|---|
| Up to 100 | $25/month |
| Up to 500 | ~$50/month |
| Up to 2,500 | ~$100/month |
| Up to 10,000 | ~$250/month |
A 30-day free trial is available without requiring a credit card.
Pros:
- Cleaner and more flexible reporting interface than native WooCommerce analytics
- Strong segmentation and filtering capabilities
- Customer support is mentioned positively across many user reviews
- Built-in email marketing features for customer follow-ups and recovery campaigns
Cons:
- Limited to WooCommerce and Shopify integrations
- Pricing scales with order volume and becomes expensive at high volumes
- No multi-touch attribution engine
Best suited for: WooCommerce and Shopify stores for more advanced reporting and customer analysis without needing marketplace integrations.
4. Polar Analytics
Polar Analytics is a reporting and attribution platform designed primarily for Shopify-based DTC brands. The platform focuses heavily on attribution reporting and marketing performance measurement.
It includes server-side tracking, first-party attribution tools, and incrementality testing features aimed at improving marketing visibility.
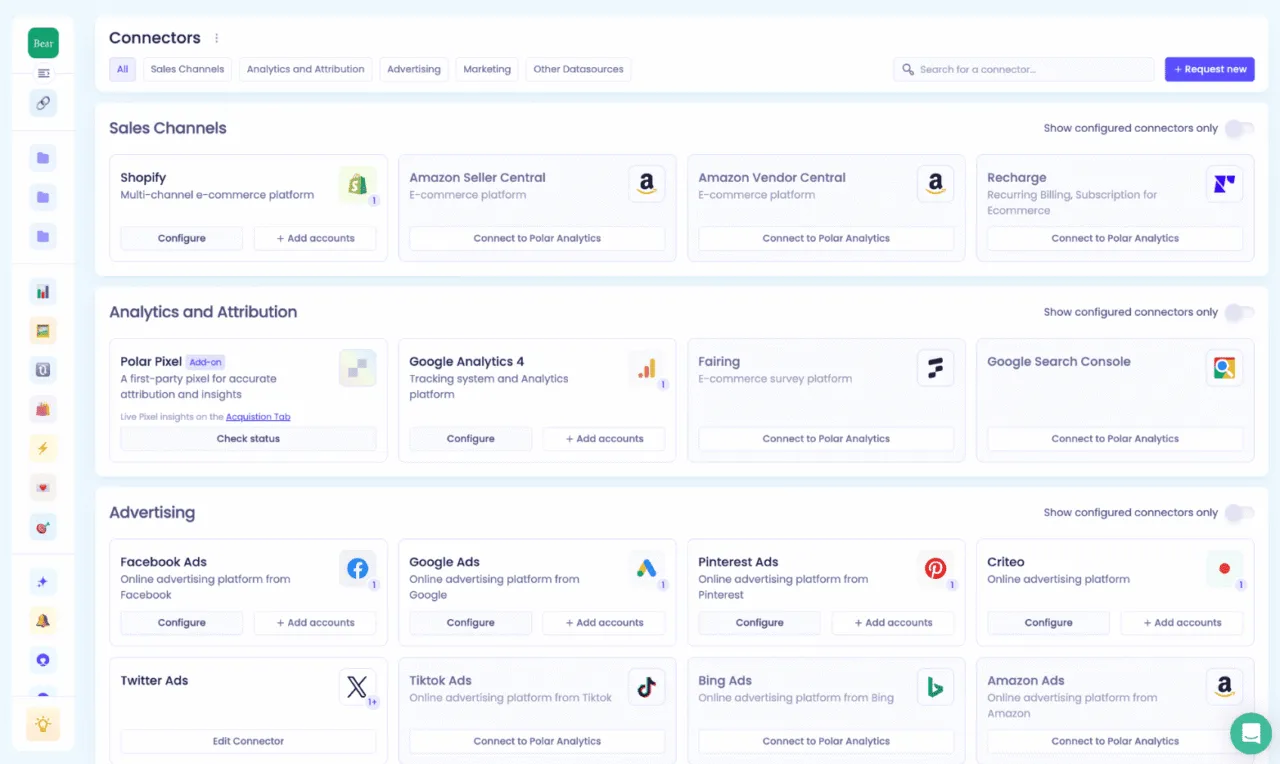
Supported Platforms: Shopify (primary), Amazon Seller Central and Vendor Central, Meta, Google, TikTok, Klaviyo (deep integration), Attentive, GA4, Recharge, Snowflake.
Key features:
- Multiple attribution models
- Server-side tracking support
- Meta and Google Ads integrations
- Incrementality testing
- Profit and loss reporting
- Ask Polar for natural-language analytics queries
- Klaviyo integration and marketing reporting
Pricing:
| Annual GMV | Approx. Monthly Cost |
|---|---|
| Up to $5M | ~$720/month |
| $5M–$7M | ~$1,020/month |
| $10M–$15M | ~$1,660/month |
| $20M–$25M | ~$2,770/month |
Pros:
- Strong attribution and server-side tracking capabilities
- Flexible dashboard customization and attribution reporting tools
- Supports reporting across Shopify, Amazon, and Klaviyo
- Dedicated customer success manager on all plans
Cons:
- Higher pricing compared to many SMB-focused analytics tools
- Shopify-only for eCommerce, no WooCommerce, Etsy, or eBay
- Complexity and steep learning curve
- Limited mobile experience
Best suited for: Shopify-focused DTC brands running large paid advertising campaigns and prioritizing attribution analysis.
5. Putler
Putler is a multichannel analytics platform designed to consolidate sales, payment, customer, and marketplace data into a centralized dashboard.
The platform supports reporting for both eCommerce and subscription-based businesses across multiple sales channels.
Putler focuses heavily on marketplace, payment gateway, and customer reporting for businesses selling across multiple platforms.
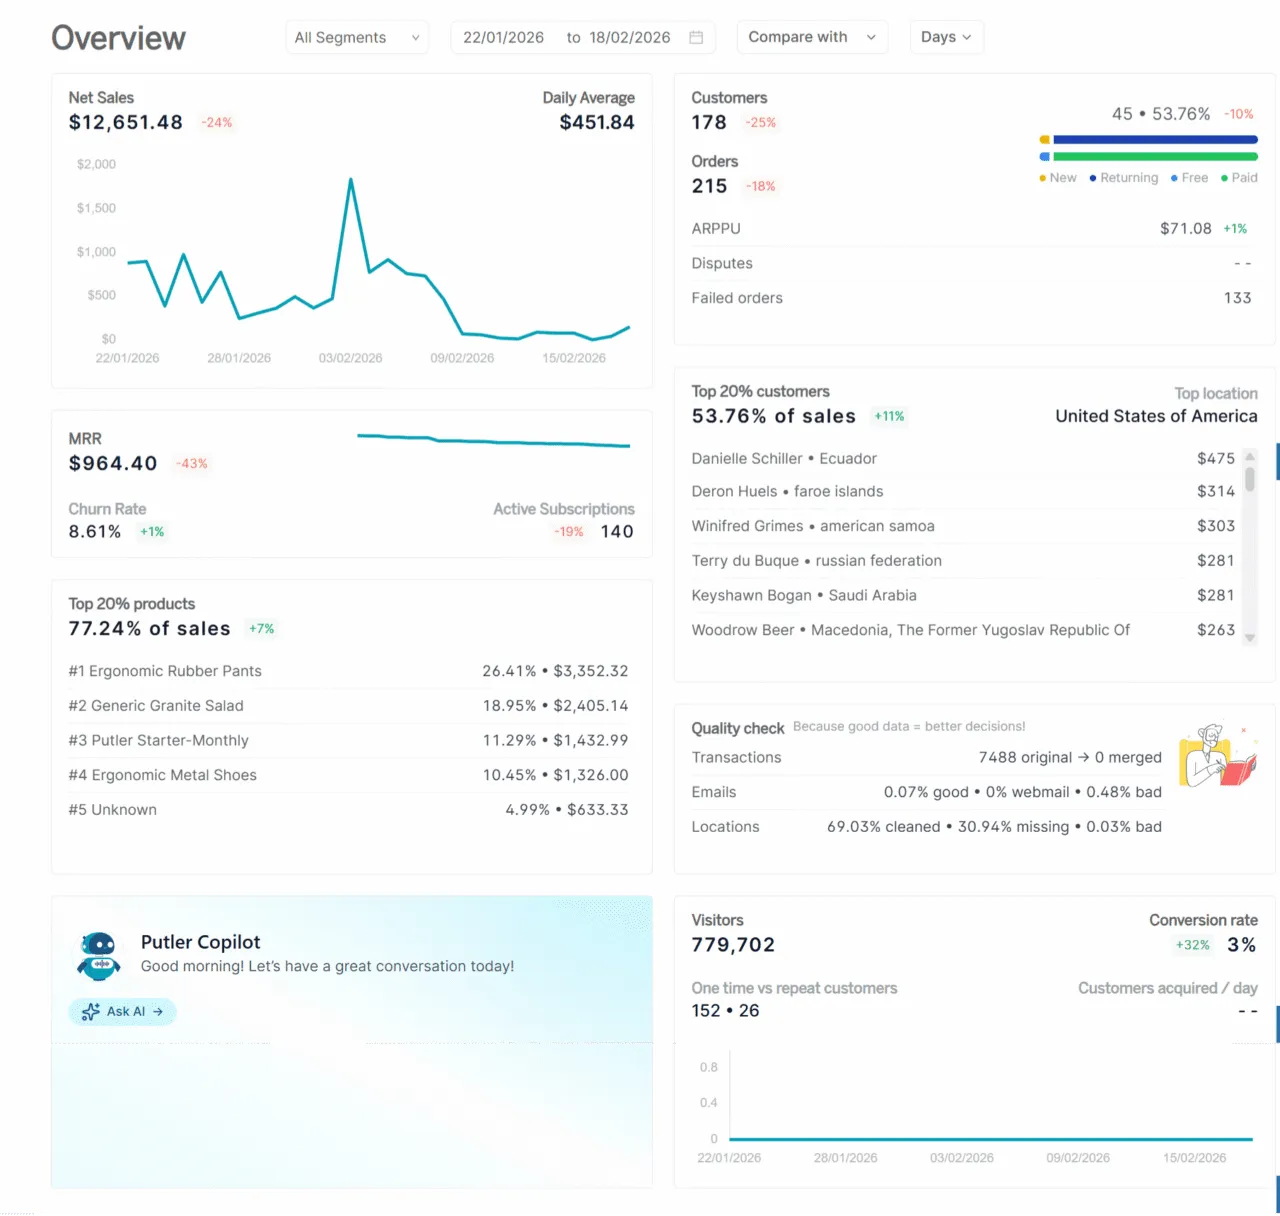
All 17+ data source integrations:
- Payment gateways: PayPal, Stripe, Braintree, Razorpay, Authorize.Net, 2Checkout, SagePay
- eCommerce platforms and marketplaces: Shopify, WooCommerce, BigCommerce, Easy Digital Downloads, Etsy, Amazon, eBay, Gumroad
- Analytics and marketing: Google Analytics (GA4), Google Search Console, Mailchimp
- Custom: Custom integrations available through API access on higher-tier plans
Key features:
- Transaction deduplication across payment gateways and stores
- Unified customer profiles
- RFM customer segmentation
- Product and refund reporting
- Sales heatmaps and purchase pattern analysis
- Transaction search and refund management
- Built-in eCommerce analytics reporting
- Subscription and SaaS metrics tracking
Putler’s reporting is focused primarily on consolidating operational and transaction data across multiple platforms rather than advanced attribution modeling.
Pricing:
| Monthly Revenue | Monthly Price |
|---|---|
| Up to $10K | $20/month |
| $10K–$30K | $50/month |
| $30K–$50K | $100/month |
| $50K–$100K | $150/month |
| $100K–$200K | $250/month |
| $200K–$500K | $350–$500/month |
| $500K–$1M | $750/month |
| $1M–$3M | $1,500/month |
A 14-day free trial is available. Pricing scales based on monthly revenue.
Pros:
- Supports a wide range of eCommerce platforms and payment gateways, Shopify + WooCommerce + Etsy + Amazon + eBay + PayPal + Stripe simultaneously
- Includes transaction deduplication across connected platforms
- Works for both eCommerce and SaaS revenue in the same dashboard
- Designed for businesses without dedicated BI or engineering teams
- Lower starting price compared to many enterprise-focused analytics tools
- Revenue-based pricing that scales down when your revenue drops
Cons:
- Initial data sync can take hours for large datasets
- Limited native advertising attribution integrations
- No annual billing option
Best suited for: Businesses selling across multiple stores, marketplaces, and payment gateways that need centralized operational reporting without a complex BI setup.
How to choose the right cross platform analytics tool
Businesses using multiple marketplaces, payment gateways, and storefronts usually benefit the most from cross platform analytics software.
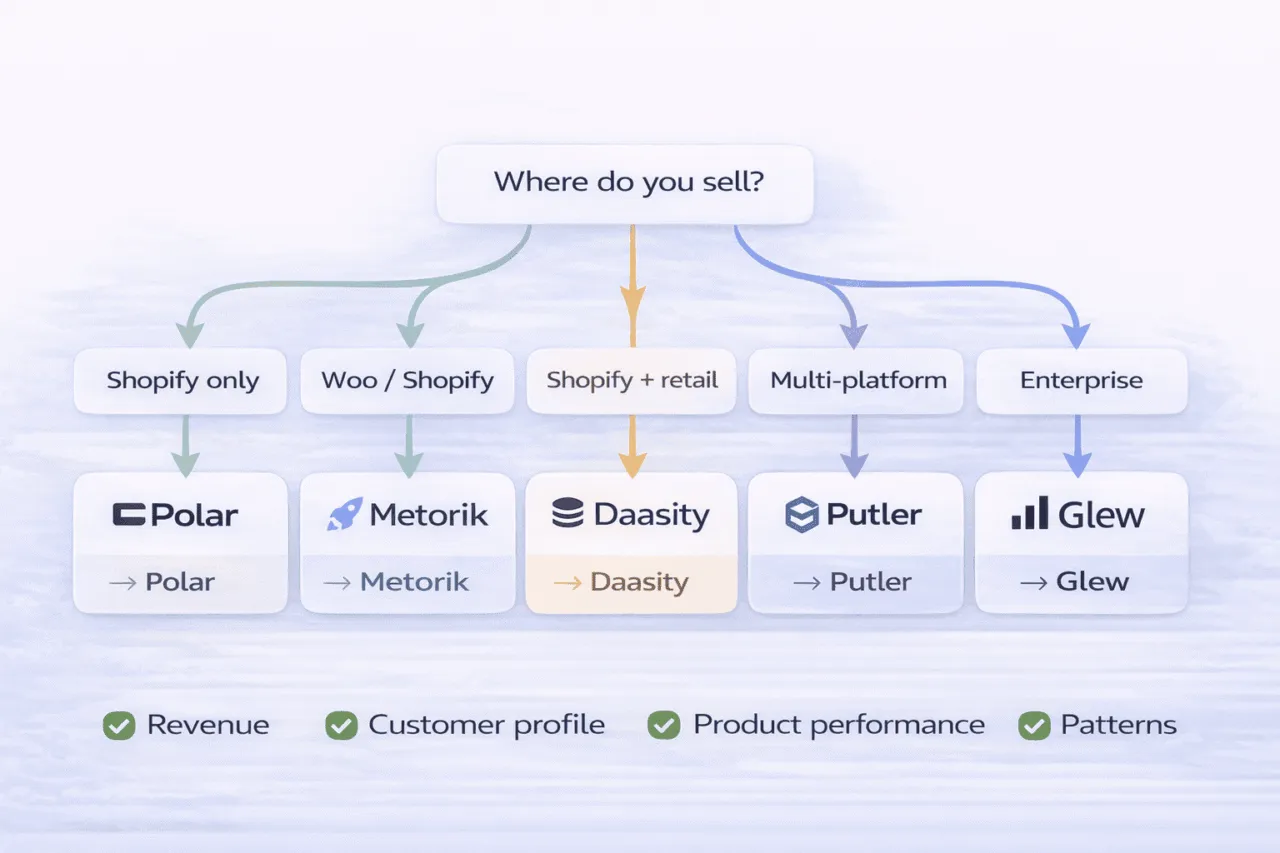
No single tool is the right fit for every seller. The right choice depends mostly on your sales channels, reporting needs, technical resources, and budget.
Start with your platform mix:
- Shopify only with heavy paid ads: Polar Analytics
- WooCommerce or Shopify with no marketplaces: Metorik
- Shopify + Amazon + retail/wholesale: Daasity
- Multiple platforms including Etsy, eBay, PayPal, Stripe: Putler
- Multiple brands or stores at enterprise scale: Glew
Choose based on your technical resources:
- Minimal technical setup: Putler, Metorik
- Moderate learning curve: Glew, Polar Analytics
- Best suited for teams comfortable with BI tools: Daasity
Choose based on your primary reporting need:
- Reducing duplicate revenue reporting across platforms: Putler
- Attribution analysis for paid marketing campaigns: Polar Analytics
- Advanced WooCommerce reporting and segmentation: Metorik
- Retail and wholesale reporting alongside DTC: Daasity
- Enterprise-level multi-brand analytics: Glew
Most businesses do not need the most advanced analytics stack. They need consistent reporting across the channels they already sell on.
Cross platform analytics works best when your data is consistent
Fragmented data is not just an inconvenience. It is a business risk.
When reporting lives across multiple platforms, it becomes difficult to answer even basic business questions confidently. Revenue numbers conflict, attribution overlaps, and customer behavior gets fragmented across tools.
Every hour spent reconciling spreadsheets is an hour not spent on growth. Every customer you cannot identify across channels is a retention opportunity you will miss.
Cross platform analytics for eCommerce is no longer a complex, expensive, enterprise-only problem to solve.
The best starting point is usually the simplest one: choose a tool that supports the platforms you already use, gives you consistent reporting, and reduces the amount of manual reconciliation your team does every week.
FAQ
What is cross platform analytics for eCommerce?
Cross platform analytics for eCommerce is the practice of consolidating data from every selling channel, payment processor, marketplace, and marketing platform into a single source of truth, instead of checking separate reports in each individual system.
Why do my Shopify, PayPal, and GA4 numbers never match?
Every platform measures revenue, attribution, and transactions differently. Shopify reports gross sales including taxes and shipping, PayPal reports net settlements after fees, and GA4 converts purchases at its own exchange rate. Attribution overlap and double counting across payment gateways widen the gap further.
How much does cross platform analytics software cost?
Pricing varies widely by platform and business size. Entry pricing for tools built for smaller stores can start around $20/month on revenue-based plans, while enterprise-focused platforms can run into the hundreds or thousands of dollars a month depending on data volume and features.
Which cross platform analytics tool is best for my business?
It depends on the platform mix. Shopify-only brands running heavy paid ads tend to fit Polar Analytics, WooCommerce or Shopify stores without marketplaces fit Metorik, brands selling into retail and wholesale fit Daasity, multi-brand enterprises fit Glew, and sellers spanning Etsy, eBay, PayPal, and Stripe alongside stores tend to fit Putler.
Can cross platform analytics eliminate attribution gaps completely?
No single tool can fully close attribution gaps caused by dark traffic, privacy changes, and cross-device journeys. Cross platform analytics helps consolidate available data more consistently and surface reporting discrepancies earlier, but some gaps are structural to how platforms track and share data.