
Shopify analytics is the reporting layer built into every Shopify store, and it tells you how your store is performing: traffic, sales, customer behaviour, and more. It’s useful out of the box, but it has real limits once your store grows.
This guide covers what Shopify analytics is, what each report shows, where it falls short, and which tools fill the gaps. By the end you’ll know what Shopify’s native reporting can do and when it’s worth adding something on top.
What is Shopify analytics?
Shopify analytics is Shopify’s built-in reporting tool. It gives you a detailed view of your store’s performance and activity: traffic type, source and quality, store speed, and transactions as they happen in real time.
You access it from your Shopify dashboard, and it’s included in every Shopify plan. What changes between plans is which reports you get and how much depth you can access.
Shopify Lite users, for example, get Analytics, Finance reports, and product analytics. Shopify Plus users get those plus sales, marketing, order, retail, and customer reports, along with a lot more detail.
What are Shopify reports and how do they work?
Shopify reports are grouped into categories, each giving you accurate insights into a specific set of business metrics. Together they’re what let you make data-driven decisions instead of guesses. Here’s what each one covers.
Finance reports
Finance reports deliver your key financial information in a clear, updated format: bills and fees, total sales, payments, liabilities, and more. Each section breaks down into detailed metrics so you can see exactly where the money is moving.
Sales reports
Sales reports show what customers are buying and how much. You can analyse sales over time, per product, and by channel, which makes it easy to spot what’s selling and what isn’t.
The data updates on its own, and you can refresh a report any time for the latest numbers. One exception: Sales by Discount takes 12 to 72 hours to update. Metrics here include gross sales, returns, cancelled orders, and sales versus payments.
Customer reports
Customer reports are available on the Shopify, Advanced Shopify, and Shopify Plus plans. They give you recent customer information you can filter by location, customers over time, average order totals, returning customers, one-time customers, and at-risk customers.
Used well, they map the entire customer journey in detail. Those insights get sharper when paired with Shopify customer segmentation techniques.
Acquisition reports
Acquisition reports show where your traffic comes from. With metrics like sessions over time, sessions by referrer, and sessions by location, they help you understand customer acquisition, average session time, and where your visitors are based.
Behaviour reports
Behaviour reports show how customers act on your store. Using metrics like top online searches, conversion, and session duration, they surface the buying patterns and preferences behind the numbers.
That insight is directly actionable. It helps you market better, improve upsell rates, set competitive prices, raise average order value, and improve retention. Behaviour data also feeds straight into your Shopify conversion rate, showing you exactly where users drop off. If you want more sales out of the same traffic, this is where you start, and the guide to driving sales on Shopify picks up from there.
Benefits of using Shopify analytics for your online store
Shopify’s native analytics carries real value for store owners. Here’s what you get out of it.
- Accurate detail on the customer journey, buying behaviour, and preferred products.
- Growth and expansion opportunities that are easier to spot than on many other platforms.
- A clearer read on which campaigns drive revenue, which sharpens your Shopify marketing strategy.
- Visibility into the factors behind retention and churn.
- Customisable reports, so you decide what to include and what to leave out.
- A Live View feature that gives a real-time overview of store performance.
- Detection of sales coming in from across the globe and across multiple channels.
- Key eCommerce trends surfaced so you can align your strategy around them.
What are the limitations of Shopify analytics?
Shopify analytics is good, but it isn’t the full picture. These are the gaps that show up as a store scales.
- Accuracy issues. According to Littledata, out of every 100 tracked orders, 12 go missing.
- Real-time cross-domain tracking is hard to set up correctly.
- No server-side tracking.
- Sales data isn’t separated between first-time and recurring transactions.
- Refund tracking isn’t reliable.
- Traffic source detail is limited.
- Not every report is available on every plan.
- It only analyses up to 250,000 customers.
Several of these are among the most common issues Shopify stores run into as they grow. Shopify analytics still gives you a solid base, but for the gaps, Google Analytics is the usual next step.
Why add Google Analytics to Shopify analytics?
Google Analytics is a common companion to Shopify’s native reporting because it covers several of Shopify’s weak spots. It’s:
- More detailed and precise on traffic data.
- Able to give you reports regardless of your Shopify plan.
- Built to analyse data in bulk.
- Compatible with most major platforms and integrations.
It’s not a clean win though. Before you add it, know the trade-offs.
Common Google Analytics issues for Shopify stores:
- Getting started isn’t easy.
- The data can be complex to read.
- It can’t track individual customer behaviour by name or email.
- Customisation is limited.
For the full setup, the Shopify Google Analytics guide walks through it step by step.
Want to go beyond Google Analytics? Try these 3 Shopify analytics apps
If Shopify’s native reporting and Google Analytics still leave gaps, dedicated Shopify analytics apps pull data across platforms and go deeper. Here are three worth looking at.
Glew Analytics
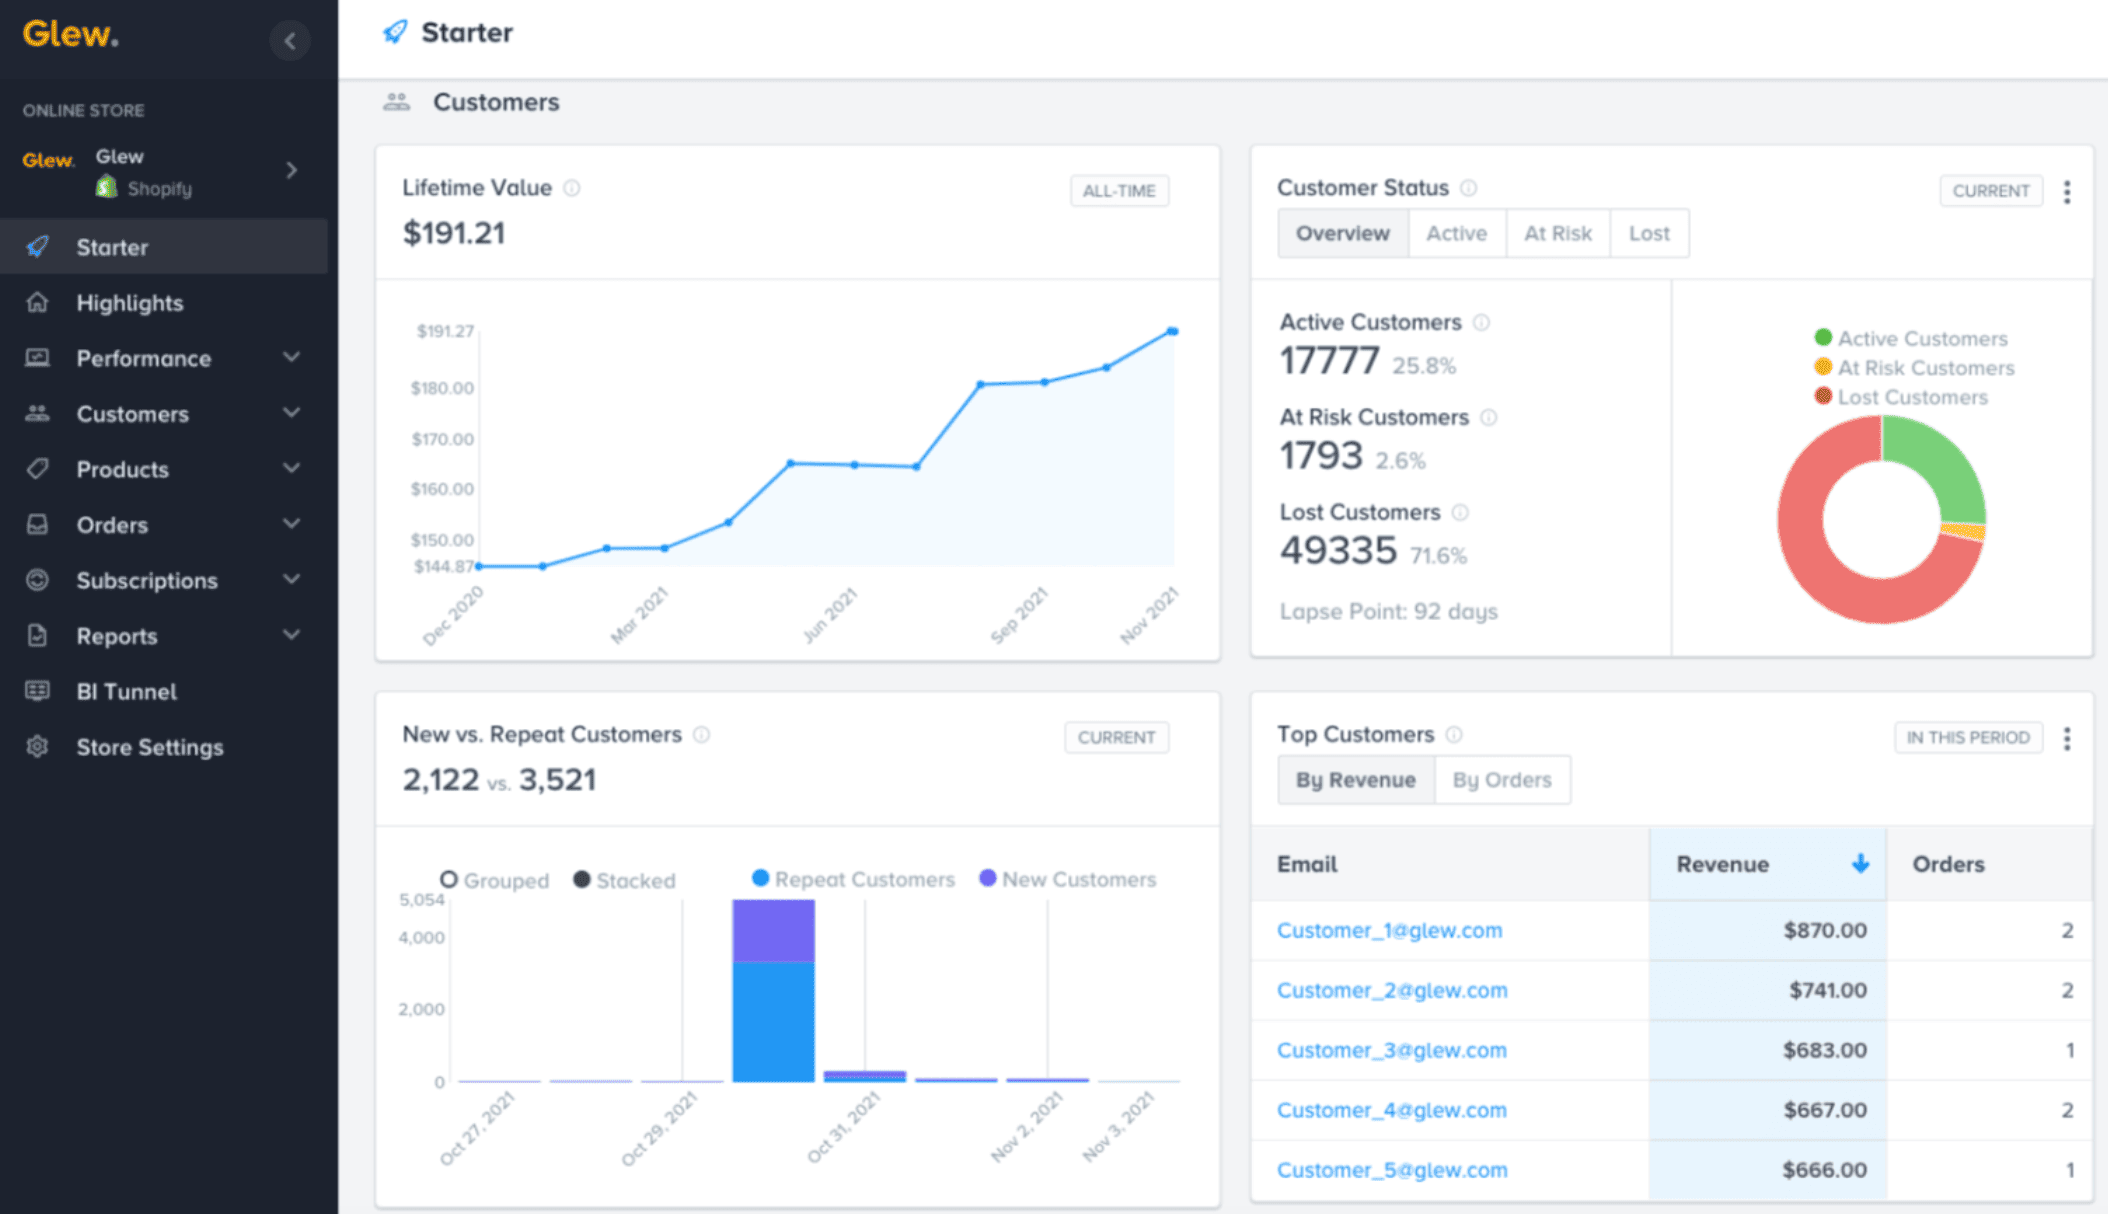
Glew is a widely used eCommerce tool that pulls Shopify reports and analyses from multiple platforms into one place. Its AI draws detail from sales, product catalog, inventory, finances, and CRM, so you’re not checking five tools to answer one question.
Putler
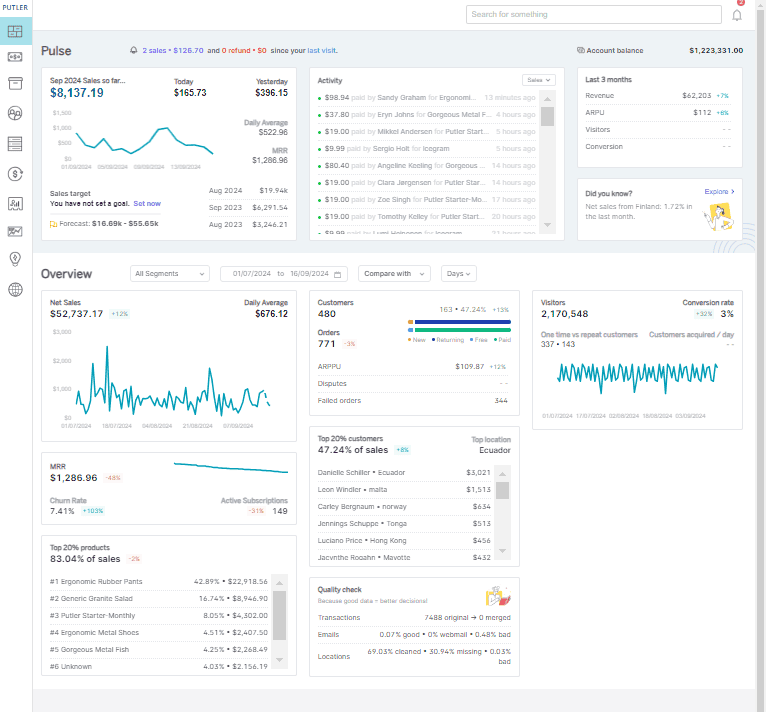
Putler is an analytics tool that blends data from the Shopify Analytics API with its own intelligence to give you a fuller view than native reporting alone. It pulls information from multiple platforms fast, supports multiple currencies out of the box, and lets you share reports across teams in one click.
Putler goes past standard Shopify reporting into deeper, customisable dashboards that make your store’s performance easy to read at a glance.
Yandex.Metrica Analytics
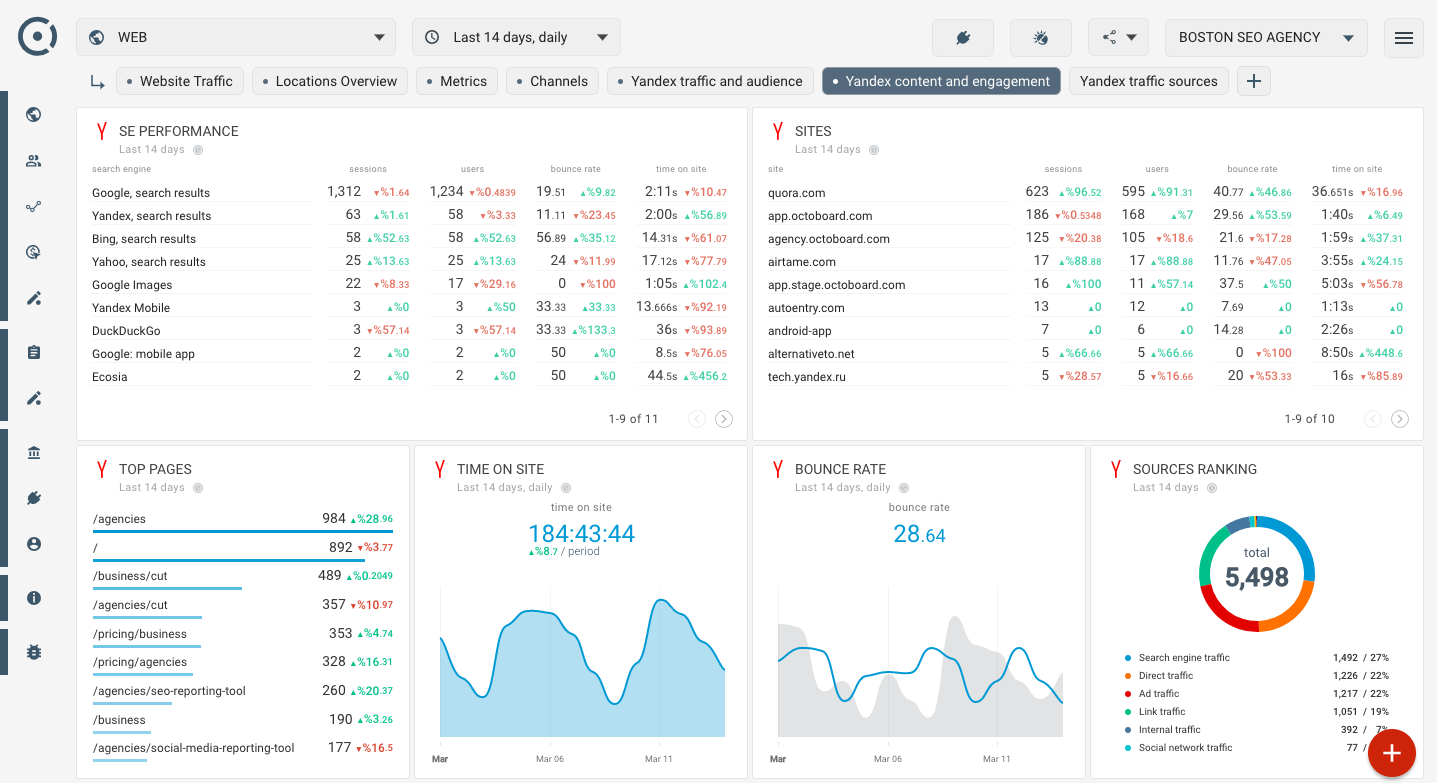
Yandex.Metrica is a web analytics framework covering session replay, ROI, traffic data, and user segments. Its interface is simple enough that anyone on the team can make sense of the data and stay informed.
Which Shopify analytics tool is the best?
Of the three, Putler stands out, and the reason comes down to range. Yandex and Glew are built for online and web stores. Putler handles both eCommerce and subscription businesses with the same setup, which no other tool on this list does.
The integration side is where it pulls further ahead. Putler connects with a wide set of payment gateways, shopping carts, and Google Analytics, and its search returns results fast enough to answer a question the moment you have it. For a direct comparison, the Glew alternative breakdown lays it out.
Here’s how the three compare on a few key points.
| Glew Analytics | Putler | Yandex.Metrica Analytics | |
|---|---|---|---|
| Free Trial | 10 days | 14 days | Free of cost |
| Inbound API | No | Yes | Yes |
| Monthly Sales Forecast | No | Yes | No |
| 2FA | No | Yes | No |
What are the main benefits of using Putler for Shopify analytics?
Putler brings a set of features aimed at the gaps in native Shopify reporting. Here’s what stands out.
Multistore reporting: All your stores are monitored from one unified platform, which saves real time if you run more than one.
Detailed reports: Putler flags data duplicates and wrong or missing entries, so the reports you act on are accurate.
Personalised insights: With 17+ integrations for top services, Putler pulls a wide data set into in-depth insights about your business.
Customer segmentation: Segment by customer, product, pricing, and more. RFM segmentation scores customers on recency, frequency, and monetary value, so you can target marketing precisely.
Cost-effective: Pricing starts at $20/month with no limit on order analysis, and most small stores land at the lower end. It scales with your revenue, so you’re not overpaying early.
Automatic data cleaning: Putler detects and fixes anomalies that usually slip through. It auto-corrects product and variation changes, fixes transaction ID errors, corrects location details, and applies currency exchange rates automatically.
Team sharing: Instant report sharing gets the right numbers to the right people fast, with access controls to protect sensitive data.
Marketing features: Beyond reports, Putler includes segmentation, forecasts, goal trackers, and trend analysis.
Conclusion
Running a Shopify store takes effort, and clear reporting is a big part of it. Shopify’s native analytics is a decent starting point, but it lacks depth and accuracy once you scale.
A dedicated tool fills those gaps. With Putler you get deeper insight into your store, accurate performance tracking, and a clearer read on where the growth is. Start with the free trial and see what your Shopify data looks like with the gaps closed.
FAQs
What are the key metrics to track in Shopify analytics?
The metrics worth watching are: total sales (overall revenue), online store sessions (visitor count), conversion rate (percentage who buy), average order value (spend per order), customer retention rate (repeat customers), cart abandonment rate (added but didn’t buy), traffic sources (where visitors come from), and top products by sales (best sellers).
Can I create custom reports in Shopify?
Yes, but it depends on your plan. Custom reports are available to merchants on the Shopify Advanced or Shopify Plus plans. They let you go deeper than the standard reports and tailor the data to your specific needs.
Why is there a data discrepancy between Shopify and GA4?
Discrepancies are common and come from several causes: incorrect Google Analytics setup, incomplete GA4 migration, ad blockers or VPNs, user consent choices, iOS and Safari limitations, visitors not fully loading pages, and certain Shopify or page-builder apps. Using an accurate analytics tool like Putler, or checking with Shopify support, helps resolve the gap.
How do I add Google Analytics to Shopify?
Create or sign in to a Google Analytics account, go to admin and select tracking info then tracking code, then copy the tracking code into your Shopify admin under online store, preferences, Google Analytics.
Why use Putler for Shopify stores?
Putler doesn’t miscalculate transactions, so you get an exact sales account. It tracks refunds, shows real-time transactions, combines multiple Google Analytics accounts in one dashboard, tracks subscription metrics like MRR and churn rate, and gives you dedicated dashboards for customers, sales, and products.
- Shopify Google Analytics: Step-by-step Guide
- Best Shopify Analytics Tools
- How to Optimize Your Shopify Store for More Sales
- How and Why to Export Your Products, Orders, and Customer Data from Shopify