
You open the Stripe Dashboard looking for a number. Maybe it’s MRR. Maybe it’s which customer just churned. Maybe it’s what your net revenue was last Tuesday after fees and refunds.
What you get instead is a transaction list.
Stripe is excellent at processing payments. The developer tooling is industry-leading, the fraud detection is solid, and the reconciliation reports do the job.
But the Stripe Dashboard was built to manage payments, not to answer business questions. The further you get from raw transaction data, the faster the gaps appear.
This guide covers every section of the Stripe Dashboard, what it actually shows you, and where it stops working as your business grows.
What is the Stripe Dashboard?
The Stripe Dashboard is the web-based control panel at dashboard.stripe.com where you manage everything connected to your Stripe account.
Payments come in, payouts go out, disputes get resolved, invoices get sent, and reports get pulled, all from here.
Stripe built it for three types of users.
- Merchants and business owners use it to monitor revenue, manage customers, and track payouts.
- Finance and accounting teams use it for reports, tax filing, and reconciliation.
- Developers use it to manage API keys, test integrations, debug webhooks, and monitor errors.
You can access it two ways.
- The full web dashboard runs at dashboard.stripe.com on any modern browser.
- The mobile app is available on iOS and Android with real-time push notifications, payment monitoring, and basic actions like refunds and Tap to Pay.
A few things like API key management, Sigma, and advanced reports are web only.
One thing worth knowing upfront: Stripe has been migrating from a simple test mode toggle to Sandboxes.
These are isolated environments with their own settings, API keys, and access controls. New accounts work with Sandboxes by default. Existing accounts still have both options available.
The main sections of the Stripe Dashboard
The Stripe Dashboard organizes everything through the left sidebar. Each section handles a different part of your business.
Knowing which one to open first saves you from clicking through four screens to find a single number.
Home
Home is the first thing you see when you log in, and it earns about 60 seconds of your morning. It gives you a quick read on how the business is doing without needing to run a report.
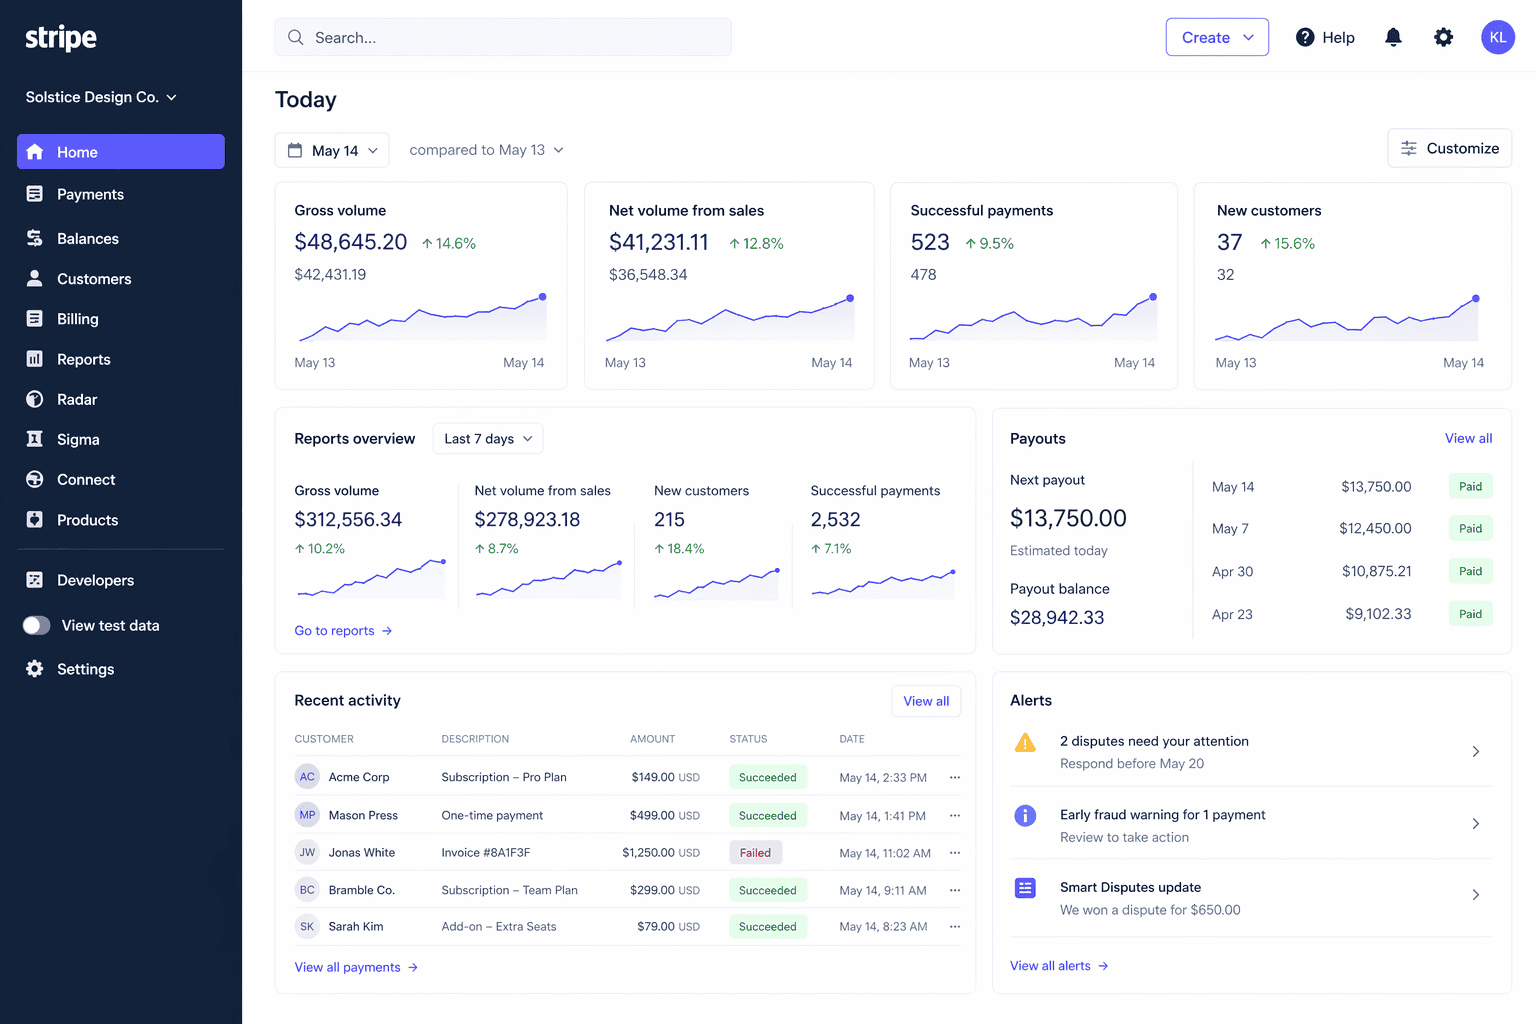
You can customize it by adding or removing widgets:
- Gross volume and net volume (gross minus fees, refunds, and disputes)
- Successful and failed payments
- New customers
- Top customers by spend
- Disputes and chargebacks
- Payouts
You can filter by date range and compare against a prior period. If you run a multi-currency business, the Home charts convert everything into your default currency using sample exchange rates.
Stripe is upfront about this: those conversions are estimates and will not exactly match your settled amounts.
Home works well for a daily check-in. For custom charts, forecasting, or segmentation, you need to go into Reports or Sigma.
Payments
The Payments section is where every charge and PaymentIntent on your account lives. Each entry shows the amount, currency, payment method, customer, status, and risk level.
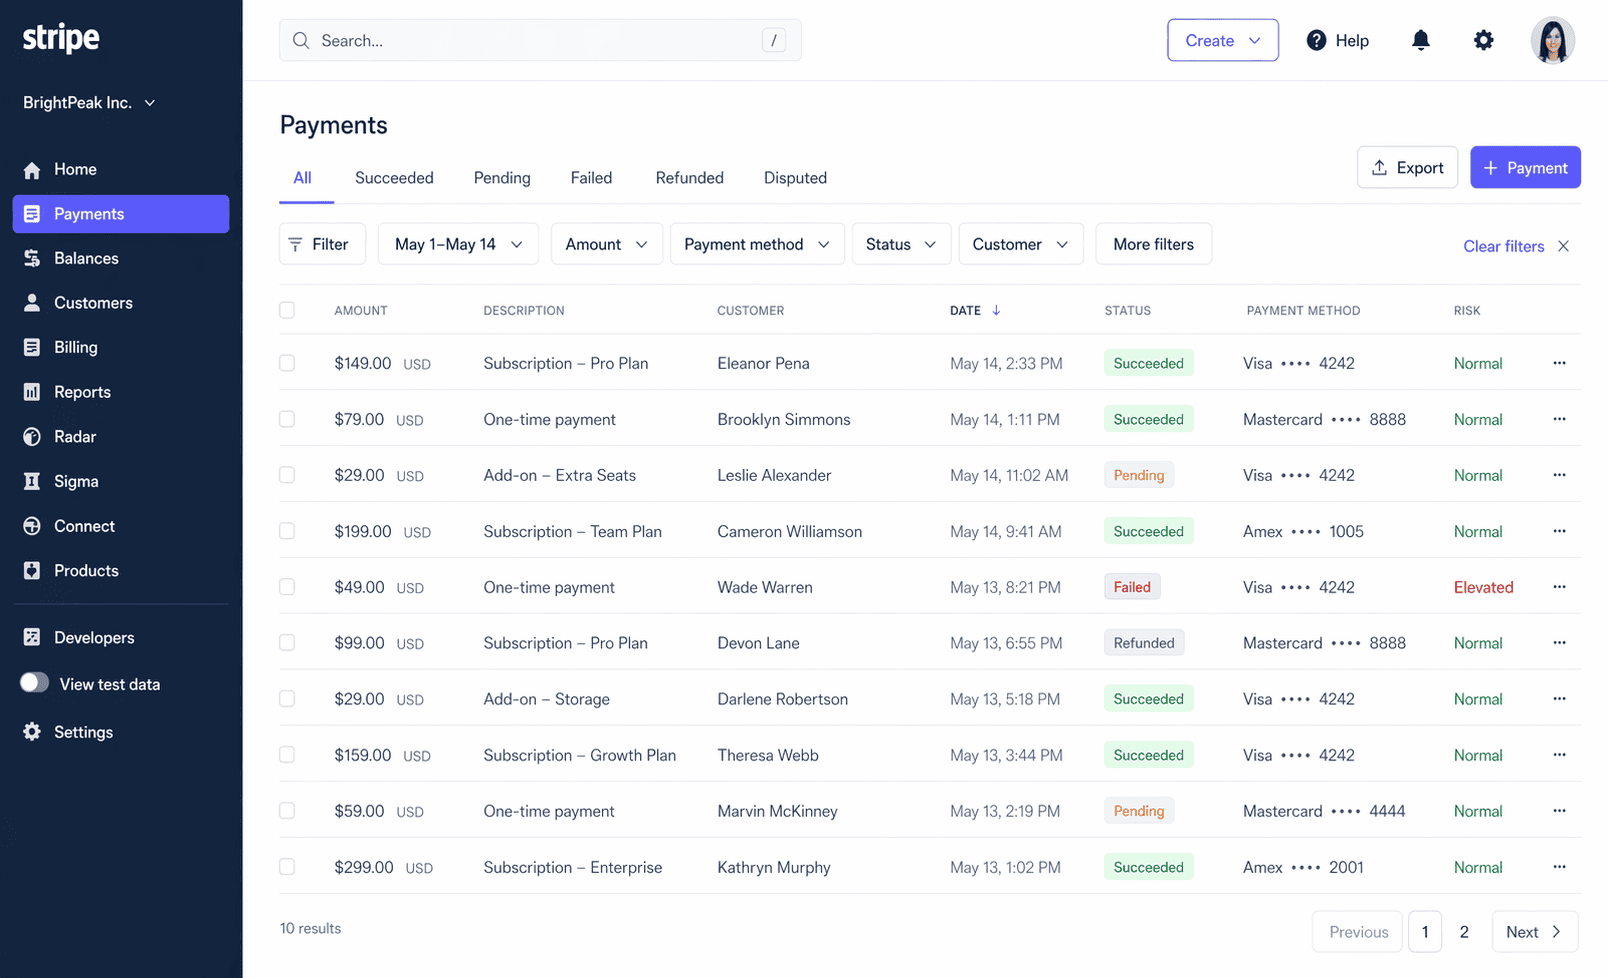
Status options include succeeded, pending, failed, uncaptured, refunded, and disputed. You can filter by any of these, plus date range, payment method, amount, and metadata.
Clicking into a payment gives you the full detail view:
- Customer details including email, card brand, and last four digits
- Amount, fees, and net payout
- Risk level (normal, elevated, or highest) and a numeric risk score from 0 to 99 if you have Radar for Fraud Teams
- The Outcome object showing network status and reason
- A full timeline of events and API logs
- Metadata attached to the payment
From here you can issue a full or partial refund, add the card to a block or allow list, send a receipt, or add notes with team mentions.
Disputes live inside Payments too. Each dispute shows the card network reason code, the cardholder’s submission, and your options to accept or counter.
If you counter, Stripe walks you through building your evidence. Smart Disputes uses AI to generate evidence automatically and only charges you if you win.
Stripe also surfaces Early Fraud Warnings before a dispute gets formally filed, giving you time to act.
Billing
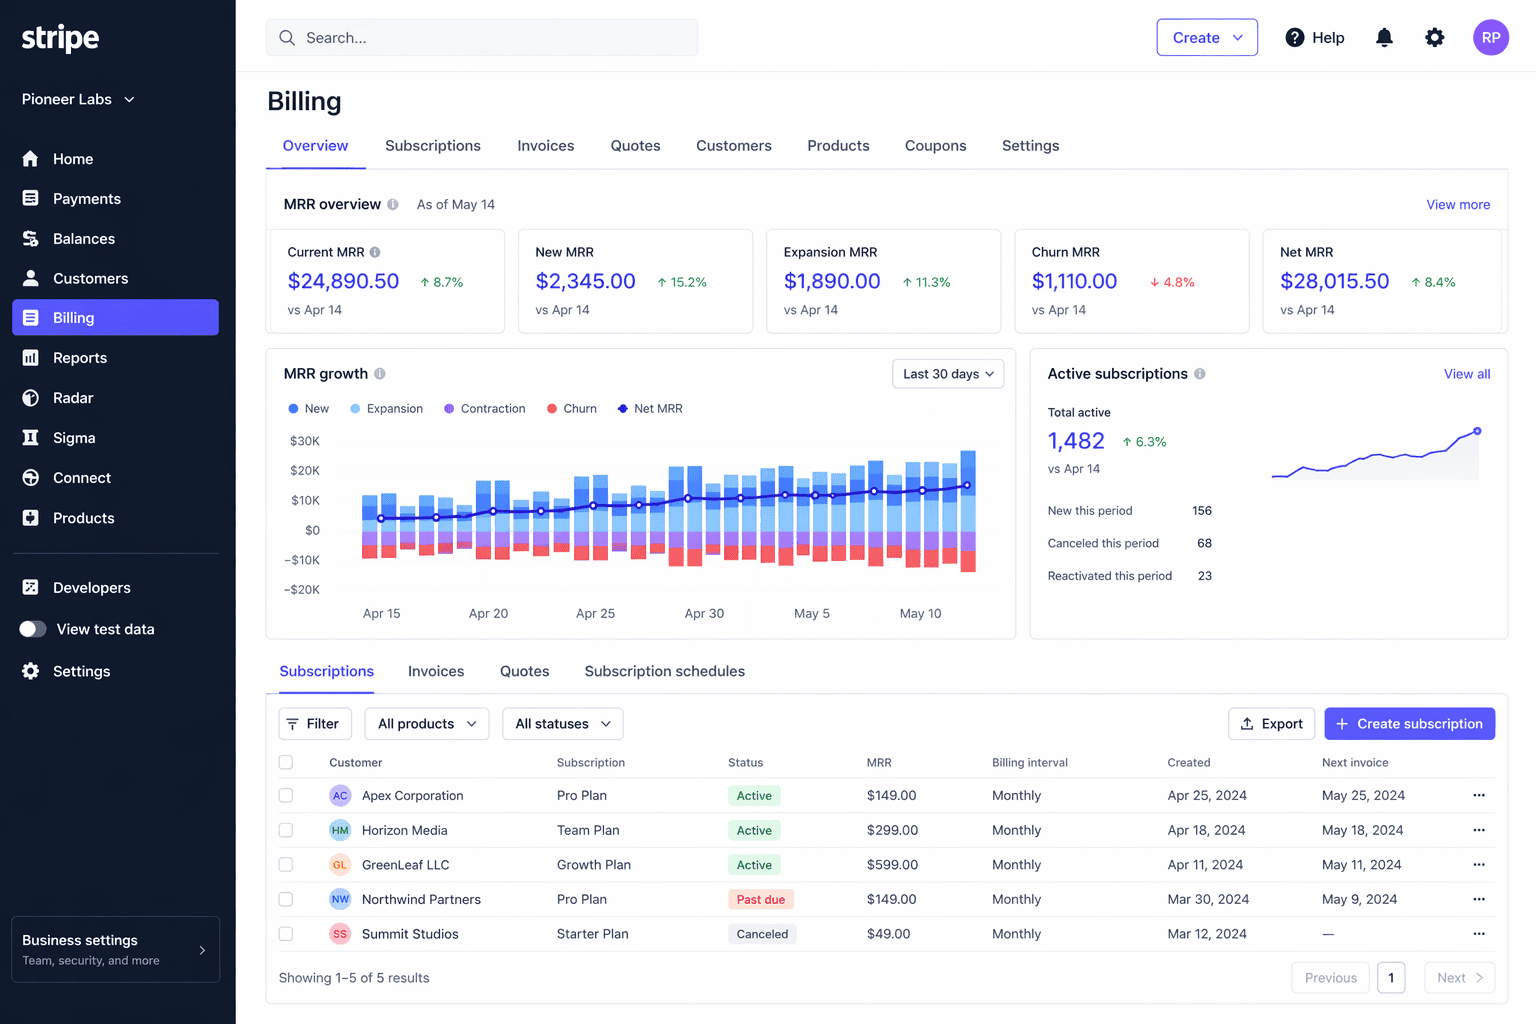
Billing is where you manage everything related to recurring revenue. It’s one of the most feature-rich sections in the dashboard.
Here’s what lives here:
- Subscriptions: Create, edit, pause, cancel, and schedule subscription changes. Schedules support up to 10 phases.
- Invoices: Send manually or auto-charge. Delivery options include auto-charge, email with link, email PDF only, or manual payment link.
- Quotes: Build and send quotes that convert to subscriptions or invoices on acceptance.
- Customer portal: A self-service page where customers manage their own subscriptions, switch plans, and cancel. Supports up to 10 products.
- Coupons and promotion codes: Set discounts as once, forever, or repeating. Add expiration dates, maximum redemptions, and minimum amounts.
- Tax rates: Inclusive or exclusive, percentage-based. Once created, the percentage, country, and state cannot be changed.
- Usage-based billing: Meter-based pricing with graduated, volume, and package tiers. Decimal pricing supported.
- Revenue Recognition: A paid add-on that handles ASC 606 and IFRS 15 compliance. Generates income statements, balance sheet reports, A/R aging, and revenue waterfalls. Data has up to a 4-hour lag.
Billing analytics lives here too. It shows MRR and MRR growth broken down by new, upgrade, downgrade, and churn, active subscribers, gross and net MRR churn rate, ARPU, a subscriber LTV estimate, revenue retention by cohort, and peer benchmarks.
Customers
The Customers section stores profiles for everyone who has paid or been invoiced through your Stripe account. Each profile includes name, email, billing and shipping address, phone, currency, and preferred locale.
From the profile you can see their full payment history, active subscriptions, saved payment methods, invoices, quotes, and notes.
Here’s the gap that catches most people off guard. There is no native lifetime value field per customer.
Stripe shows a top customers list on the Home screen sorted by spend, but there is no built-in RFM segmentation, behavioral scoring, or churn risk indicator. You can see who paid. You cannot see who is about to leave.
If those signals matter to your business, you’ll need Sigma or a dedicated analytics tool to surface them.
Products and prices
This is your product catalog. Every item you sell through Stripe lives here, whether it’s a one-time product, a subscription plan, or a usage-based service.
Product fields include name, description, image, tax code, statement descriptor, and unit label.
Pricing models available:
- Flat rate per unit
- Package pricing (charge per bundle)
- Graduated tiered (different rates at different volume bands)
- Volume tiered (one rate applies to the total quantity)
- Usage-based and metered
- Custom or pay-what-you-want
Prices support recurring intervals of day, week, month, or year with custom interval counts. You can set a default price per product and archive old prices without deleting them.
Lookup keys let you reference a price by a stable name even if you recreate it later.
Balances and payouts
The Balances section shows you exactly where your money sits at any given time.
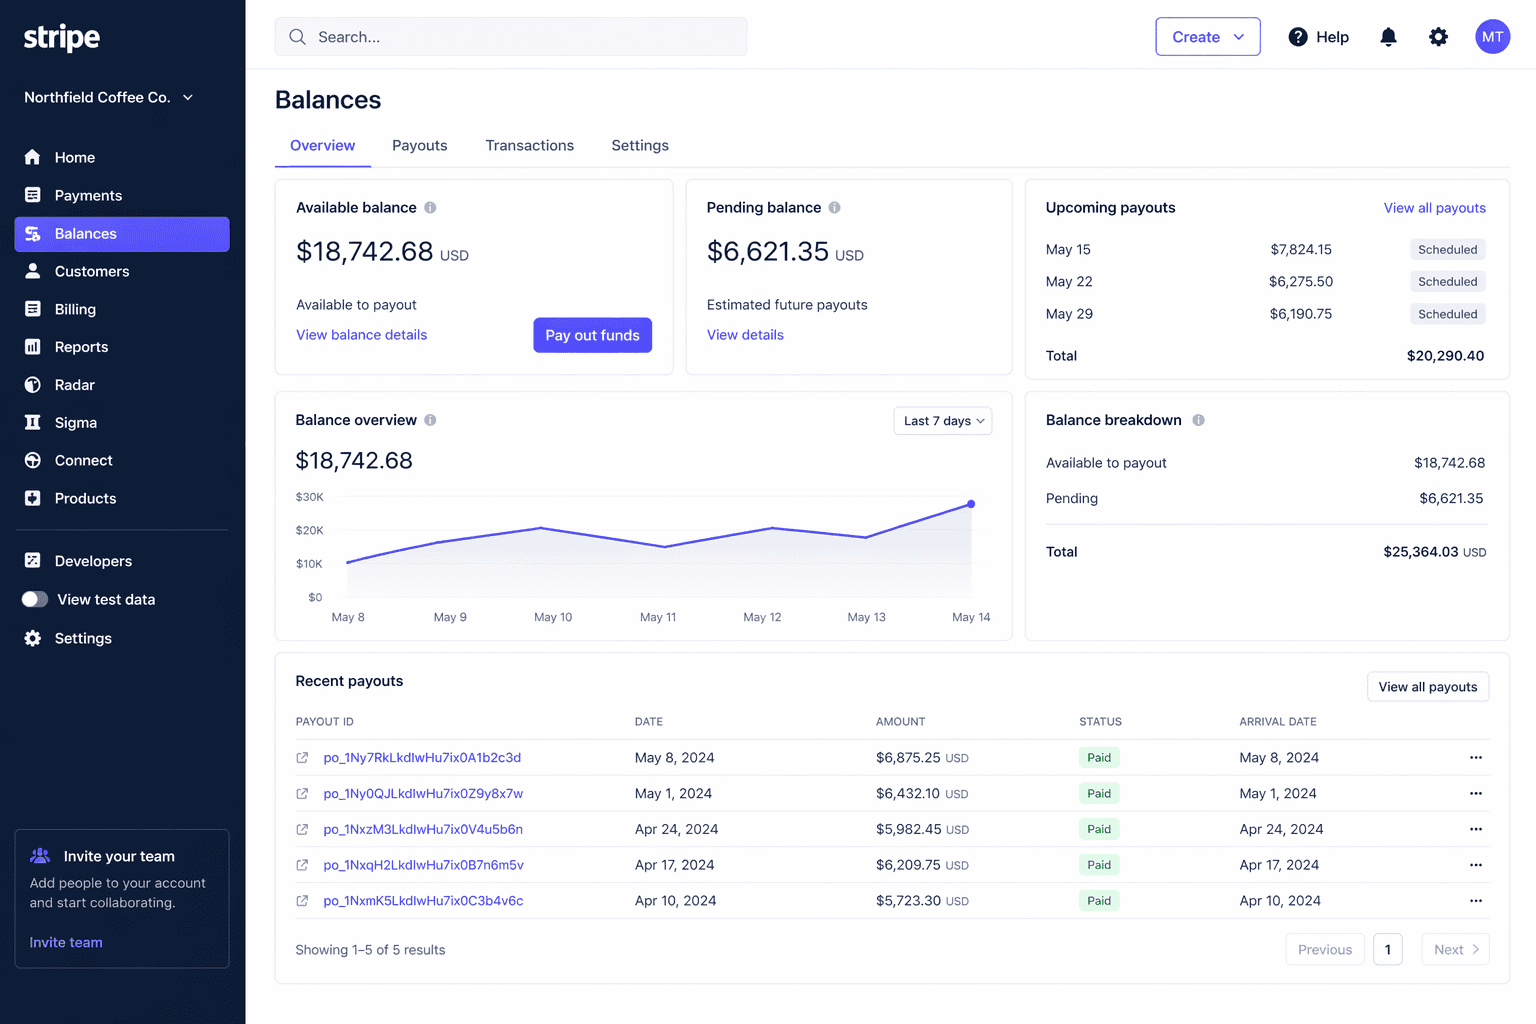
Balance types include:
- Payments balance: Funds from completed transactions currently held by Stripe
- Available balance: Funds ready to be paid out to your bank
- Pending balance: Funds from recent transactions still in the settlement window
- Reserve balance: Funds held back based on your account risk profile
- Issuing balance: Funds available for card spend if you use Stripe Issuing
Standard payouts arrive in 2 business days in most cases. You can set your payout schedule to daily, weekly, or monthly automatic, or switch to manual payouts if you want full control over timing.
Instant Payouts land within 30 minutes, any day including weekends. The fee is 1% in most markets and 1.5% in the US, Australia, New Zealand, and a few others.
There is a cap of 10 instant payouts per day. Not all accounts are immediately eligible and only card-funded balances qualify.
The payout timeline shows every status change including processing, paid, failed, and returned, along with the reason for any failure.
Reports
Reports is where you go for financial reconciliation and compliance. Stripe gives you a solid set of prebuilt reports at no extra cost.
Free reports include:
- Balance summary and balance change from activity
- Payout reconciliation
- Fees report
- Tax report (itemized and summarized, by jurisdiction)
- Connect platform variants of the above
Every report downloads as a CSV. Revenue Recognition reports also export as PDF and Excel. You can schedule any report to be emailed daily, weekly, or monthly.
The Reports API lets you trigger report generation programmatically and retrieve the file via webhook.
One limitation worth knowing: all financial reports filter to a single currency at a time.
If you sell in multiple currencies, you need to run reports separately per currency or use Sigma to aggregate. For a deeper look at what Stripe reporting covers and where it stops, this breakdown covers the full picture.
Radar
Radar is Stripe’s fraud detection system. It scores every card transaction on a risk scale from 0 to 99 using signals from Stripe’s global network.
Stripe claims 92% of cards seen on its platform have been encountered before, which gives the model strong signal for flagging unusual behavior.
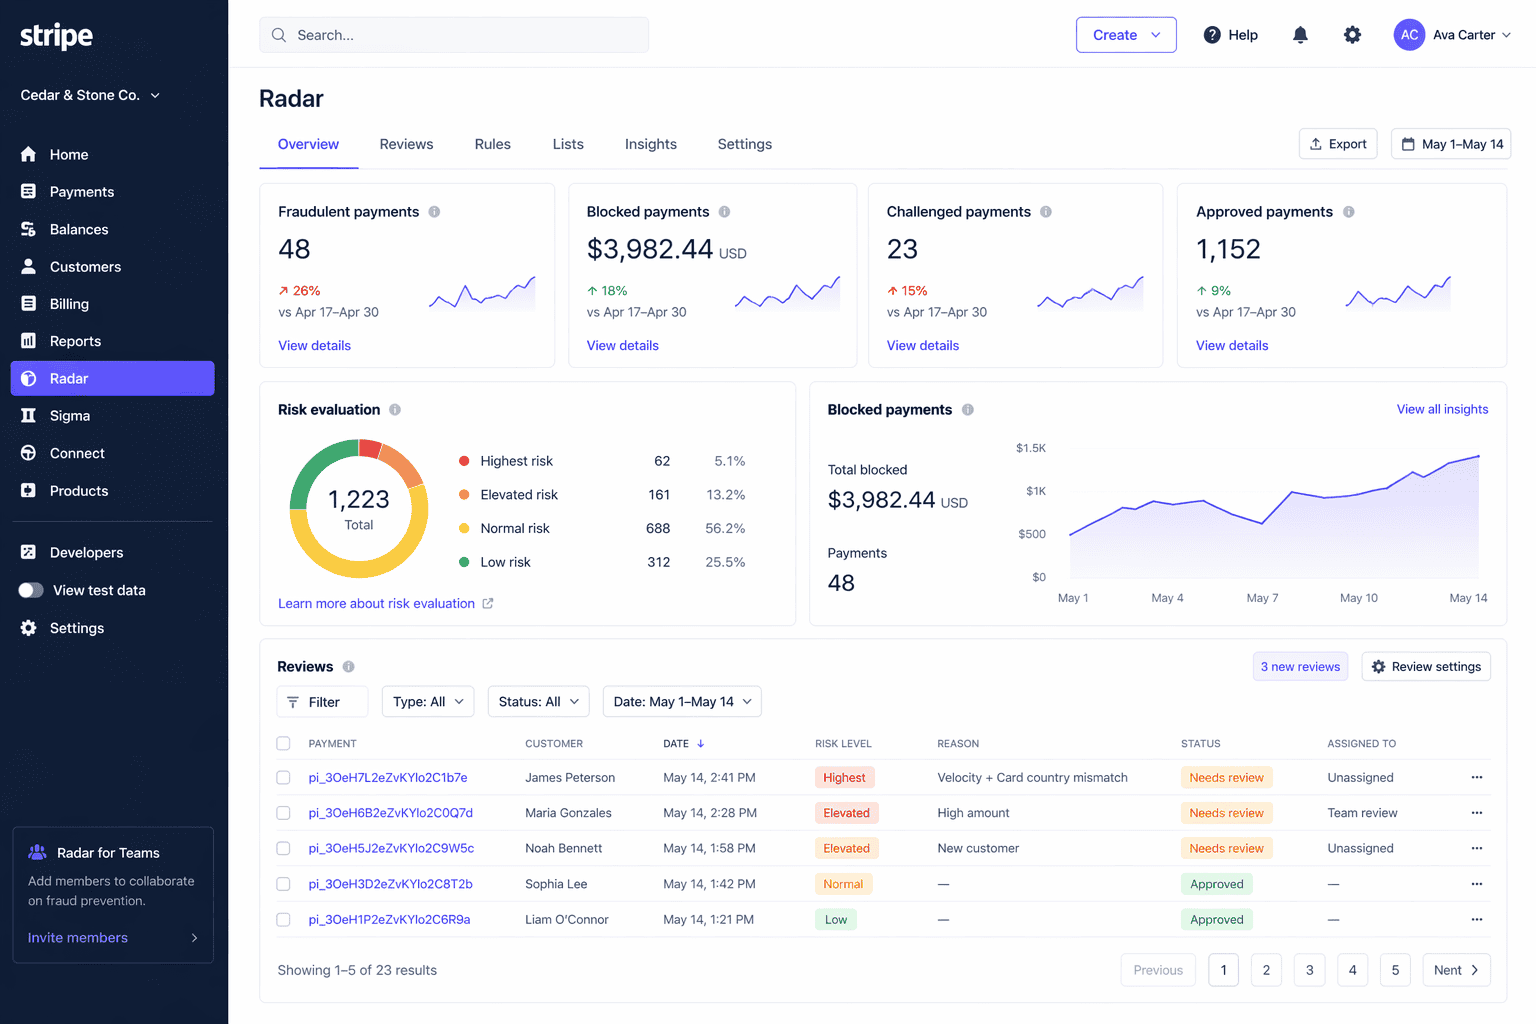
There are few tiers.
- Basic Radar is free on standard pricing and gives you ML-based scoring, automatic blocking of highest-risk payments, and built-in CVC, AVS, and 3DS triggers.
- Radar for Fraud Teams costs $0.02 per screened transaction and adds custom rules, a review queue, allow and block lists, rule backtesting, a natural-language rule builder called Radar Assistant, and Smart Refunds which predicts which refunds are likely to become disputes.
- Dispute prevention add-ons are also available. Visa RDR resolutions cost $15 each. Mastercard and Ethoca resolutions cost $29 each.
The numeric risk score and Risk Insights panel are gated behind the paid tier. On the free tier you only see a risk label.
Sigma
Sigma is Stripe’s custom SQL reporting environment. It gives you direct read access to your Stripe data through a Presto-based SQL interface inside the dashboard.
You can query payments, subscriptions, customers, payouts, disputes, Connect data, and Issuing data.
The Sigma Assistant lets you type a question in plain English and generates the SQL for you.
You can save queries, share them with teammates, schedule CSV exports by email, and publish custom reports to your dashboard.
Pricing restructured in September 2025:
- Up to 250 charges: $15/month or $10/month on annual billing
- Up to 2,500 charges: $60/month annual
- Up to 10,000 charges: $225/month annual
- Up to 25,000 charges: $450/month annual
- Above 50,000 charges: custom pricing
There is a 30-day free trial. Data refreshes approximately every 3 hours.
Tax
Stripe Tax handles automatic sales tax, VAT, and GST calculation across 100+ countries, all US states, all EU member states, and major APAC markets.
From the dashboard you can manage registrations, set up threshold monitoring with email alerts for economic nexus triggers, view tax collected by jurisdiction, and configure product tax codes.
Pricing is 0.5% per transaction where you are registered. Tax Complete starts at $90/month on an annual contract and includes Stripe filing on your behalf in 90+ countries.
Connect
Connect is for platforms and marketplaces that need to pay third parties. Three account types are available:
- Standard: Connected users get full access to their own Stripe dashboard and handle their own disputes. Least engineering required.
- Express: Stripe hosts onboarding. Connected users see a simplified Express Dashboard. The platform controls dispute and refund responsibility.
- Custom: Fully API-driven. The connected user has no visibility into Stripe at all. The platform builds everything and bears full liability.
From the Connect dashboard you can view all connected accounts, monitor onboarding status, configure payout controls, view application fees, and manage fraud review queues across your platform.
Terminal
Terminal brings in-person payments into your Stripe account so online and offline revenue sit in the same dashboard.
Hardware options include:
- Stripe Reader M2 at $59 (mobile Bluetooth)
- Stripe Reader S700 at $299 (countertop smart display)
- Stripe Reader S710 at $299 (handheld smart display)
- Tap to Pay on iPhone and Android (no hardware needed)
From the dashboard you can manage locations, pair readers, configure custom splash screens, and install POS apps directly onto compatible readers. In-person card transactions cost 2.7% + $0.05.
Identity
Identity lets you verify government-issued ID documents and run biometric selfie matching. You can use a Stripe-hosted flow or embed it directly into your own UI.
The dashboard shows each verification session with its status, the ID images, selfie, and match result. Pricing is $1.50 per verification and $0.50 per US SSN lookup.
Issuing
Issuing lets you create virtual and physical Visa and Mastercard cards for your business or your users. It is used for expense management, employee cards, and embedded fintech products.
From the dashboard you manage cards, cardholders, spending controls by amount, velocity, merchant category, or geography, and view real-time authorization feeds.
The no-code rules engine added in 2024 lets you set spending controls without writing API code. Virtual cards cost $0.10 each. Physical cards cost $3.50. International transactions cost 1% + $0.30.
Atlas
Atlas handles startup incorporation for founders anywhere in the world who want to set up a US Delaware C-Corp or LLC.
It costs $500 as a one-time fee and includes state filing, stock issuance, EIN application, 83(b) election filing, and a year of registered agent service.
The dashboard gives you a document vault, a post-incorporation checklist, and access to partner perks including $2,500 in Stripe credits and $50,000+ in credits from AWS, Xero, Mercury, and others.
Climate
Climate lets you direct a percentage of your revenue toward carbon removal projects. You choose the percentage, Stripe routes the funds to Frontier’s carbon removal portfolio, and you get impact updates and embeddable badges for your checkout, invoices, and receipts.
Climate Orders let you pre-order specific tons of carbon removal for more precise net-zero claims. There is a 3% order fee on top of the tonnage cost. Contributions are non-refundable.
Developers and Workbench
Workbench replaced the old Developers Dashboard for new accounts in August 2024. It is the technical hub of the Stripe Dashboard.
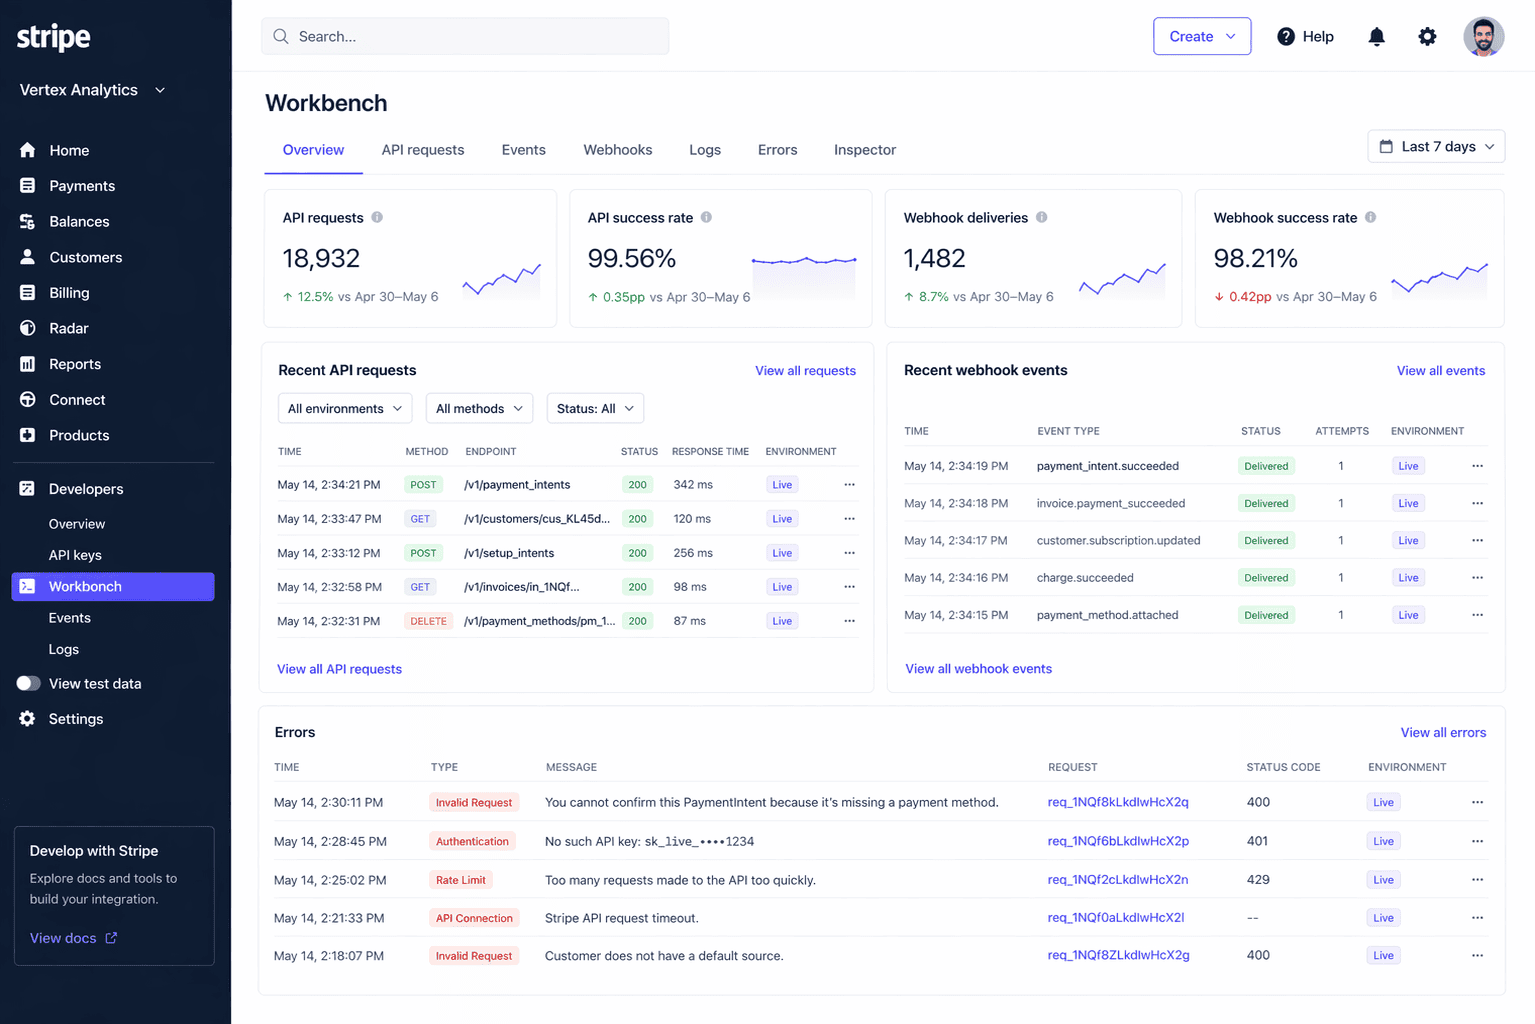
Tabs inside Workbench:
- Overview: Success rate, recent errors, and API version status
- Errors: Filterable error log with request IDs
- Logs: Every API request with status code, method, endpoint, and response
- Events: Full event history with JSON payloads and resend option up to 15 days after event creation
- Event destinations: Webhook endpoints, Amazon EventBridge, Azure Event Grid
- Shell: Browser-based CLI for running GET, POST, and DELETE requests
- API Explorer: Interactive builder with multi-language SDK code generation
- Inspector: Shows the underlying JSON of any object currently open in the dashboard
API keys live here too. Stripe supports publishable keys, secret keys, and restricted keys with granular per-resource permissions and IP allowlisting.
Secret keys show only once on creation. Stripe auto-detects exposed keys on GitHub and similar platforms and flags them immediately.
Stripe Apps are installed from here too. The marketplace has 50+ partner apps including Xero, Mailchimp, DocuSign, Intercom, and Ramp.
Settings
Settings controls how your Stripe account looks and operates.
Key areas:
- Business details: Public name, support email, support URL, phone, and address shown on receipts and invoices
- Branding: Logo, icon, brand color, and accent color applied across Checkout, invoices, the customer portal, and receipts
- Statement descriptors: Up to 22 characters plus a 2 to 10 character dynamic prefix
- Team and security: Invite team members, assign roles, enforce 2FA, configure SSO via SAML, and view security history
- Roles available: Account Owner, Administrator, Developer, Analyst, View Only, Support Specialist, Dispute Responder, Refunder, and several sandbox-specific roles
- Payout settings: Bank account linking, payout schedule, multi-currency, and reserve configuration
- Product-specific settings: Per-product config for Payments, Billing, Radar, Tax, Issuing, Terminal, Connect, and more
Stripe Dashboard analytics: what it tracks and what it misses
The Stripe Dashboard gives you a solid foundation of financial data. For most businesses getting started, it covers the basics well. But as you grow, you start asking questions the dashboard cannot answer.
Here is what Stripe tracks natively:
- Volume metrics: Gross volume, net volume, successful payments, failed payments, authorization rates, and fees collected
- Dispute metrics: Dispute rate, fraudulent dispute rate, and chargeback counts
- Refund metrics: Refund volume by period
- Billing and subscription metrics: MRR, MRR growth broken down by new, upgrade, downgrade, and churn, active subscribers, gross and net MRR churn rate, subscriber churn rate, ARPU, subscriber LTV estimate, revenue retention by cohort, and peer benchmarks
- Fraud metrics: Risk score distribution, block rate, rule performance, and Early Fraud Warning rate
- Tax metrics: Tax collected by jurisdiction and filing period
- Radar analytics: Rule-level fraud outcomes and authorization impact estimates
That’s a reasonable set of metrics. For a single-product, single-currency business doing eCommerce or SaaS, it covers most of what you need day to day.
The ceiling shows up when you start asking harder questions. Here is what Stripe does not track natively:
- True cohort LTV: The LTV figure in Billing is an estimate derived from ARPU, not actual customer behavior over time. Real cohort-based LTV requires Sigma or an external tool.
- Revenue retention by cohort for multi-currency accounts: Stripe’s own documentation confirms this chart is not available if you process in more than one currency.
- Forecasting and projections: No revenue forecasts, no what-if modeling, no projected churn. The dashboard shows history only.
- Marketing attribution: Stripe has no view of your traffic, ad spend, or acquisition channels. You cannot calculate CAC natively.
- Voluntary vs involuntary churn: Stripe does not separate customers who canceled from customers who failed to pay. Both show up as churned.
- RFM segmentation: No recency, frequency, or monetary scoring on your customer base. No way to identify your best customers, at-risk customers, or lapsed customers.
- Cross-platform revenue: Stripe only reports on Stripe. If you also accept PayPal, use Shopify Payments, or sell on Amazon, none of that data appears here.
- Multi-account consolidated view: Running multiple Stripe accounts means switching between them manually. There is no native consolidated revenue view without using Organizations plus Sigma together.
- Product-level profitability: You can see revenue by product. You cannot see margin after fees, refunds, and disputes per product.
There is also a data lag issue worth knowing. Revenue Recognition data can be up to 72 hours behind. Billing meter data can lag up to 48 hours.
Sigma data refreshes approximately every 3 hours. MRR and churn settings changes take 24 to 48 hours to show up in the charts.
Stripe is excellent at processing payments and showing you what happened. It is not built to tell you what will happen next, why certain segments are churning, or how your Stripe revenue fits into the full picture of your business.
Stripe Dashboard mobile app
The Stripe Dashboard mobile app is available on iOS and Android. It is built for monitoring and quick actions on the go, not for deep configuration or analytics work.
What you can do on mobile:
- View real-time push notifications for new payments, disputes, deposits, and failed charges
- Browse and search your payments and customer list
- Issue full or partial refunds
- Accept in-person payments via Tap to Pay on iPhone and Android
- Enter card details manually
- View your balance and upcoming payouts, including triggering Instant Payouts
- Create basic invoices and send receipts
- Lock the app with Face ID, Touch ID, or fingerprint
iOS users get a few extras. You can create Payment Links with QR codes, create and cancel subscriptions, add a card to a customer profile, and use lock-screen widgets showing MRR, net volume, and high-risk payments. Android users get four home-screen widgets.
A significant portion of the Stripe Dashboard does not exist on mobile. Here is what requires a browser:
- Test mode and Sandboxes. The mobile app shows live data only.
- API key management, restricted key creation, and webhook configuration
- Workbench including Shell, API Explorer, Inspector, and error logs
- Sigma queries and the Sigma Assistant
- Advanced reports and the Reports API
- Team member management, role assignment, SSO setup, and 2FA enforcement
- Connect advanced settings including onboarding configuration and payout schedules
- Tax registrations, threshold monitoring, and filing configuration
- Radar rules, allow and block lists, and rule backtesting
- Issuing program configuration and the no-code rules engine
- Branding, custom domain, and email configuration
- Revenue Recognition setup and reports
- Workflows builder
Support Specialists and inactive users cannot log into the mobile app at all. View-only users can log in but cannot create payments, issue refunds, or trigger payouts.
The iOS app generally rates well. The Android app sits at around 4.5 out of 5 across roughly 29,000 ratings. Two issues come up repeatedly in recent reviews.
Tap to Pay occasionally breaks after app updates and requires reinstalling to fix. The signup and verification flow on mobile does not always match the desktop experience, which causes confusion for new accounts.
Stripe Dashboard limitations
The Stripe Dashboard is good at what it was built for. But as your business grows, you start running into its edges. Here is an honest look at where it falls short.
Performance
The dashboard can be slow. A Hacker News thread from August 2025 collected dozens of responses from merchants reporting CPU usage spiking to 100% and RAM consumption exceeding 5GB on a single page load.
A related GitHub issue noted load times exceeding 30 seconds on standard hardware. For a tool you open every day, this is real friction.
Data lag
Nothing in the Stripe Dashboard updates instantly. Here is how the lag breaks down:
- Revenue Recognition: up to 72 hours behind
- Billing meters for usage-based billing: up to 48 hours behind
- MRR and churn settings changes: 24 to 48 hours to reflect
- Sigma data: approximately 3 hours behind
- Scheduled Sigma queries: delivered at 2 PM UTC the following day
If you are monitoring a fast-moving launch or reconciling end-of-month numbers, these delays matter.
MRR accuracy
Stripe’s MRR calculation has known accuracy issues. The dashboard counts subscription billing dates in UTC, which means a subscription renewing at 11 PM in New York gets counted the following day in Stripe’s charts.
Prorations, trials, and one-time charges can also affect MRR figures if not carefully filtered. For businesses where MRR is a board-level metric, verifying the Stripe number against your own calculation is worth doing.
Analytics ceiling
Stripe shows you what happened. It does not show you what will happen next, why certain segments are churning, or how different customer groups compare over time.
No cohort LTV, no forecasting, no acquisition channel analysis, no voluntary vs involuntary churn split.
Getting answers to these questions requires either Sigma (SQL knowledge needed, $10 to $450/month depending on volume) or a third-party analytics tool. Neither is free or instant to set up.
Multi-account friction
Running more than one Stripe account means switching between them manually using the account picker.
There is no native consolidated revenue view. Stripe’s Organizations feature helps partially but requires Sigma for cross-account reporting and works best with card-type payment methods only.
No cross-platform view
Stripe reports on Stripe data only. If you also accept PayPal, use Shopify Payments, sell on Etsy, or process through Square, none of that revenue appears in your Stripe Dashboard.
For multi-channel businesses, the dashboard gives you a partial picture at best.
Export fragmentation
Payments, subscriptions, invoices, balance transactions, disputes, refunds, and payouts all live in separate sections with separate CSV exports.
A finance team doing a full monthly close typically downloads multiple files and combines them manually. CSV exports cap at roughly 100,000 rows. Individual account reports cap at 10 GB.
Account freezes and fund holds
This is where Stripe’s Trustpilot rating of 2.8 out of 5 across 17,000+ reviews comes from. The dashboard gives you almost no visibility into why a hold has been placed or when it will be released.
A typical notice says your account is under review with no timeline, no specific reason, and no clear resolution path.
The dashboard’s failure to surface clear information during a hold makes an already difficult situation worse.
Customer support
Stripe offers no phone support outside enterprise contracts. Chat and email are the only options. Merchants consistently report slow resolution times and responses that say the decision is final with no further detail.
Capterra reviewers rate Stripe at 4.4 out of 5 overall but support scores pull the average down consistently.
The developer vs merchant gap
Stripe’s dashboard was built by developers for developers. The G2 rating of 4.4 out of 5 reflects the developer experience.
The Trustpilot rating of 2.8 out of 5 reflects the merchant experience. These two groups use the same tool in very different ways, and the merchant side has historically received less attention in product decisions.
How to get more from your Stripe data
Stripe’s native dashboard covers the basics well. But if you sell across multiple platforms, run subscriptions, or need answers beyond what the Reports section can give you, you will hit the ceiling quickly.
Most merchants at this stage end up in one of two places. They either pay for Sigma and learn SQL, or they add a dedicated analytics tool that connects Stripe alongside their other data sources.
Putler is one option worth knowing about. It connects to Stripe alongside PayPal, WooCommerce, Shopify, Etsy, Amazon, and 17+ other sources and pulls everything into one unified dashboard.
It automatically deduplicates transactions across sources, normalizes currencies, and surfaces metrics that Stripe does not calculate natively. That includes RFM customer segmentation, true cohort analytics, subscription metrics like MRR and churn, and revenue forecasting.
If you run multiple Stripe accounts or accept payments through more than one processor, it solves the consolidation problem without requiring SQL. Pricing starts at $20/month with a 14-day free trial and a $1 first month.
FAQ: Stripe Dashboard
How do I log in to the Stripe Dashboard?
Go to dashboard.stripe.com and sign in with your email and password. If your account has 2FA enabled you will need your authenticator app, security key, or SMS code. You can also log in via the Stripe Dashboard mobile app on iOS or Android.
Does the Stripe Dashboard have a mobile app?
Yes. The Stripe Dashboard app is available on iOS and Android. It covers payments monitoring, refunds, Tap to Pay, balance checks, and push notifications.
Test mode, Sigma, Workbench, API keys, and advanced reports are not available on mobile and require the web dashboard.
How do I see MRR and churn in the Stripe Dashboard?
MRR and churn are available inside the Billing section under the analytics overview. You can see MRR growth broken down by new, upgrade, downgrade, and churn, along with active subscribers, ARPU, and a subscriber LTV estimate.
Revenue retention by cohort is also available, but not for multi-currency accounts. For more detailed SaaS and MRR metrics, you need Sigma or a third-party tool.
Can I manage multiple Stripe accounts from one dashboard?
You can switch between accounts using the account picker in the top left corner of the dashboard. Stripe’s Organizations feature lets you manage multiple accounts under one umbrella and run cross-account Sigma queries.
There is no native consolidated revenue view though. Switching is still manual and cross-account reporting requires SQL.
How do I export data from the Stripe Dashboard?
Every report section has a CSV download option. Revenue Recognition reports also export as PDF and Excel.
You can schedule reports to be sent by email daily, weekly, or monthly. The Reports API lets you trigger and retrieve reports programmatically. Sigma queries can also be exported as CSV or scheduled for email delivery.
What is Stripe Sigma and do I need it?
Sigma is Stripe’s custom SQL reporting environment. It gives you direct query access to your Stripe data for building reports beyond the prebuilt options. Pricing starts at $10/month on annual billing for up to 250 charges and goes up to $450/month for up to 25,000 charges.
You need SQL knowledge to use it effectively. If you want custom segmentation, cohort analysis, or cross-entity joins inside Stripe, Sigma is the tool. If you want those things without writing SQL, a dedicated analytics tool is the easier path.
Make the most of your Stripe Dashboard in 2026
The Stripe Dashboard is one of the most capable payment control panels available. For processing payments, managing subscriptions, handling disputes, and running financial reconciliation, it does the job well.
Knowing its sections helps. Using the right reports saves time. Understanding the data lag stops you from making decisions on numbers that have not finished updating.
And when the native dashboard is not enough, when you need cohort LTV, forecasting, multi-channel revenue consolidation, or RFM segmentation, that is not a flaw in your business. It is just the natural ceiling of a payment processor’s built-in analytics.
The answer is not more spreadsheets. Connect your data somewhere that shows you the full picture. See how sellers are using multi-channel analytics to get there.