
You open Stripe. Revenue’s coming in. Everything looks fine.
But when your investor asks for MRR, you realize the number in your dashboard might be wrong.
When your marketing team asks which customers are about to churn, Stripe goes quiet. When you try to figure out which product is actually profitable after fees and returns, there’s no answer.

That’s cause stripe dashboard limitations.
Stripe is a world-class payment processor. It was never built to be your analytics platform. This article covers every reporting gap in the Stripe dashboard, what each one costs you in real terms, and what to do about it.
What the Stripe dashboard does well
Start here, because credit matters.

Stripe gives you real-time payment tracking, dispute management, payout reconciliation, and fraud detection that actually works.
The Radar engine processes signals from over $1.4 trillion in annual transactions and blocks an average of $500 million in fraudulent charges every single month. For a payment processor, that’s exceptional.
The dashboard supports 135+ currencies and 100+ payment methods across 47 countries. Stripe Billing manages subscriptions, invoices, and plan changes for businesses that run recurring revenue. The mobile app lets you watch payments come in from anywhere.
If your only job is accepting money reliably, Stripe does it better than almost anyone.
The problem is that most business decisions require more than payment data. That’s where the gaps start.
Where the Stripe dashboard falls short for analytics
No customer lifetime value tracking

Stripe can’t tell you how much a customer is actually worth.
The dashboard shows transaction totals. It shows what someone paid and when they paid. But it cannot calculate customer lifetime value, and it cannot show you the LTV to CAC ratio that tells you whether your business model is actually working.
The benchmark for a healthy SaaS or eCommerce business is 3:1. Stripe shows you neither number.
No RFM segmentation or customer grouping

Stripe shows you a list of customers. It does not tell you which ones are about to leave, which ones are your highest value repeat buyers, and which ones haven’t purchased in six months.
That kind of segmentation — Recency, Frequency, and Monetary value — is how retention marketing actually works. Without it, every campaign goes to your entire list.
Your best customers get the same email as someone who bought once two years ago and never came back. That’s not a targeting strategy. That’s a broadcast.
No product-level profitability analysis

Stripe can group revenue by product. What it cannot do is tell you which product is actually making you money.
There’s a big difference between gross revenue and actual margin. Stripe fees, refund rates, and return costs vary by product.
A product generating $50,000 in monthly revenue might be losing money once you factor in a 12% refund rate and Stripe’s processing fees on every one of those refunds.
Stripe keeps its processing fee even when you issue a refund. On a $100 transaction, that’s roughly $3.20 gone regardless of outcome.
MRR accuracy is only 75 to 85%

This one is the most dangerous limitation for SaaS founders specifically.
An analysis of over 50,000 subscriptions found that 67% of SaaS companies report meaningful discrepancies between their Stripe dashboard MRR and their actual recurring revenue. The typical accuracy range sits between 75% and 85%.
That means your MRR could be off by 15 to 25% in either direction.
The reasons stack up fast. Stripe uses UTC timestamps, which pushes month-boundary activities into the wrong reporting period.
Trial users get counted as active subscribers even though only 25 to 50% of trials convert. Prorations from mid-month plan changes aren’t always handled correctly. One-time purchasers can appear as recurring customers.
Churn tracking requires Billing and still has gaps

Without Stripe Billing, you get zero churn metrics. Nothing.
Even with Billing enabled, what you get is incomplete. Stripe shows you aggregate churn rate but cannot tell you why customers are leaving.
There’s no cancellation reason tracking, no voluntary versus involuntary churn breakdown, and no way to segment churn by plan type, customer size, or geography.
An acceptable aggregate churn rate can hide a serious retention problem within a specific customer segment.
You might be losing 40% of your annual plan customers while monthly customers stay steady, and Stripe’s dashboard would show you a number that looks perfectly fine.
Cohort analysis is shallow and gated

Stripe Billing includes a basic retention by cohort chart. It tracks how many subscribers from a given signup month are still active over time.
But it only tracks subscriber counts, not revenue cohorts. It is unavailable entirely for multi-currency accounts.
It cannot group cohorts by acquisition channel, plan tier, or geography.
And building anything more sophisticated in Stripe Sigma requires 30 to 50 lines of SQL with window functions that breaks the moment your pricing model changes.
Analytics data lags up to 72 hours

Real-time is not what Stripe delivers on the analytics side.
Revenue Recognition data takes up to 72 hours to appear in reports. Billing meter data takes up to 48 hours to settle.
Financial reports for a given day typically arrive by noon the following day. Sigma scheduled query results are not available until 2pm UTC the day after they run.
For businesses running product launches, flash sales, or time-sensitive campaigns, this lag makes the dashboard useless as a decision-making tool in the moments that matter most.
Data export is fragmented and capped

Getting all your Stripe data out is not a single action. It is a process.
Payments, subscriptions, invoices, balance transactions, disputes, refunds, credits, and payout reports all live in different sections of the dashboard. Each one needs to be exported separately.
Finance teams routinely download up to eight separate CSV files, pull them into Excel, and run VLOOKUPs to piece together a complete picture.
That process takes 2 to 3 days per month and introduces manual error at every step.
On top of the fragmentation, individual account reports cap at 10 GB. The exports themselves are formatted for engineers pulling data into warehouses, not for finance teams doing month-end reconciliation.
No cross-source data consolidation

Stripe reports on Stripe transactions. That’s it.
If you sell through Shopify and accept payments via PayPal and Stripe simultaneously, you have three separate dashboards showing three separate revenue numbers with no unified view anywhere.
The real danger comes when you connect both Shopify and Stripe to your accounting software without a deduplication layer. The same transaction gets recorded twice.
Your reported revenue doubles. At $50,000 in monthly sales, combined platform fees across Stripe and Shopify can reach roughly $3,000 per month in costs that never appear in Stripe’s reporting.
Multi-account reporting requires workarounds

Running multiple Stripe accounts for different products, brands, or regions is common. Getting a unified view of all of them is not straightforward.
Stripe Organizations enables consolidated reporting across accounts but requires explicit setup, works only with card-type payment methods, and forces you to view one currency at a time.
Without Organizations, each account is completely isolated. You switch between them manually, one at a time, with no way to see aggregated performance across all of them simultaneously.
Advanced reporting is locked behind Stripe Sigma and requires SQL

Stripe’s answer to the analytics gap is Sigma. It is a powerful tool if you know SQL. Most founders and finance teams do not.
Sigma starts at $10 per month for accounts processing up to 250 charges and scales to $450 per month for up to 25,000 charges, with per-charge overage fees beyond that.
Even at that price, Sigma has hard limits. There are no calculated fields, no custom metric definitions, and no way to define MRR the way your business actually calculates it.
More fundamentally, Sigma only queries Stripe data. The moment you need to combine payment data with your CRM, marketing platform, or product usage data, Sigma cannot help you.
No web analytics or traffic-to-revenue correlation

Stripe has no traffic tracking, no conversion funnels, no session data, and no marketing attribution of any kind.
You cannot connect ad spend to actual revenue inside Stripe. You cannot calculate customer acquisition cost natively. You cannot see which campaigns drove paying customers and which ones drove browsers who never converted.
The common workaround is combining GA4 with Stripe via conversion events or webhooks.
In practice, this breaks in several ways. Stripe’s hosted checkout sits on a different domain, which breaks session continuity.
GDPR cookie consent banners cause 20 to 60% of traffic to go completely untracked. Subscription renewals are invisible to GA entirely.
No sales heatmap or time-based purchase insight

Stripe cannot tell you when your customers actually buy.
There is no peak hour analysis, no best day of the week breakdown, and no seasonal pattern visibility inside the dashboard.
Businesses running paid campaigns waste budget pushing ads during low-conversion windows.
Knowing that 40% of your weekly revenue lands on Thursday evenings between 7pm and 10pm changes how you allocate budget, schedule campaigns, and staff your team. Stripe will not give you that number.
No refund trend analysis

Individual refund transactions are visible in Stripe. Refund trends are not.
The dashboard shows you that a refund happened. It does not show you that refunds on one specific product have climbed 18% over the last 60 days.
It does not segment refund rates by product, customer type, or geography. It does not flag when a refund pattern signals a fulfillment problem or a product quality issue.
Average eCommerce return rates sit around 18%. Without refund trend visibility, that cost never gets interrogated.
No revenue forecasting or forward-looking projections

Every number in the Stripe dashboard looks backward.
There is no revenue forecast, no growth projection, and no modeling tool of any kind built into the platform. You can see what happened last month.
You cannot see what is likely to happen next month based on your current subscription mix, trial pipeline, and historical conversion rates.
Stripe data is structured for engineers, not finance teams

Open a raw Stripe data export and the first thing you notice is that it was not designed for a CFO.
The object structure uses developer-oriented terminology. Balance transactions, transfer reversals, application fees, and payout reconciliation items are not labeled in ways that map intuitively to standard accounting categories.
Finance teams without an engineering background routinely misclassify transaction types during reconciliation, introducing errors that compound across monthly closes.
No geographic revenue breakdown

Stripe collects billing address data on every transaction. It does not turn that data into anything useful inside the dashboard.
There is no country-level revenue breakdown, no geographic performance heatmap, and no regional analysis of any kind built into native reporting.
For businesses selling internationally, that blind spot is significant. You cannot see which markets are growing, which ones are underperforming, or where to focus international expansion efforts.
Configuration changes take 24 to 48 hours to reflect
If you change how Stripe calculates MRR, how it defines an active subscriber, or how it handles discounts in revenue calculations, that change does not appear in your dashboard immediately.
Stripe’s own documentation confirms that configuration updates take 24 to 48 hours to propagate through to reports.
Common workarounds and why they break
Spreadsheets: the 88% error problem

Exporting CSVs and building Excel models is the most common response to Stripe’s reporting gaps. It is also the most error-prone.
Research across 113 audited spreadsheets found that 88% contain errors. A 2024 study found that 94% of business spreadsheets used in actual decision-making contain at least one critical mistake.
Finance teams lose 2 to 3 days every month just reconciling manual report versions pulled from different sections of the Stripe dashboard.
Spreadsheets work at a very early stage with low transaction volume. Past a few thousand dollars in monthly revenue, the manual effort compounds, the error rate climbs, and the time cost becomes a real drag on the business.
Stripe Sigma: powerful but gated behind SQL

Sigma is genuinely capable for teams with engineering resources. For everyone else, it is effectively inaccessible.
Writing a basic MRR query in Sigma requires SQL fluency that most founders and finance professionals simply do not have. Custom metric definitions are not possible.
If your business calculates MRR differently from Stripe’s default logic, Sigma cannot accommodate that. And after all of that, Sigma still only queries Stripe data. It does not solve the cross-platform visibility problem at all.
Google Analytics plus Stripe: the attribution gap

Connecting GA4 to Stripe through conversion events sounds like the right fix for the traffic-to-revenue problem. The reality is messier.
Stripe’s hosted checkout page lives on a different domain than your store. That domain switch breaks the session, so GA4 loses track of where the customer came from before they paid.
Add GDPR and cookie consent banners, and 20 to 60% of your traffic goes completely untracked before it even reaches checkout. Subscription renewals, which happen server-side with no browser session, are invisible to GA entirely.
How Putler fills the Stripe dashboard gaps
Stripe gives you the payment infrastructure. Putler gives you the business intelligence layer on top of it.
It connects to Stripe as a data source alongside 16 other platforms including Shopify, PayPal, WooCommerce, Amazon, and Etsy, then consolidates, deduplicates, and cleans everything into one accurate revenue number. No double counting. No manual reconciliation. No switching between dashboards.
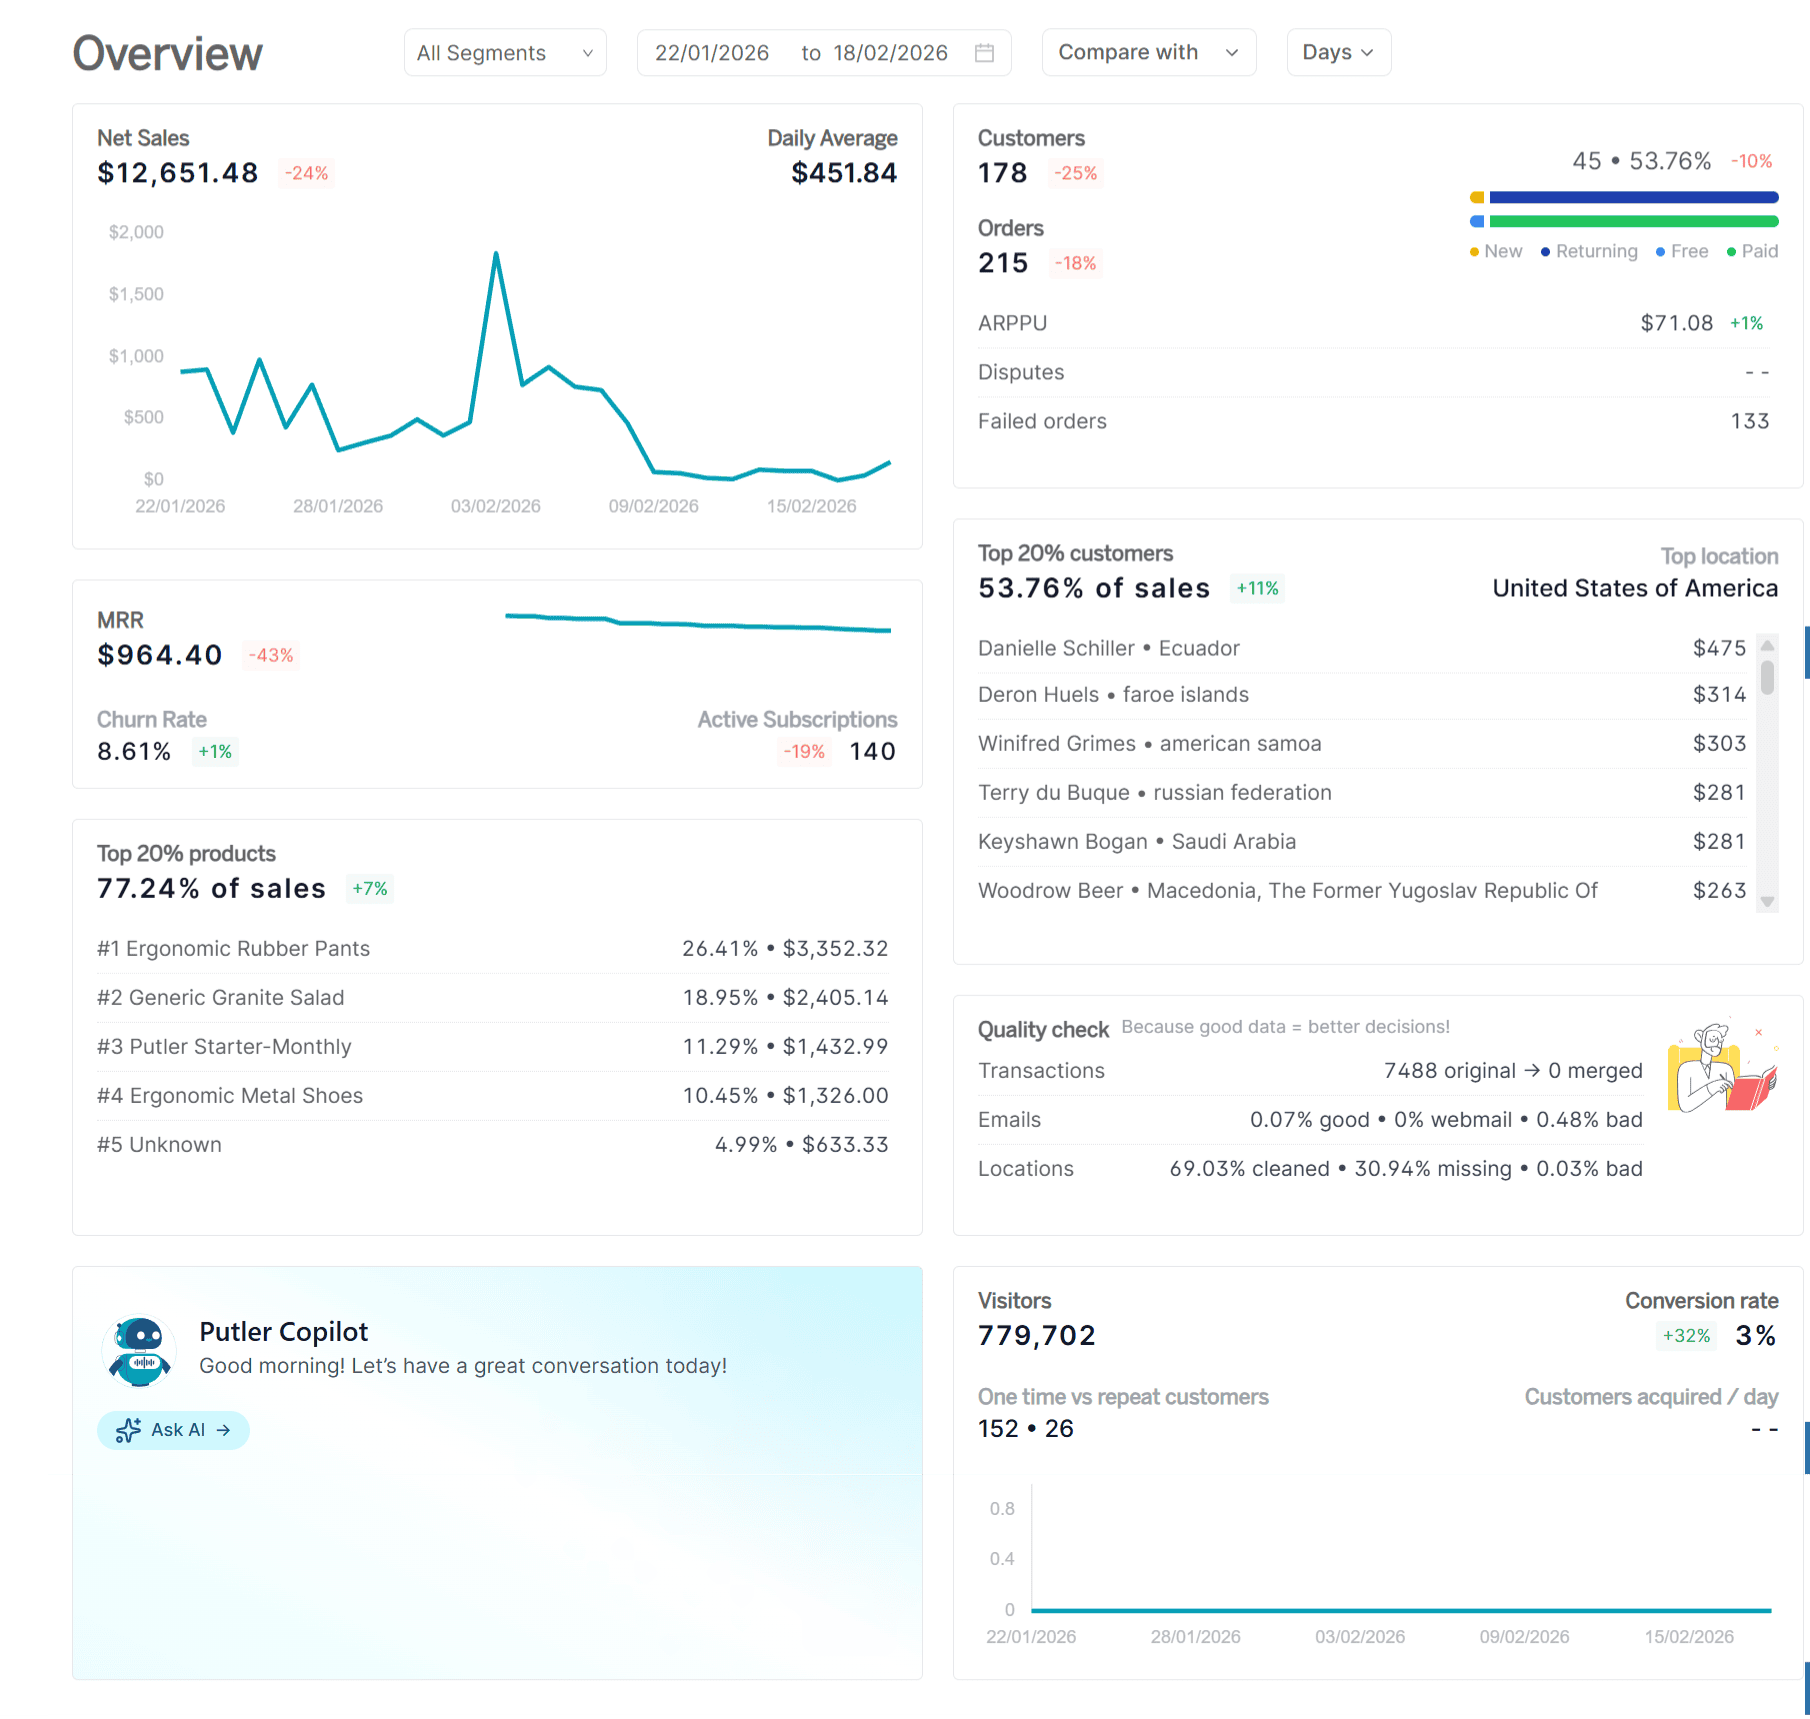
Here is what that unlocks:
eCommerce dashboard: A single unified view of revenue, orders, and customer activity across all your connected sources. The number you see reflects your actual business, not just one payment processor.
SaaS metrics dashboard: Accurate MRR, ARR, churn rate, and ARPU calculated from your real subscription data, not Stripe’s raw payment volume. The metrics your investors and board actually want to see.
Customer profiles: Full purchase history, lifetime value, and behavioral data for every customer across all connected sources, in one place.
RFM segmentation: Putler automatically segments your customers into 11 groups including champions, loyal customers, at-risk, and hibernating. You know exactly who needs a win-back campaign and who deserves a loyalty reward, without building a single query.
Product analysis: Revenue, refund rates, and performance trends broken down by product. You can see which products are actually driving margin and which ones are quietly costing you.
Sales heatmap: Hour by hour and day by day purchase patterns across your entire transaction history. Schedule campaigns, flash sales, and support staffing around when your customers actually buy.
Transaction management: Full transaction visibility with direct refund processing built in. No jumping between platforms to issue a refund or investigate a dispute.
eCommerce web analytics: Traffic, conversions, and revenue in one view. The connection between your marketing activity and actual paying customers that Stripe cannot show you.
Putler starts at $20 per month for stores up to $10,000 in monthly revenue.