
WooCommerce customer analytics shows who buys, who returns, what different customer groups are worth, where repeat buying breaks down, and which channels or markets attract better customers.
WooCommerce core provides a basic Customers report, while the paid Customer Analytics extension by Coddium adds an Overview and 10 reports for segmentation, value, retention, churn, acquisition, and market analysis.
The point of WooCommerce customer analytics is not to collect 10 more charts. It is to choose the report that answers the decision in front of you.
For a broader view of these metrics across commerce systems, see the customer analytics guide.
What can WooCommerce customer analytics show in core?
WooCommerce core provides a Customers report for basic customer lookup and filtering. It shows registered customers and guests, including their email, location, registration date, last active date, order count, total spend, and average order value.
You can filter the report by name, email, country, registration date, last active date, number of orders, total spend, or AOV. This is enough for questions such as:
- Which customers spent more than $500?
- Who has placed at least three orders?
- Which known customer placed a recent order?
- Which customers in a country meet a value threshold?
WooCommerce groups guest orders when they use the same billing email. That lets the report recognize many repeat guest buyers, though a changed or mistyped email can still split one person into separate records.
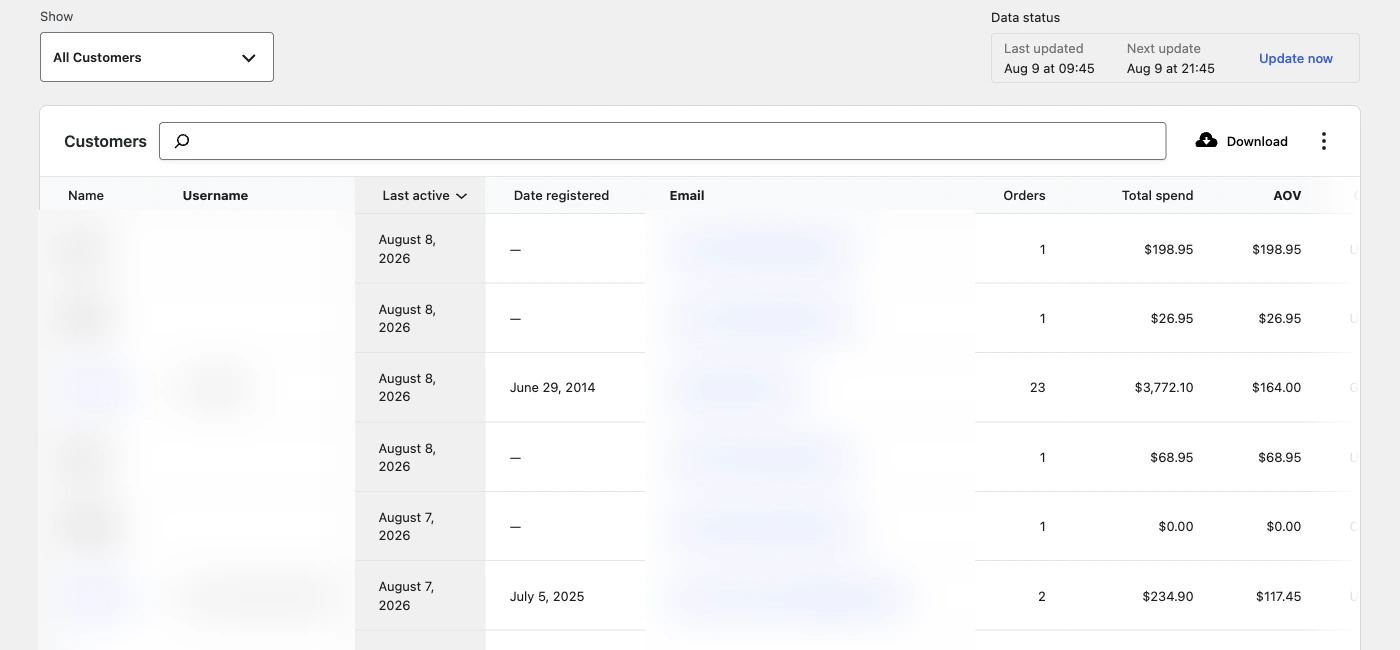
The core report describes the customer list. It does not show whether a monthly acquisition cohort is improving, where customers fall out of the order sequence, or which channel produces buyers who return. That is the job of the separate Customer Analytics extension.
What does the Customer Analytics Overview tell you?
The Customer Analytics Overview is a monitoring screen that points to changes worth investigating. It combines six headline metrics with summaries of segments, top customers, retention, acquisition quality, and markets, then links each finding to the detailed report behind it.
The six headline metrics are:
- Active customers: Buyers whose latest order falls inside the saved churn period.
- New customers: People whose first order occurred in the selected period.
- Average lifetime value: Average net revenue generated by the relevant customer group.
- Repeat purchase rate: Share of customers who ordered at least twice in the period.
- Second-order rate: Share of acquired customers who progressed from order one to order two after a fair measurement window.
- Churn rate: Share of customers active at the start of a period who became inactive by its end.
Each tile shows its change against the previous comparable period. A higher churn rate appears as a decline because more churn is worse.
The Overview goes further than six tiles. It summarizes the RFM segment mix, five best customers, new versus returning revenue, six recent acquisition cohorts, top acquisition channels, and top countries. A “Worth a look” list raises changes that cross defined thresholds, such as a risk segment growing by at least 20% and at least five customers.
Those alerts have a minimum sample rule. The documentation says each needs at least 50 customers behind it, which prevents a change of three customers from being presented as a major trend.
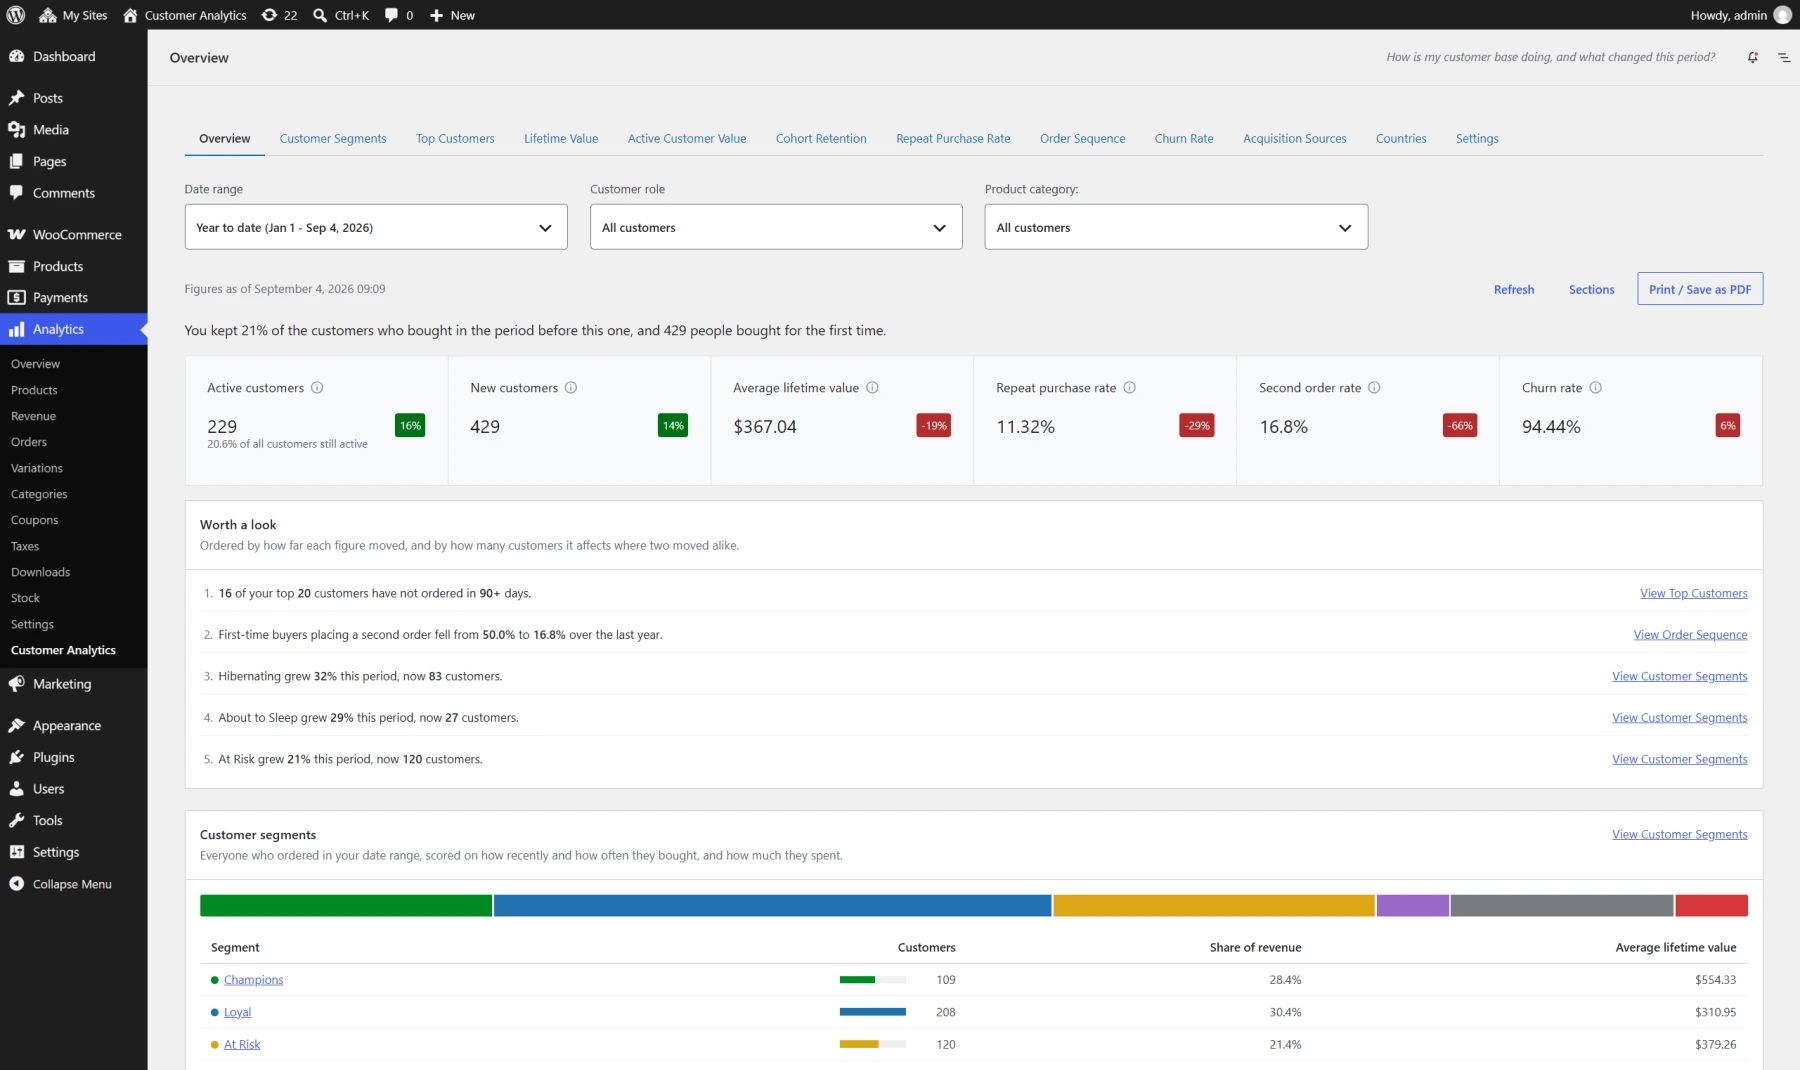
Use the Overview to decide where to look next. A falling repeat rate should lead to Repeat Purchase Rate or Order Sequence, while a growing At Risk segment should lead to Customer Segments and its overdue-customer list.
Which customers should you reward or win back?
Customer Segments and Top Customers turn a broad customer list into named people you can prioritize. The first groups customers by behavior; the second ranks individual customers by lifetime value and buying cadence.
How does RFM segmentation help?
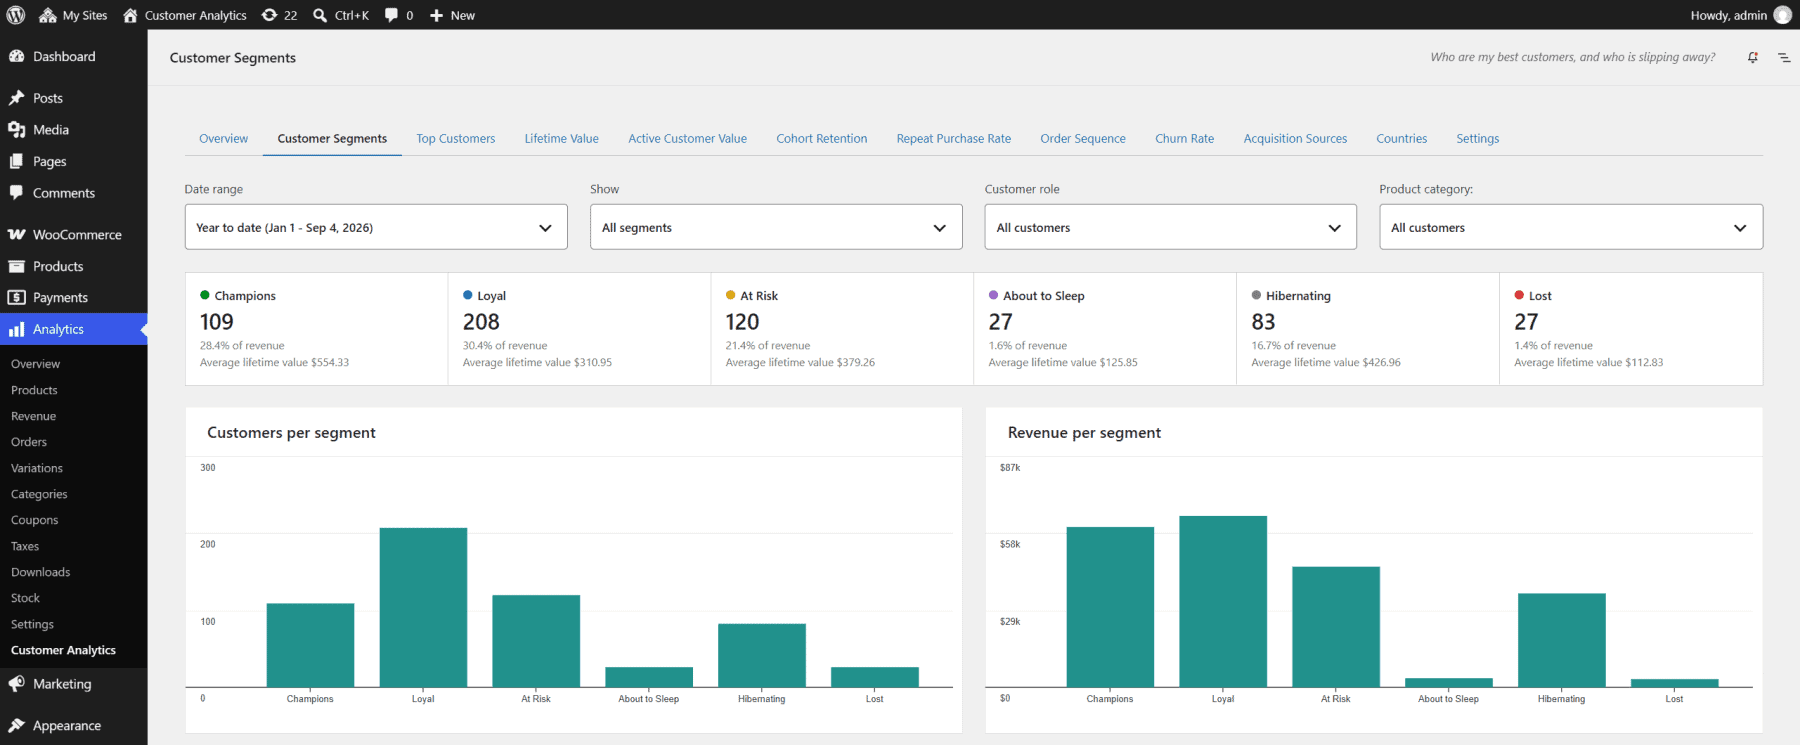
RFM scores customers on recency, frequency, and monetary value. The extension scores each dimension from 1 to 5, then maps the combination into six segments: Champions, Loyal, At Risk, About to Sleep, Hibernating, and Lost.
The segment cards show customer count, share of revenue, and average lifetime value. Its customer table adds orders, last order, lifetime value, average order gap, predicted next order, overdue percentage, and the three RFM scores.
This supports two different jobs:
- Reward strong relationships: Use Champions and Loyal customers for early access, service priority, or loyalty offers.
- Recover weakening relationships: Filter At Risk customers, then sort by Overdue to find people furthest past their normal buying rhythm.
That cadence matters. A customer who normally orders every 30 days and is 45 days late deserves attention sooner than someone who buys twice a year and is only 20 days late.
The extension can create a coupon restricted to an entire segment or to selected customers. It can also prepare selected email addresses for an email client and export the full current view to CSV. For larger lists, use a proper email platform rather than handing hundreds of addresses to a desktop email client.
For a deeper explanation of recency, frequency, and monetary scoring, see the RFM analysis guide.
What does the Top Customers report add?
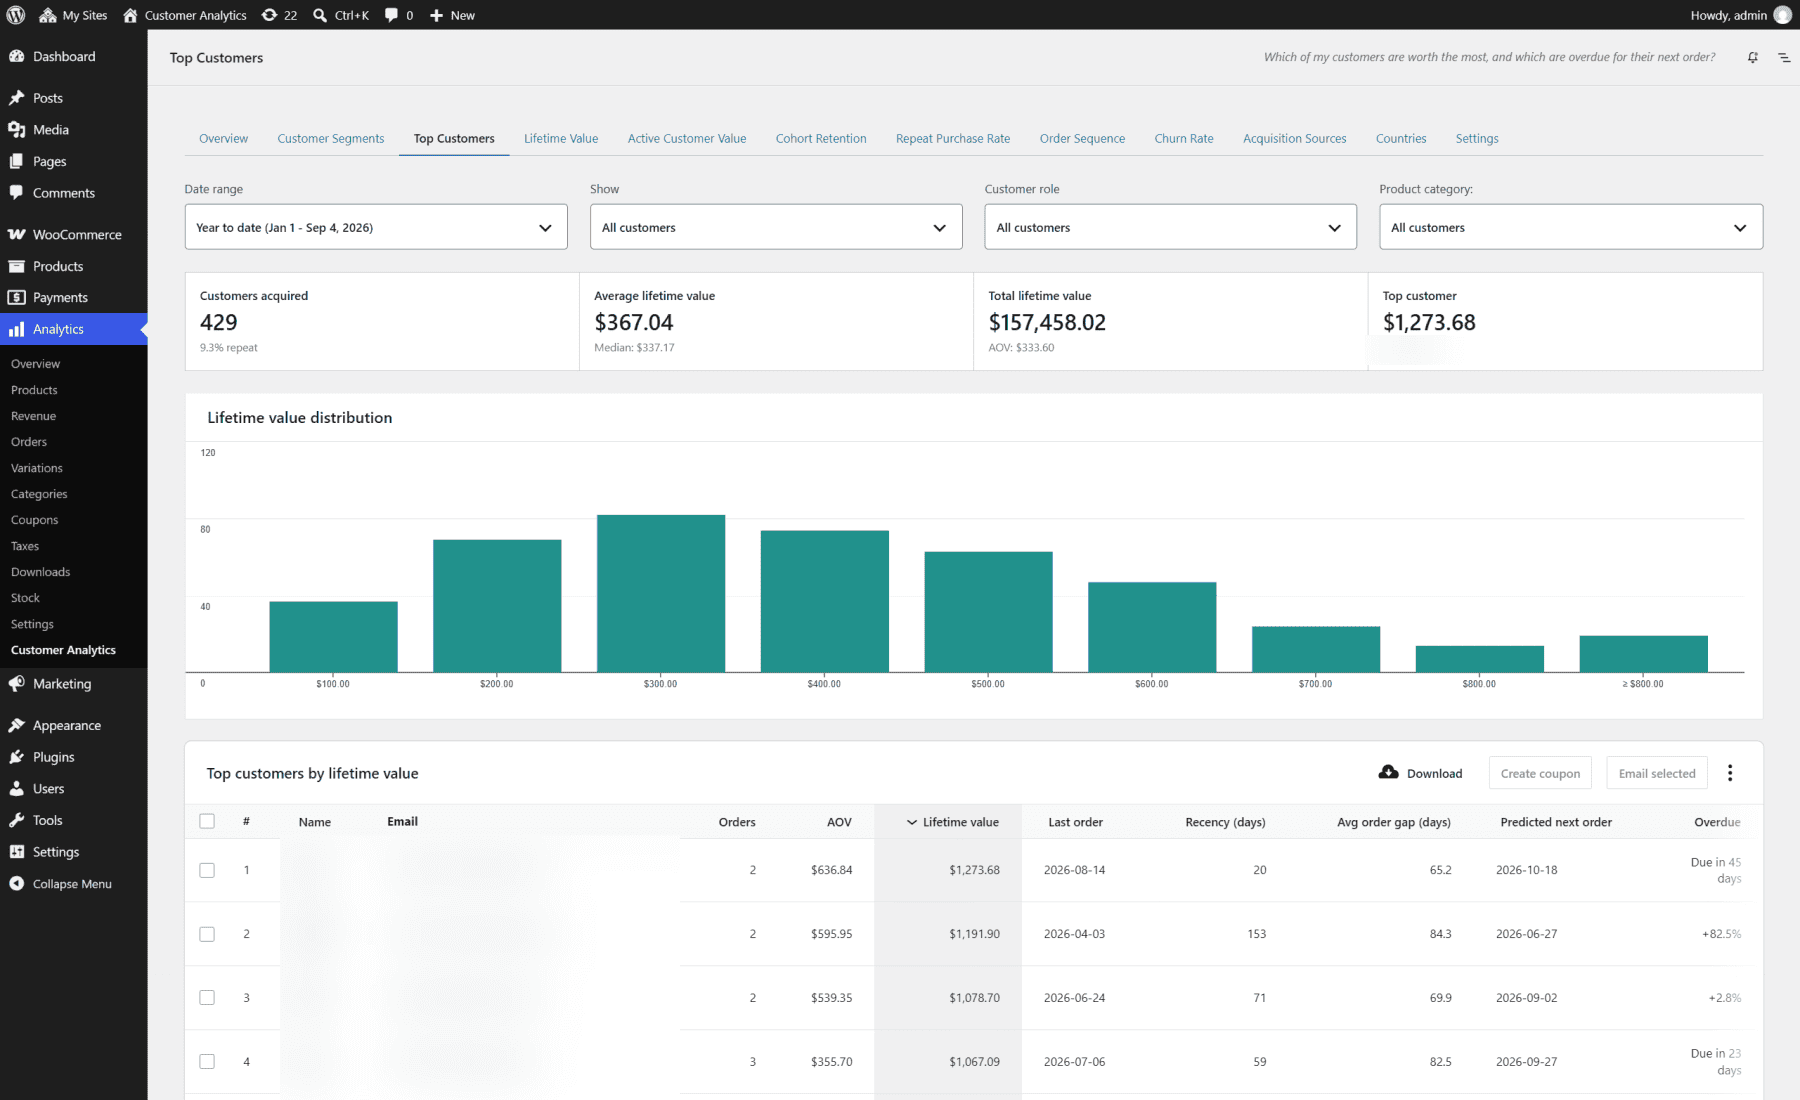
The Top Customers report ranks customers by lifetime value while showing order count, AOV, last order, recency, average order gap, predicted next order, and overdue status. A distribution chart also shows how customer lifetime spend is spread across the customer base.
The “Values as of” filter is the interesting part. Set it to a past date, and the report shows who the top customers were then, with their value and cadence calculated up to that point. This avoids judging an old loyalty campaign with customer value accumulated months later.
Refunds are subtracted from lifetime value, and a fully refunded order contributes zero. That makes the leaderboard more useful for VIP service than a simple gross-spend sort.
How valuable are your customers?
The extension has two customer-value reports because “value” can describe an acquisition cohort or the currently engaged base. Lifetime Value looks forward from acquisition; Active Customer Value takes repeated snapshots of active customers.
What does Lifetime Value measure?
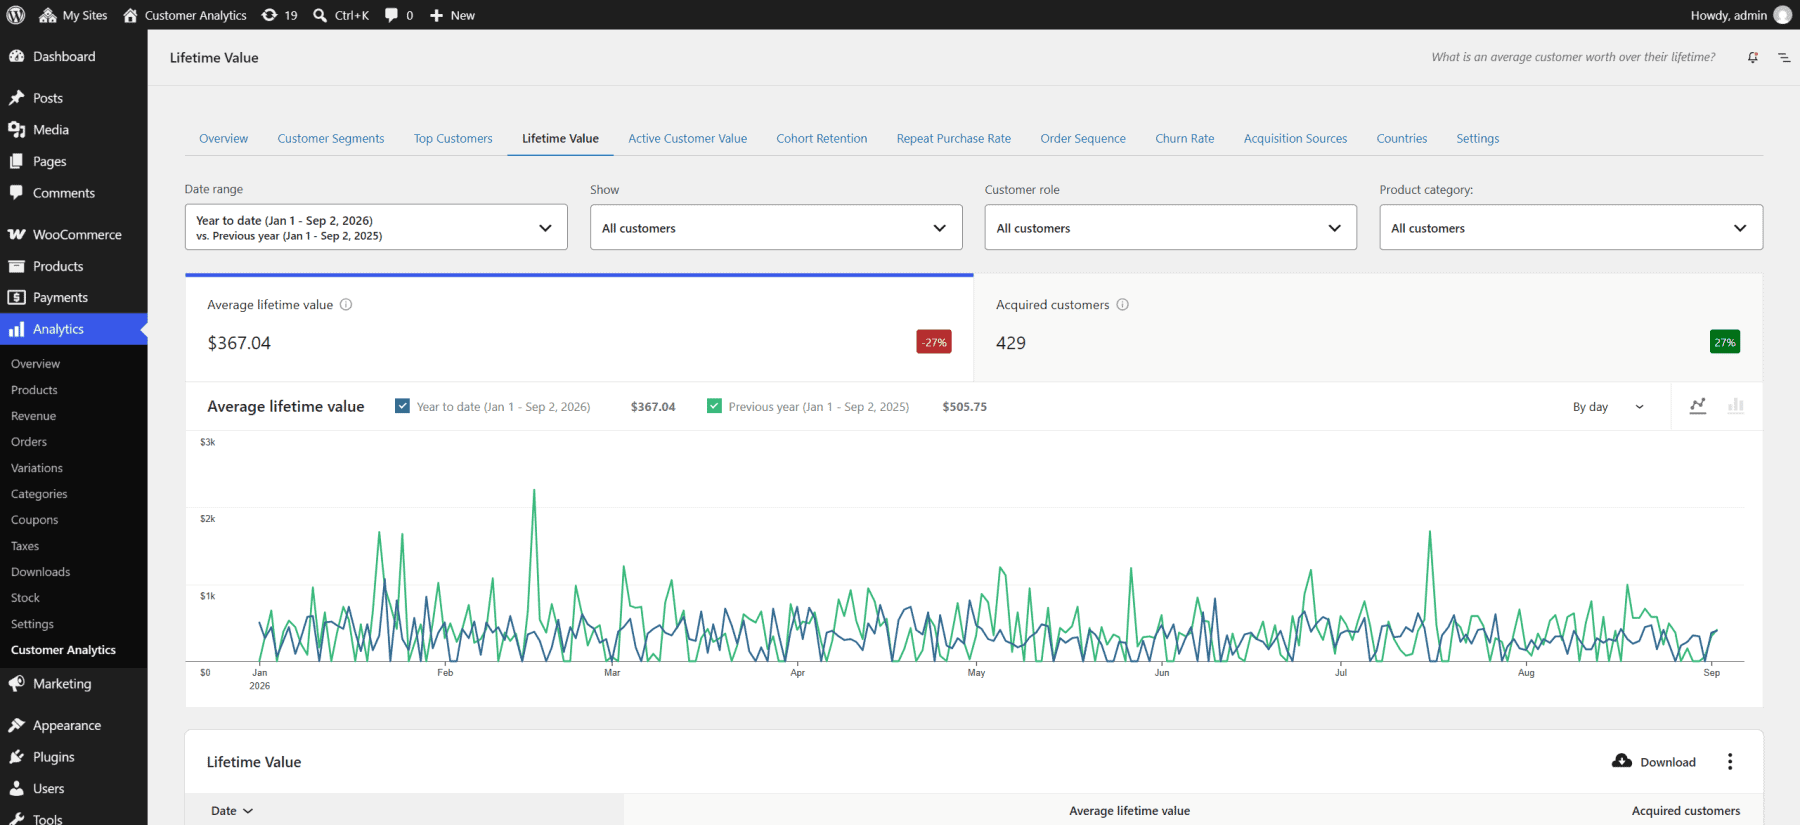
The Lifetime Value report groups customers by the date of their first order. It shows acquired customers, average lifetime value, average customer tenure, expected customer lifespan, and expected lifetime value.
Later orders stay attached to the first-order period. If a customer first ordered on January 5 and returned on January 20, both orders contribute to the January 5 acquisition row. The report therefore answers, “What did customers acquired in this period become worth?”
You can use it to compare:
- Customers acquired in one month against another.
- One-time, repeat, and loyal customer groups.
- Guests against registered customer roles.
- Customers associated with different product categories.
- Customer groups in different currencies.
Expected lifespan is calculated as 1 ÷ the monthly churn rate, using the saved churn setting. Expected lifetime value multiplies average monthly customer value by that lifespan. Treat those as model-based estimates, not settled future revenue.
What does Active Customer Value measure?
A store can have strong historical lifetime value while its active base is shrinking.
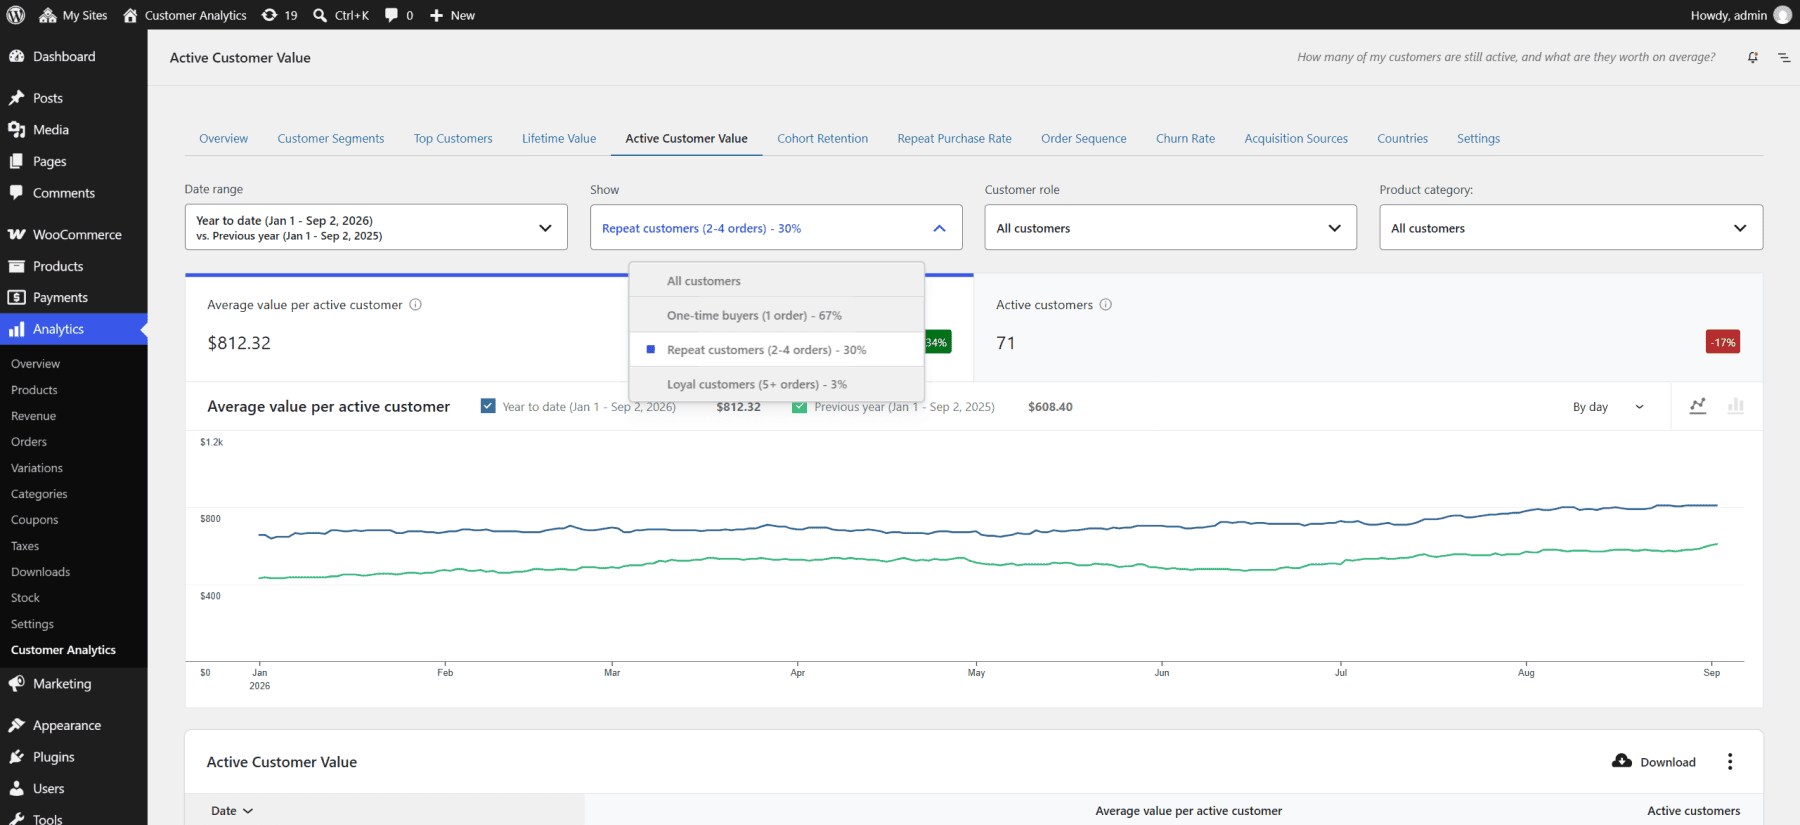
Active Customer Value counts customers who ordered within the saved churn period before each point in time. It reports the size of that active base, average lifetime spend per active customer, and average tenure.
This answers a different question: “How many engaged customers do we have now, and what are they worth?”
A store can have strong historical lifetime value while its active base is shrinking. Another can be adding active customers quickly while their average value falls. The two reports keep those situations from being hidden inside one all-time average.
| Report | Customer population | Best decision |
|---|---|---|
| Lifetime Value | Customers first acquired in the selected period | Compare acquisition-cohort quality |
| Active Customer Value | Customers active within the churn window at each point | Track current customer-base health |
Are customers coming back?
The extension uses four reports to explain repeat buying: Cohort Retention, Repeat Purchase Rate, Order Sequence, and Churn Rate. They overlap on purpose, but each answers a different retention question.
What does Cohort Retention reveal?
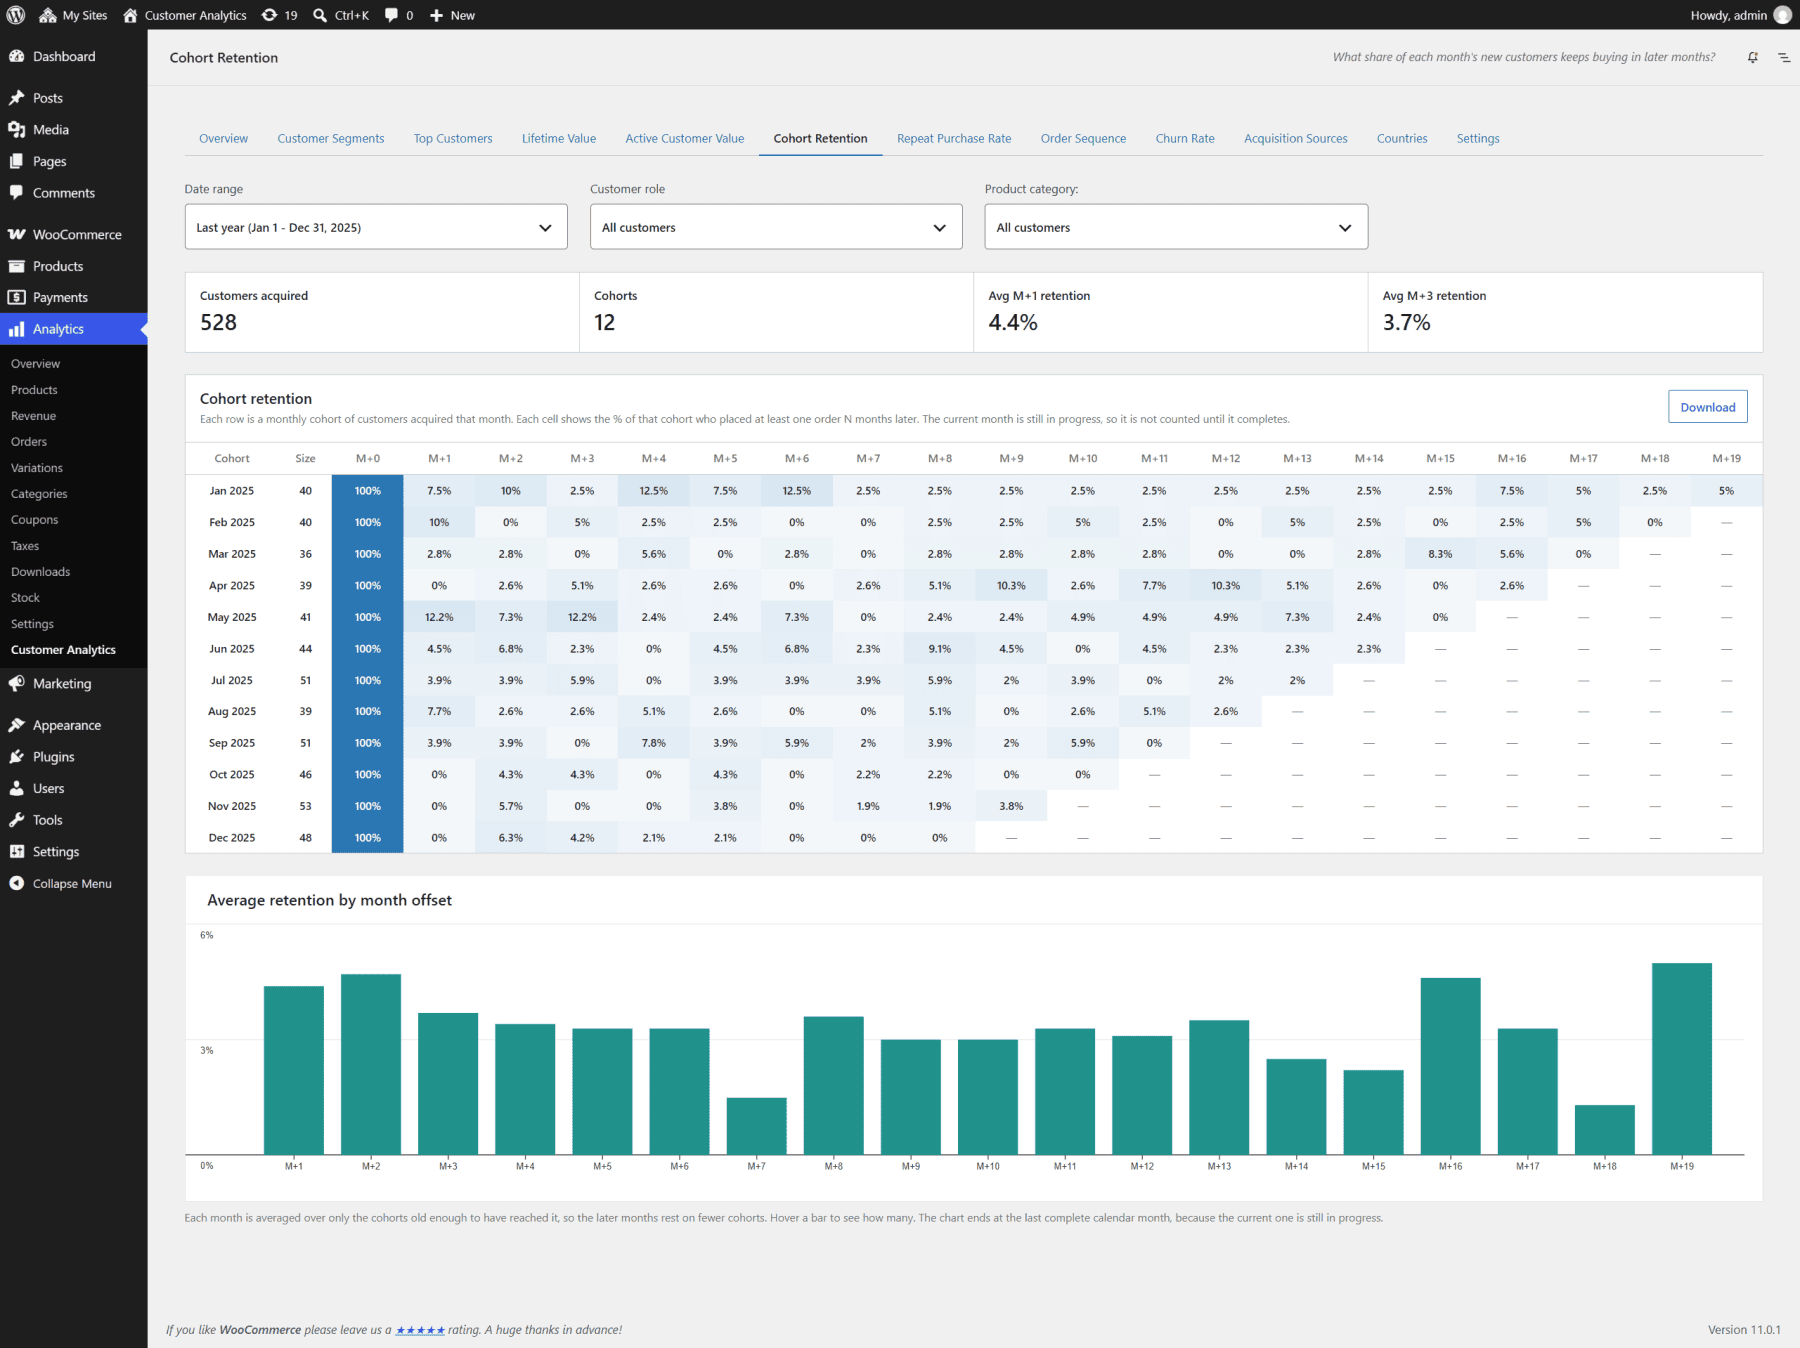
Cohort Retention groups customers by the calendar month of their first order. Each row follows one acquisition cohort across M+1, M+2, M+3, and later months, showing the share that placed at least one qualifying order in each month.
Use this report to compare retention after a change. If a new onboarding email launched in April, compare the April and May cohorts with earlier cohorts once each has reached the same month offset.
The current partial month remains blank until it finishes. This prevents a few days of activity from being compared with full months. Fully refunded orders are excluded because they are not treated as successful repeat purchases.
What does Repeat Purchase Rate reveal?
Repeat Purchase Rate is the percentage of customers with at least two orders inside the selected period. The report also shows the number of repeat customers and the total customer count.
It is useful for a clear trend question: did more customers place multiple orders this month, quarter, or year than in the comparable period?
This is not the same as lifetime repeat status. A long-time customer with one order in March counts as one customer with one March order, even if they bought many times in earlier years. Pick the interval that matches the buying cycle; daily reporting is usually too noisy for products purchased monthly or quarterly.
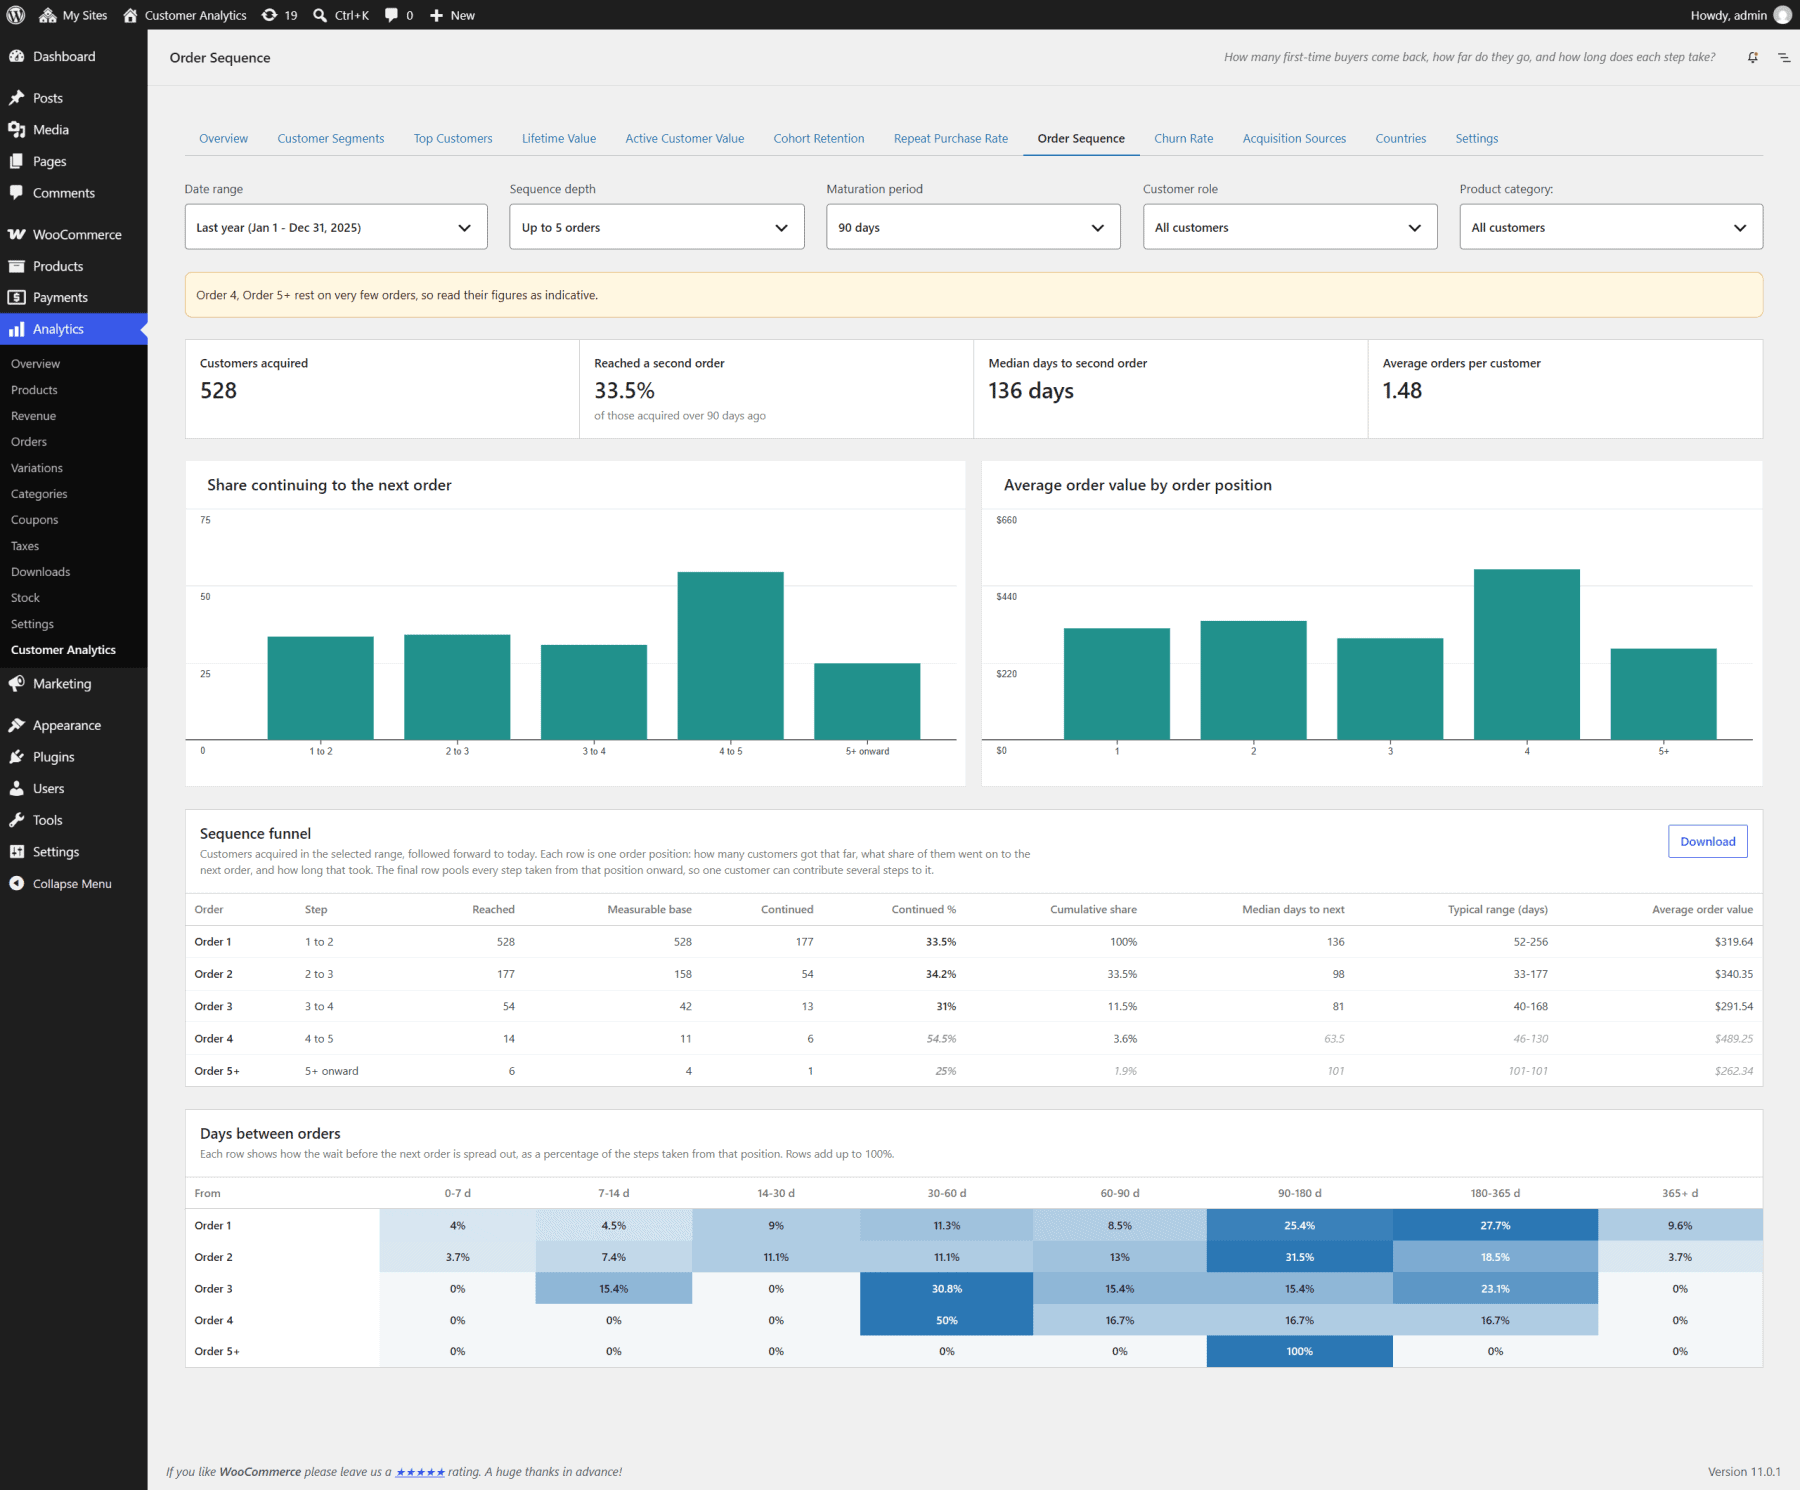
Why is Order Sequence more actionable?
Order Sequence shows how customers progress from their first order to their second, third, fourth, and later orders. For each position, it can show the measurable base, customers who continued, continuation rate, cumulative share still in the sequence, median and typical range of days to the next order, and average value at that order position.
This report tells two stores apart:
- Store A loses most customers before order two.
- Store B wins order two easily but loses customers before order four.
Store A may need a stronger post-purchase welcome, product education, or a timely second-order offer. Store B has already proved it can create a repeat buyer; its problem may be replenishment timing, loyalty recognition, or a catalog that stops giving regular buyers a reason to return.
The days-between-orders grid helps with timing. A median of 49 days can hide two groups, one returning quickly and another much later. The range shows whether one campaign window will fit both.
The extension also uses a maturation period. Customers who have not had a fair chance to place the next order are held out of that step instead of being counted as failures. Without this, a recent acquisition spike would make second-order conversion look worse by construction.
What does Churn Rate reveal?
Churn Rate measures the share of customers who were active at the start of a period and became inactive by its end. The report shows the rate, the number of churned customers, and the customers active at period start.
Choose an inactivity window from 15 days to two years; 90 days is the default. Do not accept that default blindly. A coffee subscription, a furniture store, and a wholesale parts supplier have very different return cycles.
Because churn is based on qualifying orders, it works for one-time and subscription stores. In a subscription business, stopped renewal orders appear as customer inactivity without requiring a separate definition of subscription status.
Which channels and markets bring better customers?
Acquisition Sources and Countries move the analysis beyond “Where did sales come from?” They compare groups by the value and repeat behavior of the customers those groups produced.
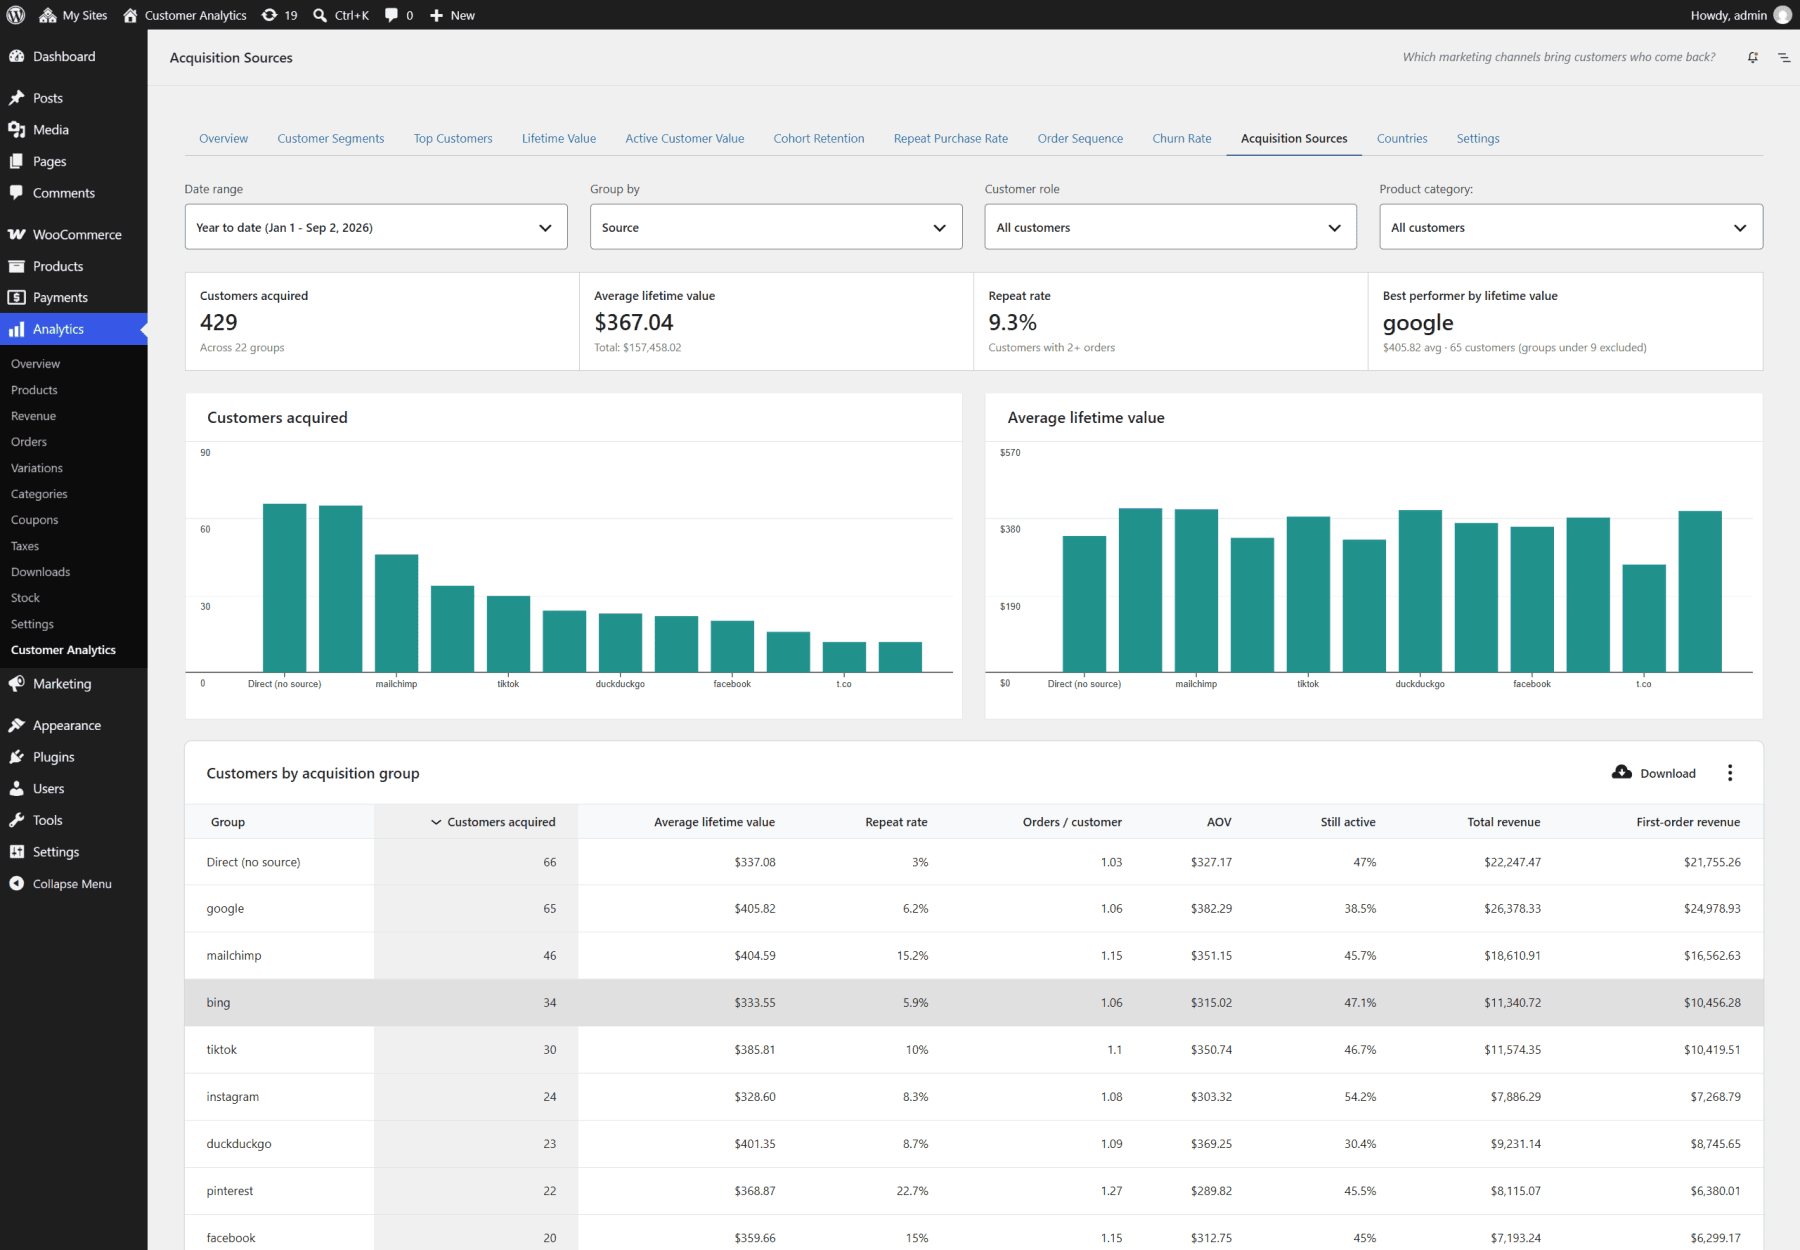
What does Acquisition Sources reveal?
Acquisition Sources assigns each customer to the channel of their first order. You can group customers by channel, source, medium, or campaign, then compare customers acquired, average lifetime value, repeat rate, orders per customer, AOV, still-active share, total revenue, and first-order revenue.
This changes the budget question. The channel with the most first orders may not produce the highest-value repeat customers. A smaller source can deserve more budget if its customers order more often and remain active longer.
The extension applies a 2% customer-share floor when naming the best group by average lifetime value. That stops one large spender in a two-customer source from being presented as a reliable winner. Small stores can still inspect the row, but the summary does not overstate it.
There is a historical limit. WooCommerce records attribution only while its Order Attribution feature is active. Customers whose first order predates that data appear as Unknown, and the report shows attribution coverage when it is low.
What does the Countries report reveal?
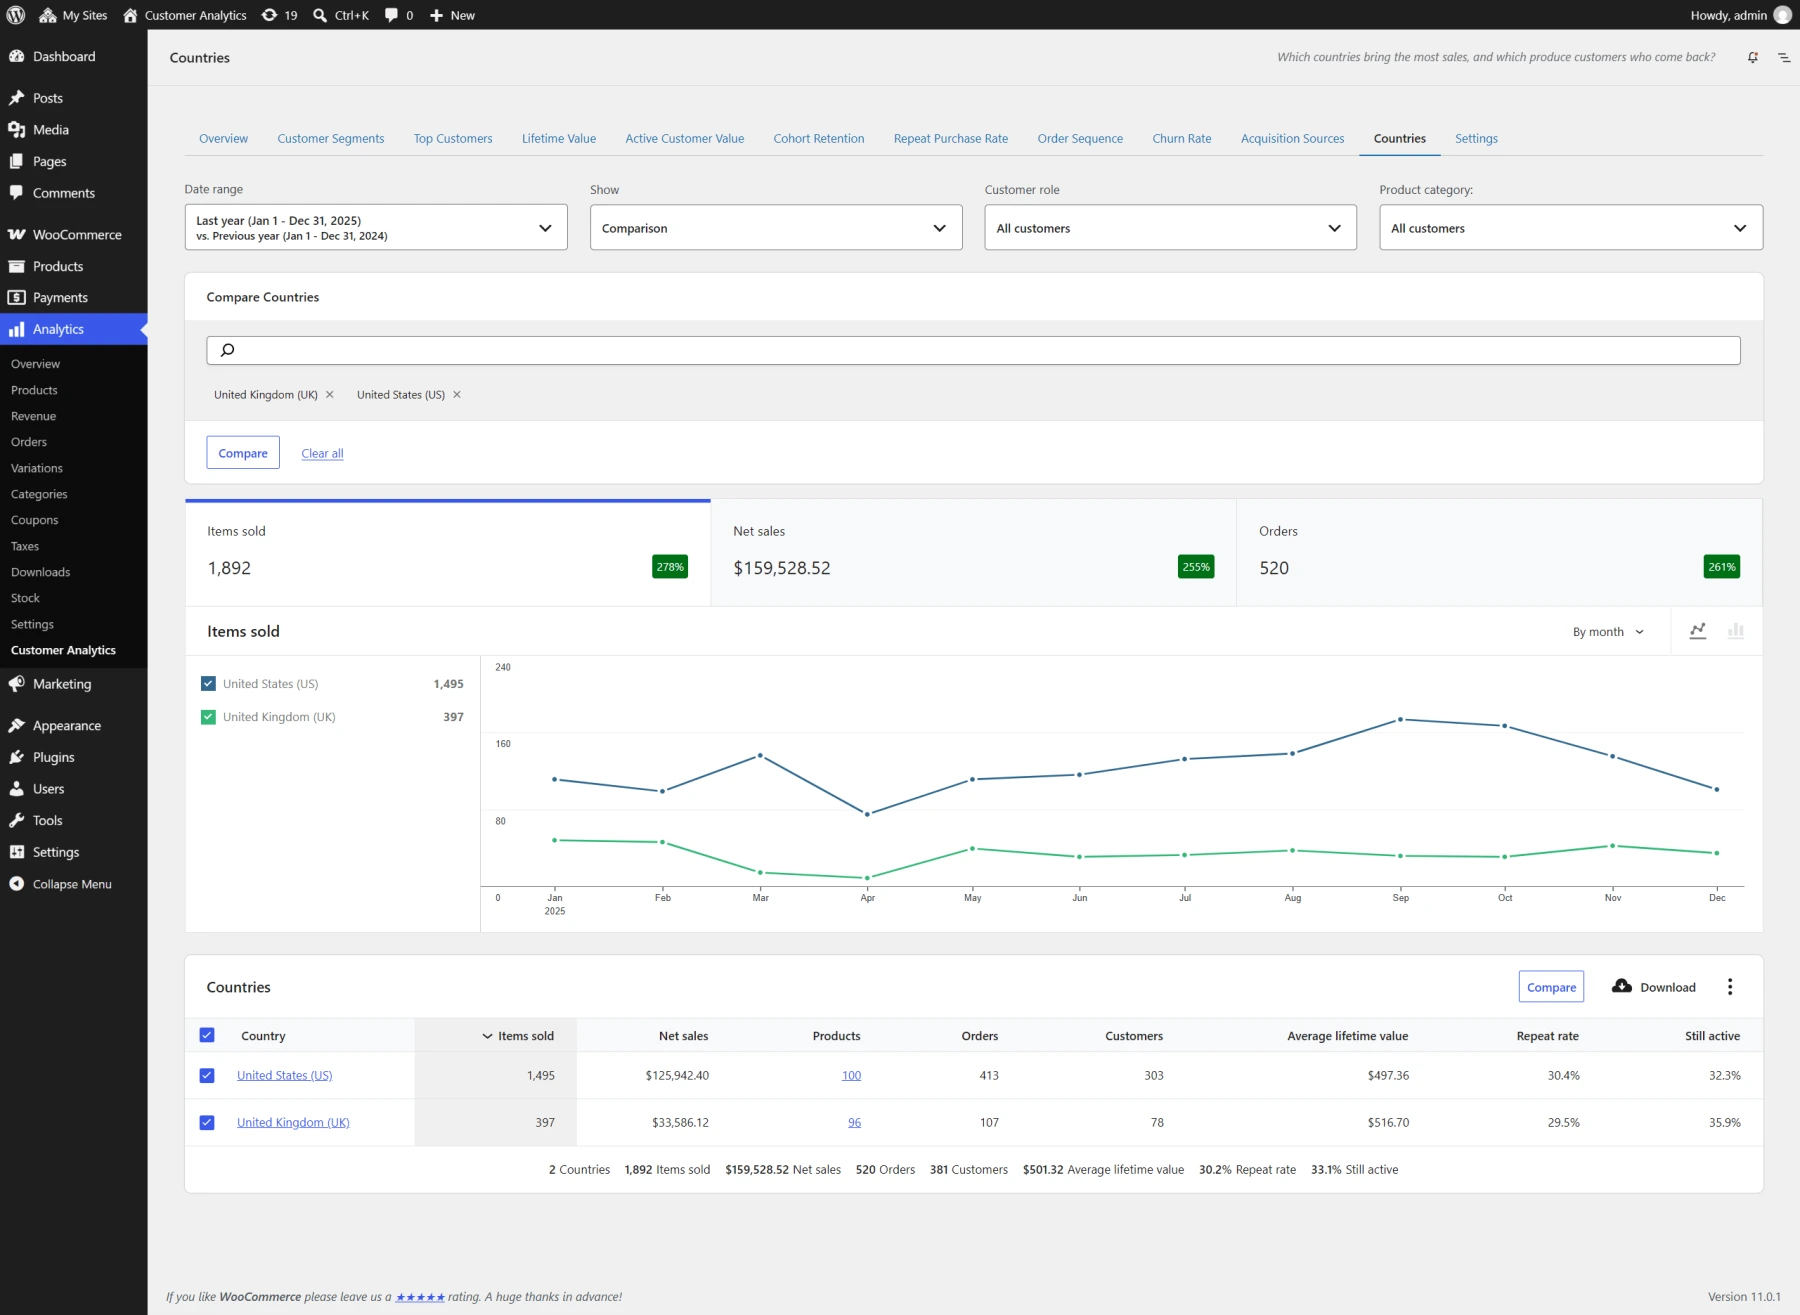
The Countries report combines items sold, net sales, products, and orders with customer count, average lifetime value, repeat rate, and still-active share. You can view all countries, inspect one market product by product, or compare selected countries side by side.
This helps separate volume from customer quality. A country can lead on revenue but have weak repeat behavior, while a smaller market creates customers with higher lifetime value and active share.
In the single-country view, customer quality can also be shown by product. A product row with high customer lifetime value means the people who bought that product became valuable across the store, not that they spent that lifetime amount on the product itself.
Country is determined by billing address. Customers who ordered from more than one country in the selected period are counted once under the billing country of their most recent order, while their orders still contribute to the countries where those orders occurred.
How can you turn every metric into a narrower customer question?
Every Customer Analytics report can be narrowed by date, customer role, product category, and currency. The filters matter because a store-wide average often hides the group that needs a different action.
Product-category filtering is more useful than a simple “bought category X” rule. You can match customers who:
- Ever purchased from selected categories.
- Only ever purchased from those categories.
- First purchased from those categories.
- Match any or all selected categories.
This supports sharper questions.
Compare second-order progression for customers whose first purchase was a consumable product. Check whether wholesale customers have a different churn window from guests. See whether buyers who only purchase one category have weaker lifetime value than cross-category buyers.
Currency filters can show one currency on its own or combine currencies after exchange rates are configured. Customer role filters let you isolate Guests or any WordPress role. The same filters persist across reports, which makes it easier to examine one population from several angles.
Most reports export CSV data. The Overview can be printed or saved as a PDF, while Customer Segments and Top Customers can create restricted coupons or prepare selected customer email addresses. Analysis becomes useful when it ends with a specific audience and action.
When is WooCommerce customer analytics reliable enough to use?
The extension’s documentation recommends at least 100 customers and 3-6 months of order history for meaningful analysis. It says 300 or more customers and at least 12 months of history produce more reliable patterns, especially when buying is seasonal or infrequent.
Run these six checks before acting:
- Confirm historical data is present. Migrated or imported orders may need WooCommerce Analytics historical-data import.
- Check the customer identity rule. Guest orders are grouped by billing email, so changed addresses can split one person.
- Confirm the order basis. Reports use order creation date and WooCommerce Analytics order-status settings.
- Review refund treatment. Money metrics subtract refunds, while fully refunded orders are excluded from behavioral reports.
- Match the window to the product. A 90-day churn rule is not suitable for every buying cycle.
- Check sample maturity. Recent cohorts and order steps may not have had enough time to produce a fair result.
Stores with fewer than 50 qualifying customers use fixed RFM thresholds instead of quintiles. That prevents a tiny customer list from being divided into five groups that look analytical but move dramatically when one person buys.
Multi-currency stores need an exchange rate for every currency before the combined view is available. The extension applies one configured rate across the full order history, so converted figures are an approximation rather than a historically exact currency conversion.
For the gaps in WooCommerce core reporting beyond customer metrics, see WooCommerce reporting limitations.
When do you need more than WooCommerce?
WooCommerce core is enough for basic customer search, order count, total spend, and AOV. Customer Analytics goes much further for a single WooCommerce store, covering segmentation, value, retention, order sequence, churn, acquisition quality, and market quality.
The gap appears when the customer record spans systems. A WooCommerce order paid through PayPal or Stripe can appear in the store and the gateway.
Several stores can hold separate records for the same buyer. Currencies and time zones can make direct totals hard to compare.
Nicolai Grut of FishBottle and GrutBrushes described this operational problem on Putler’s WooCommerce page. He says he used to export WooCommerce data and analyze it with spreadsheet pivot tables; with Putler, his sales information became searchable, and he could consolidate data from WooCommerce, PayPal, and Stripe.
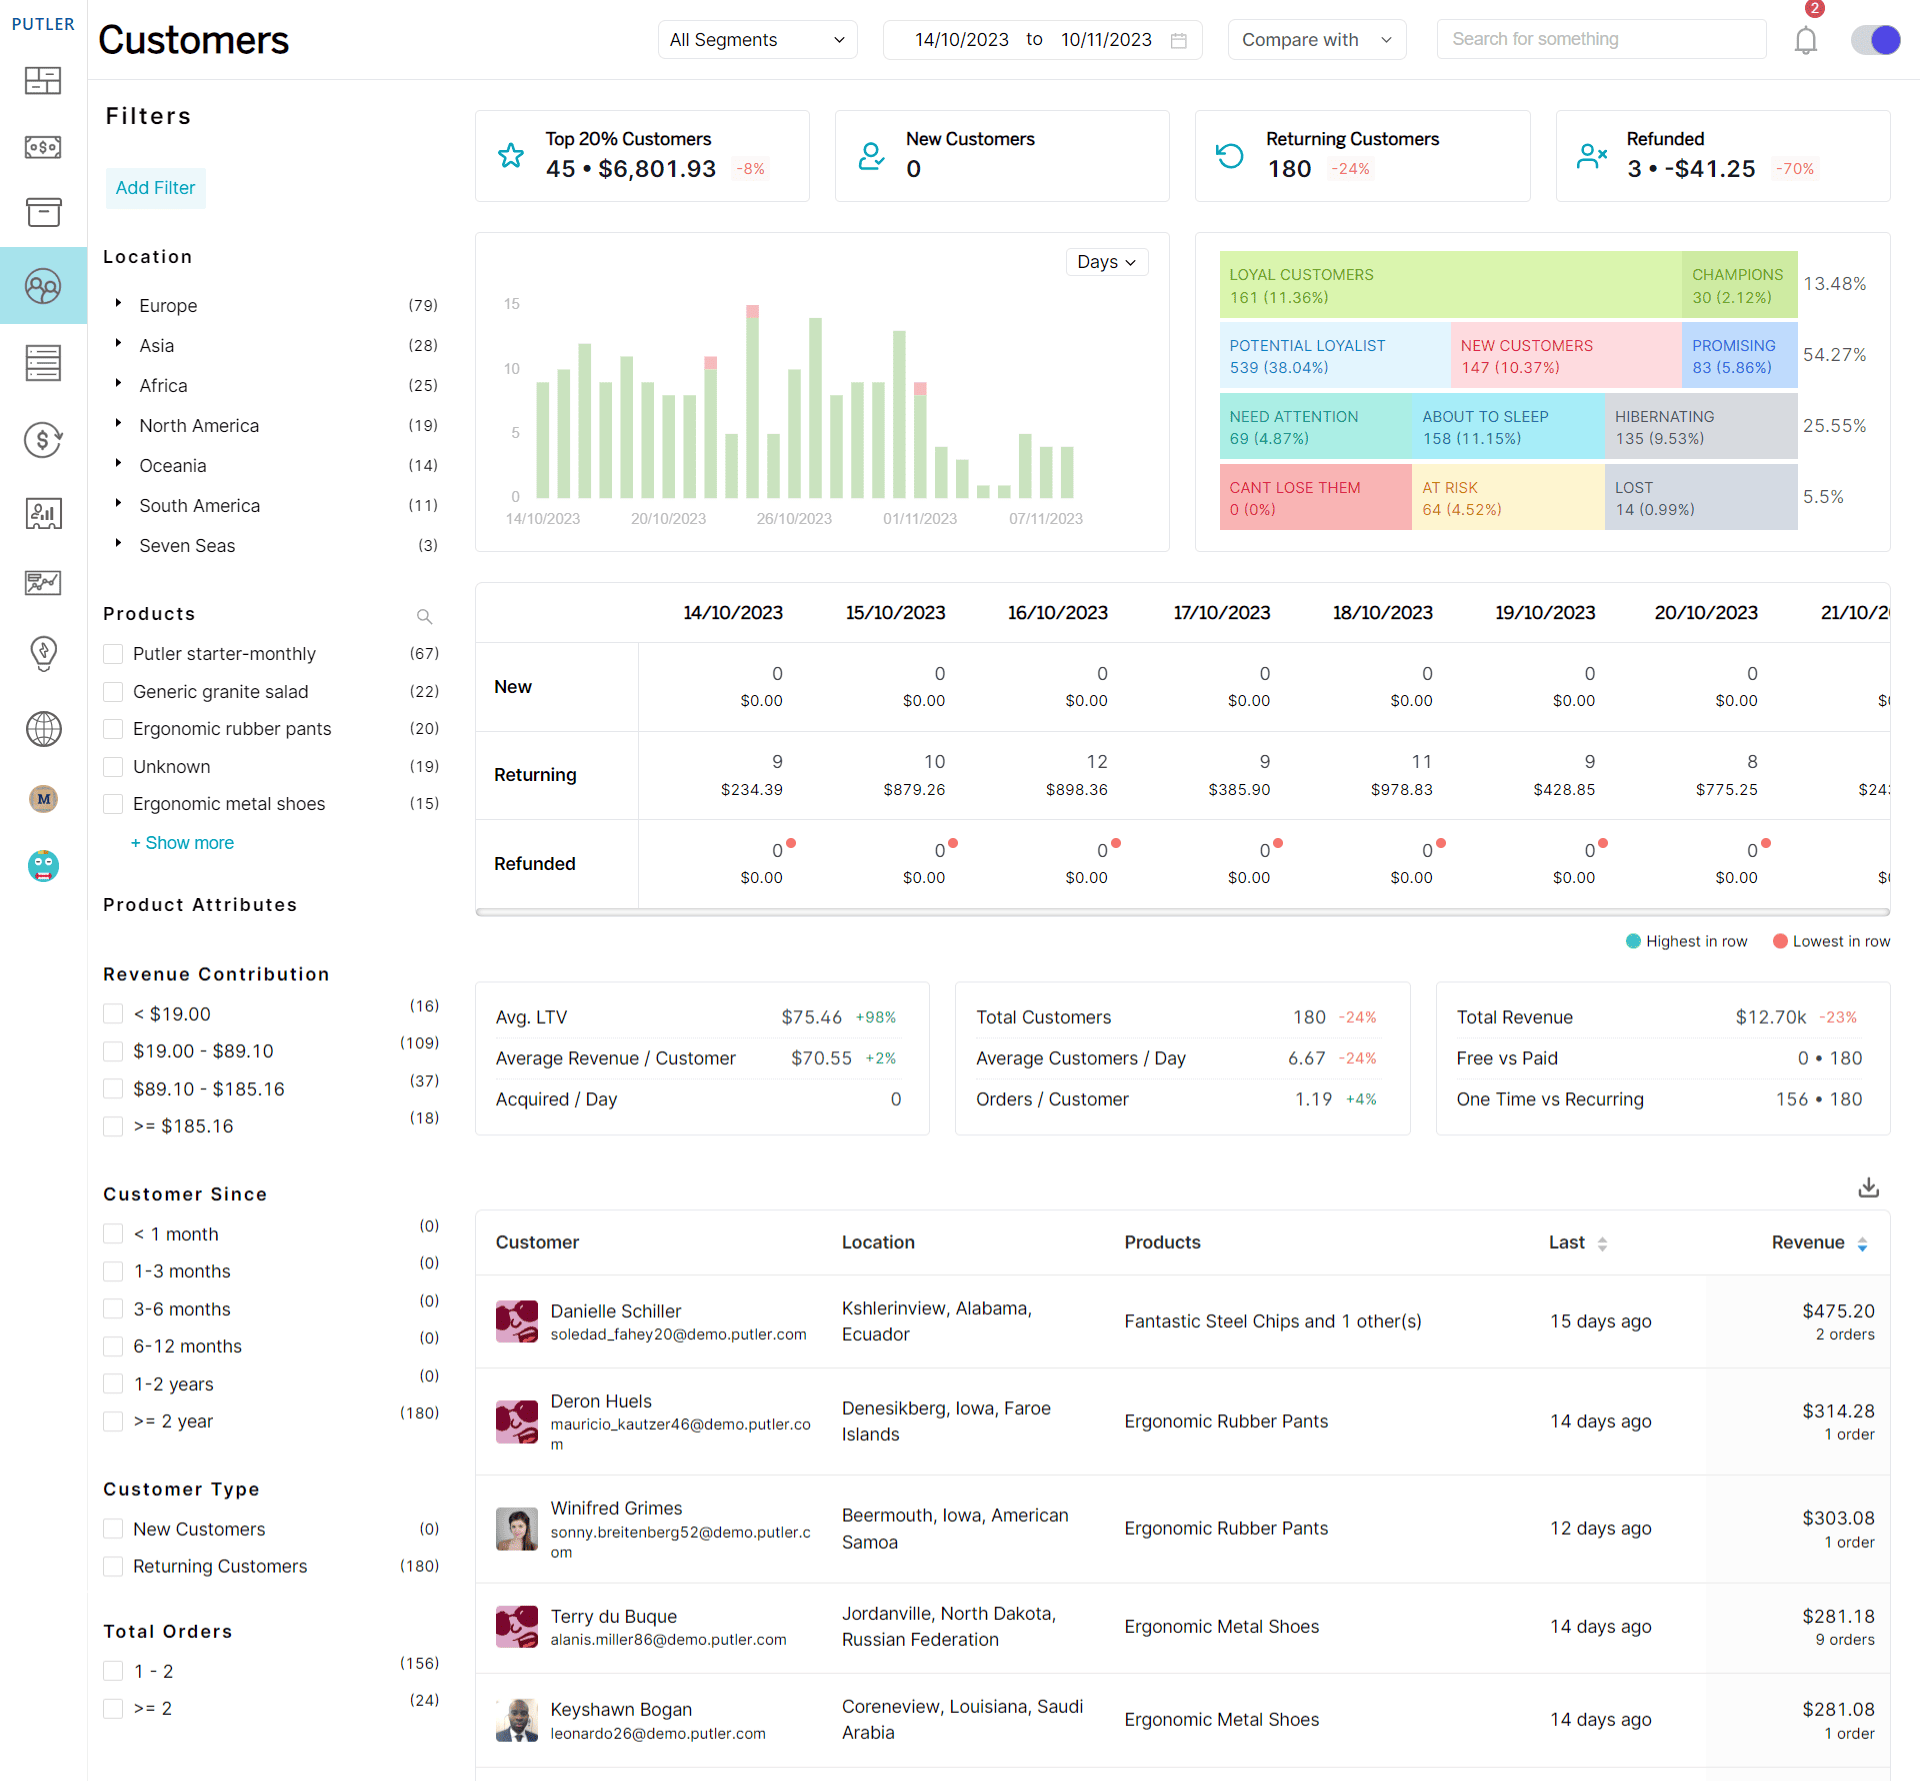
Putler’s documented role is consolidation. It can merge duplicate transactions, match cart and gateway data, align time zones, convert currencies, combine stores, and provide customer profiles and RFM analysis from the cleaned dataset. WooCommerce Customer Analytics remains the stronger first stop when the question stays inside one store.
Where should a store start?
Start with the metric that changed, then move to the report that explains it. This keeps the analysis tied to one decision and prevents a dashboard tour from replacing actual work.
The six steps are:
- Open Overview and identify the meaningful change.
- Open the detailed report behind that tile or alert.
- Narrow the population by role, product category, or currency.
- Check sample size, identity, refunds, history, and the measurement window.
- Choose one action and a comparison period or holdout group.
- Record the date when the result will be checked again.
If second-order rate fell, start with Order Sequence. If the At Risk segment grew, inspect overdue customers in RFM. If customer volume rose but value fell, compare acquisition sources and Lifetime Value before buying more traffic.
FAQ
What customer metrics does WooCommerce track?
WooCommerce core tracks order count, total spend, AOV, activity, registration, and location. The Customer Analytics extension adds active and new customers, RFM segments, lifetime and active customer value, cohort retention, repeat and second-order rates, order sequence, churn, acquisition quality, and country-level customer value.
What is the difference between Lifetime Value and Active Customer Value?
Lifetime Value groups customers by when they were first acquired and follows what those cohorts became worth. Active Customer Value measures customers who were still active within the chosen churn window at each point in time. Use the first for acquisition quality and the second for current customer-base health.
How does WooCommerce calculate repeat customers and churn?
The Customer Analytics extension’s Repeat Purchase Rate counts customers with at least two qualifying orders in the selected period. Its Churn Rate measures customers active at the start of a period who became inactive by its end, based on a configurable inactivity window. Fully refunded orders do not count as successful behavioral orders.
How can WooCommerce identify customers likely to buy again?
The extension’s Customer Segments and Top Customers reports calculate each repeat buyer’s average order gap, predicted next order, and overdue percentage. Sort At Risk customers by Overdue to find buyers furthest past their normal cadence. The prediction needs at least two qualifying orders and an average gap of at least one day.
When is Putler useful beyond WooCommerce Customer Analytics?
Putler is useful when customer value spans WooCommerce plus payment gateways, multiple currencies, or several stores. It consolidates and cleans those sources before customer analysis. For one WooCommerce store with complete order history, Customer Analytics may already answer the retention, value, acquisition, and market questions you need.