

Polar Analytics is worth evaluating if your ecommerce team needs to connect sales, advertising, and customer reporting across several sources. Its documented dashboard and custom-reporting tools give you ways to investigate performance, but the buying decision depends on your data, the reports you need, and the subscription quote.
The practical question is whether Polar can help you make a decision that your current reporting leaves unanswered. That might mean comparing markets, connecting acquisition costs with customer value, or calculating contribution margin with the right expenses included.
What is Polar Analytics?
Polar Analytics is an ecommerce analytics platform that brings connected business data into shared dashboards and reports. Its developer listing describes acquisition metrics such as advertising spend, customer acquisition cost (CAC), and return on ad spend (ROAS), alongside retention, product performance, and inventory reporting.
The platform also offers data activation. Klaviyo Audiences aims to recover missed abandonment events, while Advertising Signals sends conversion events to advertising platforms. Those capabilities are distinct from displaying reports, and their availability should be confirmed for the configuration you buy.
For a reporting team, the useful starting point is a named question: which market is growing profitably, which customer group returns, or which campaign’s sales justify its costs?
What does the Polar Analytics dashboard show?
The dashboard combines high-level performance monitoring with detailed report blocks. You can use cards for important numbers and charts or tables to inspect trends and breakdowns. How useful that layout becomes depends on the metrics, filters, and periods chosen for it.
KPI cards and date comparisons
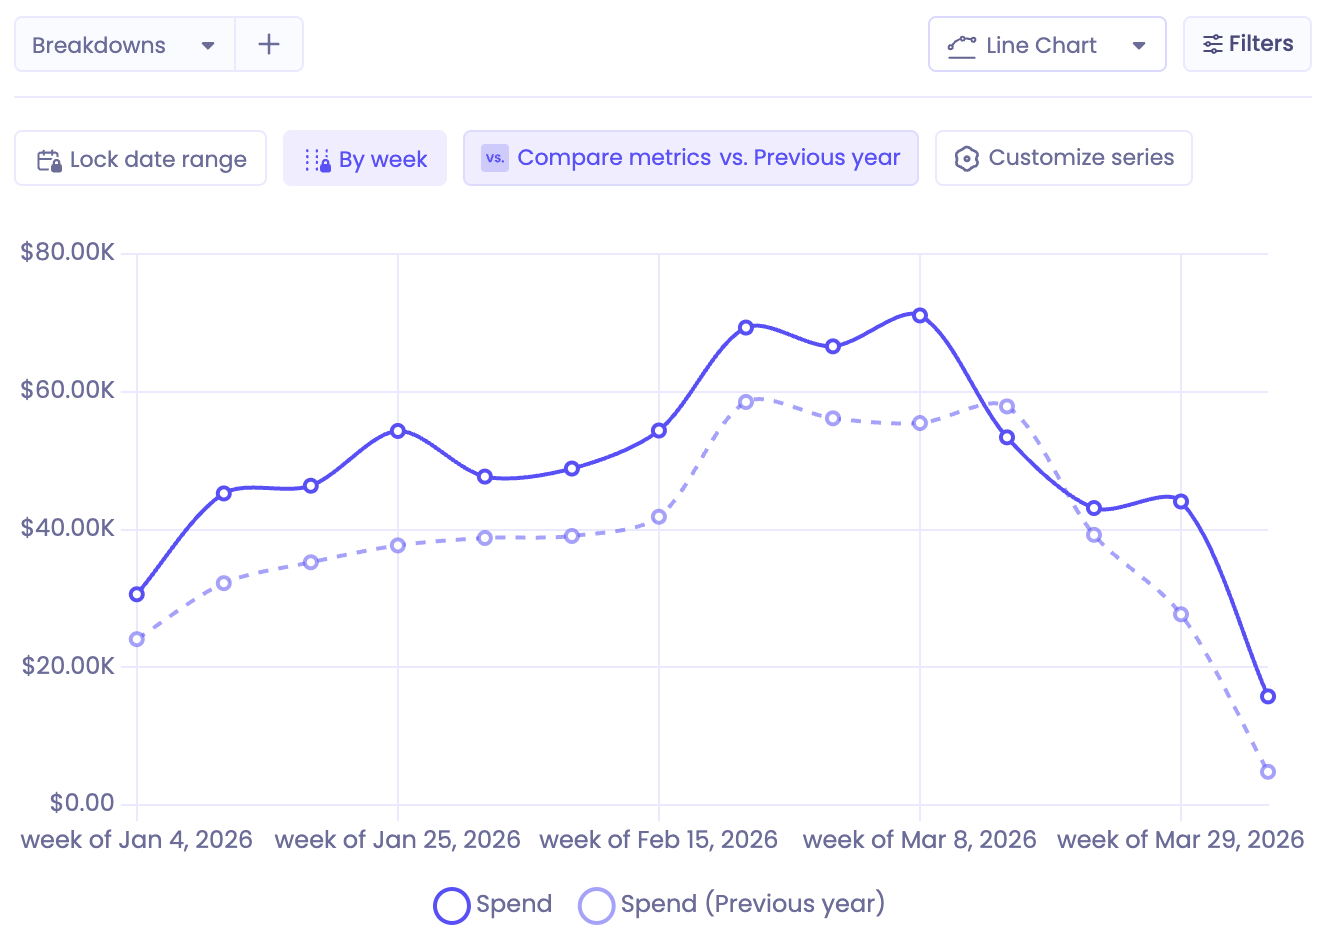
Polar’s visualization guide distinguishes Metric Cards, which display a number, from Sparkline Cards, which add a small trend chart. The documented controls include date-range selection and comparisons with an earlier period or year.
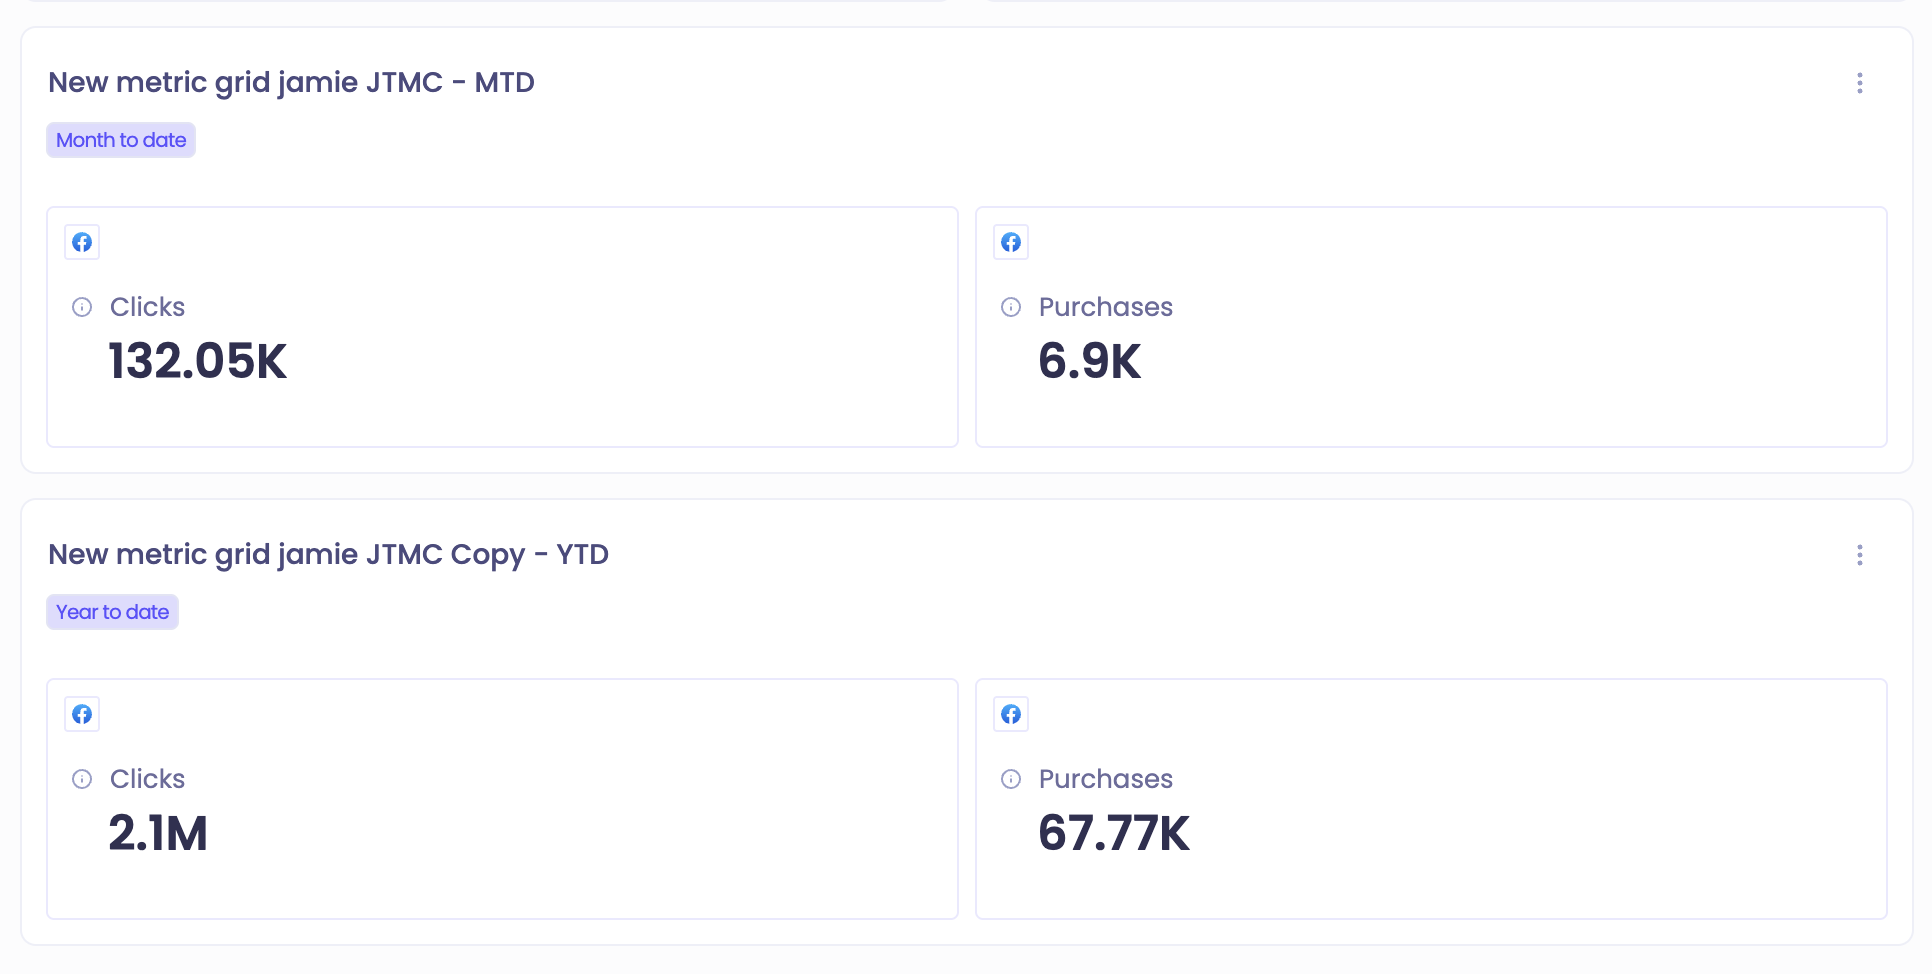
Dashboards 2.0 adds card-specific filters and locked date ranges. A team can therefore put month-to-date and year-to-date reporting into separate blocks, as the vendor’s example below shows. Check those periods before comparing two cards: a shared screen doesn’t necessarily mean a shared date range.
Charts, tables, and custom views
Tables help investigate performance by a dimension such as channel, campaign, or product. Charts make changes across time or categories easier to inspect. The current visualization guide describes mixed bar-and-line charts, stacked charts, and chart comparisons.
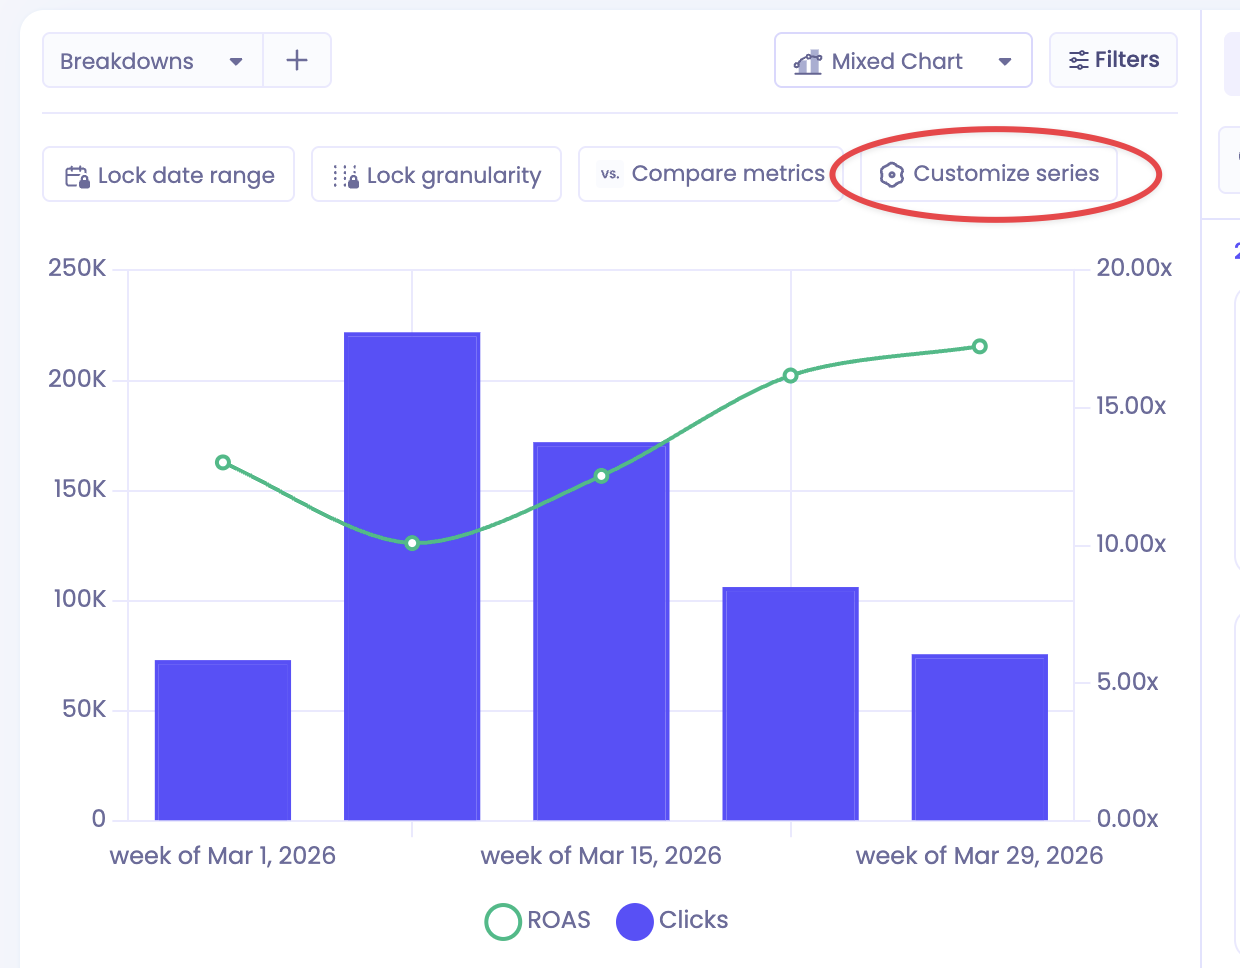
A mixed chart can place two measures on the same screen. In the example below, clicks appear as bars and ROAS as a line, with separate scales. Read both axes; a visual relationship alone doesn’t establish that more clicks caused a better return.
Which features matter for everyday reporting?
Custom reports and templates
Polar documents templates including Attribution Master, Ads Master, and Shopify DTC Profit & Loss. Selecting one loads preset metrics, breakdowns, and filters, which you can change and save.
That provides a starting point for recurring reporting. Before relying on a template, check whether its definitions match your business: a report called P&L still needs the costs relevant to your operation.
Retention, cohorts, and lifetime value
Polar’s cohort tools group customers so you can examine repeat behavior and revenue over time. The cohort documentation describes calendar-based periods and rolling windows, as well as metrics including retention and lifetime value (LTV).
One detail matters when reading these reports: the basic dashboard LTV metric and the Retention summary respond differently to date range and customer lifespan. Decide which customer group and observation period you need before comparing values.
Pixel attribution
The Polar Pixel supports first-party tracking and several attribution models, including first click, last click, and linear. Attribution assigns credit to recorded marketing touchpoints; changing the model can change the credit a channel receives.
Polar’s guide says campaign reporting depends on tracking parameters, past journeys cannot be reconstructed retroactively, and approximately two weeks of tracking are needed. It also states that free-trial accounts do not have Pixel access. These conditions matter if attribution is your main reason for evaluating the product.
Ask Polar, MCP, and automated reports
Ask Polar 2.0 is documented as supporting natural-language questions, follow-up analysis, charts, tables, saved prompts, and custom definitions. A useful evaluation question would specify the period and breakdown you need, such as revenue by product for new customers in the last month.
Polar also offers an MCP connection, an interface through which compatible AI tools can query its data layer. Its own guidance advises checking the tool calls, including dates and selected metrics, rather than accepting an answer without inspection.
For recurring work, Automations can send dashboard snapshots or run scheduled instructions and deliver results through email or Slack. That could support a routine reporting process, but the instructions and underlying data still need to reflect the question your team wants answered.
Can Polar answer a profit question?
Polar documents contribution-margin metrics that subtract different combinations of costs, expenses, and advertising spend from net sales. The important buying question is whether your required inputs are available and correctly defined.
Understand what the margin includes
The documented definitions are CM1 for net sales less total costs, CM2 for CM1 less expenses, CM3 for CM1 less ad spend, and CM4 for CM1 less both ad spend and expenses.
Product costs can come from Shopify, while additional costs and expenses use Google Sheets imports; advertising spend comes from connected platforms. Campaign-level analysis also requires the Pixel.
Consider this illustration using invented USD inputs. The calculation was not run in Polar.
| Input or output | Amount |
|---|---|
| Gross sales | $100,000 |
| Less discounts | $5,000 |
| Less returns | $10,000 |
| Net sales | $85,000 |
| Less product and additional costs | $30,000 |
| Less ad spend | $20,000 |
| Less separately recorded expenses | $8,000 |
| Illustrative CM4 | $27,000 |
The result follows Polar’s documented CM4 structure. It isn’t a customer outcome, an accounting net-profit figure, or proof that all those fields populate automatically.
If fulfillment or payment fees are absent from the supplied costs, the result won’t account for them. Keep imported costs separate from costs already recorded elsewhere to avoid subtracting the same expense twice.
Check the calculation settings
Polar’s Data Settings let users change how items such as returns, shipping, taxes, product costs, and imported expenses affect totals. The guide says changes apply to historical and future reporting across dashboards.
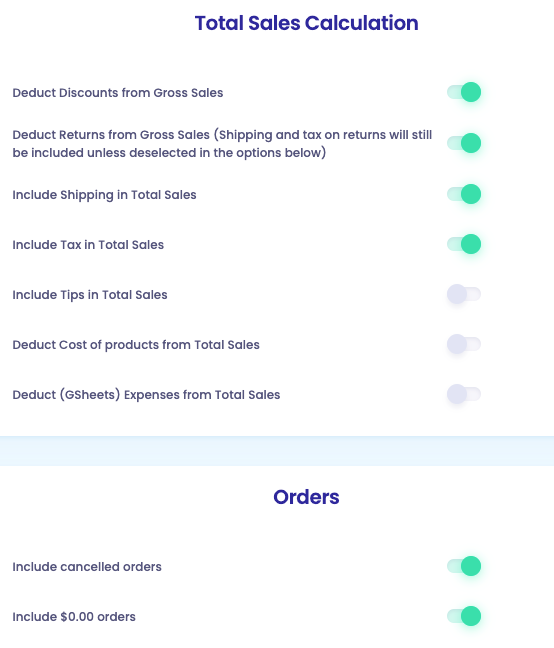
Including shipping in sales means including the amount charged to customers. It doesn’t establish that your outbound shipping expense has been deducted. Agree on the definition before treating a dashboard total as the answer to a profit question.
What setup and maintenance should you expect?
Connecting sources is only part of the work. You also need appropriate account access, a completed sync, and someone responsible for the costs and definitions used in recurring reports.
Polar’s sync guide says initial loading can take up to 24 hours, with some sources taking longer because of API limits. It documents 15-minute Shopify refreshes for users on the new pipeline; that isn’t a promise that every connected metric updates at the same speed. Multi-store full-day reporting also depends on the stores’ time zones being processed.
Custom connectors require help from Polar’s team and are available to paid customers rather than free-trial accounts. Check whether an essential source is self-serve or support-assisted before planning your evaluation.
Google Sheets can bring in supplementary data, but its guide specifies requirements for dates, numeric values, currency, and named ranges. A business using spreadsheets for missing expenses still needs to keep those inputs current.
How much does Polar Analytics cost?
As checked on October 5, 2026, Polar advertises Core from US$750 per month, with pricing tied to GMV, the value of merchandise sold. The Shopify listing describes online-GMV pricing, while the published terms describe impacted-GMV brackets and an entry price for brands below $5 million in annual impacted GMV.
Exact inclusions need care. The general pricing page describes dedicated support as included across plans and identifies some reporting capabilities as add-ons, while the terms describe support thresholds and different platform inclusions. Those pages don’t provide a consistent basis for promising every benefit at the starting price.
Request a quote that identifies:
- The GMV counted and the total recurring charge.
- The reporting and activation products included.
- Any custom-connector charges.
- Refresh cadence, warehouse access, and export options you require.
- Support level, billing term, and cancellation conditions.
For value, tie the expense to a recurring decision your team will actually make. More reporting options have limited value if nobody owns the inputs or acts on the results.
What are the strengths and limitations?
The documented capabilities suggest several useful strengths:
- Flexible reporting: cards, charts, tables, and custom breakdowns support different questions.
- Connected business data: sales, acquisition, and retention can be considered within the same reporting environment.
- Reusable reports: templates and automations support recurring analysis.
The main evaluation limits are also concrete:
- Data upkeep: missing costs and inconsistent definitions affect usefulness.
- Attribution access and history: the documented trial restrictions and observation period limit what you can evaluate immediately.
- Commercial clarity: required benefits need confirmation in the actual offer.
These are conclusions from the cited documentation. This review has not measured usability, reliability, support response times, or attribution accuracy.
Who should consider Polar Analytics?
Polar is a reasonable evaluation candidate for a team combining several sources or stores, building recurring reports, and needing business-specific definitions. Its reporting flexibility is most relevant when someone is responsible for maintaining the data and using it to decide what happens next.
Give the purchase lower priority if your existing reports already answer the question, or if nobody can maintain essential cost inputs. A team expecting immediate proof of advertising lift also needs an evaluation method that distinguishes attributed sales from incremental outcomes.
This fit judgment doesn’t establish a universal revenue cutoff or a winner against another tool. The appropriate test is your required report and the terms offered for it.
When is Putler a better fit than Polar Analytics?
Polar suits teams that want attribution, warehouse-backed reporting, and margin definitions built around their own costs. Some stores need something narrower: one accurate view of sales, customers, and products across every store and payment gateway they use, without a GMV-based quote.
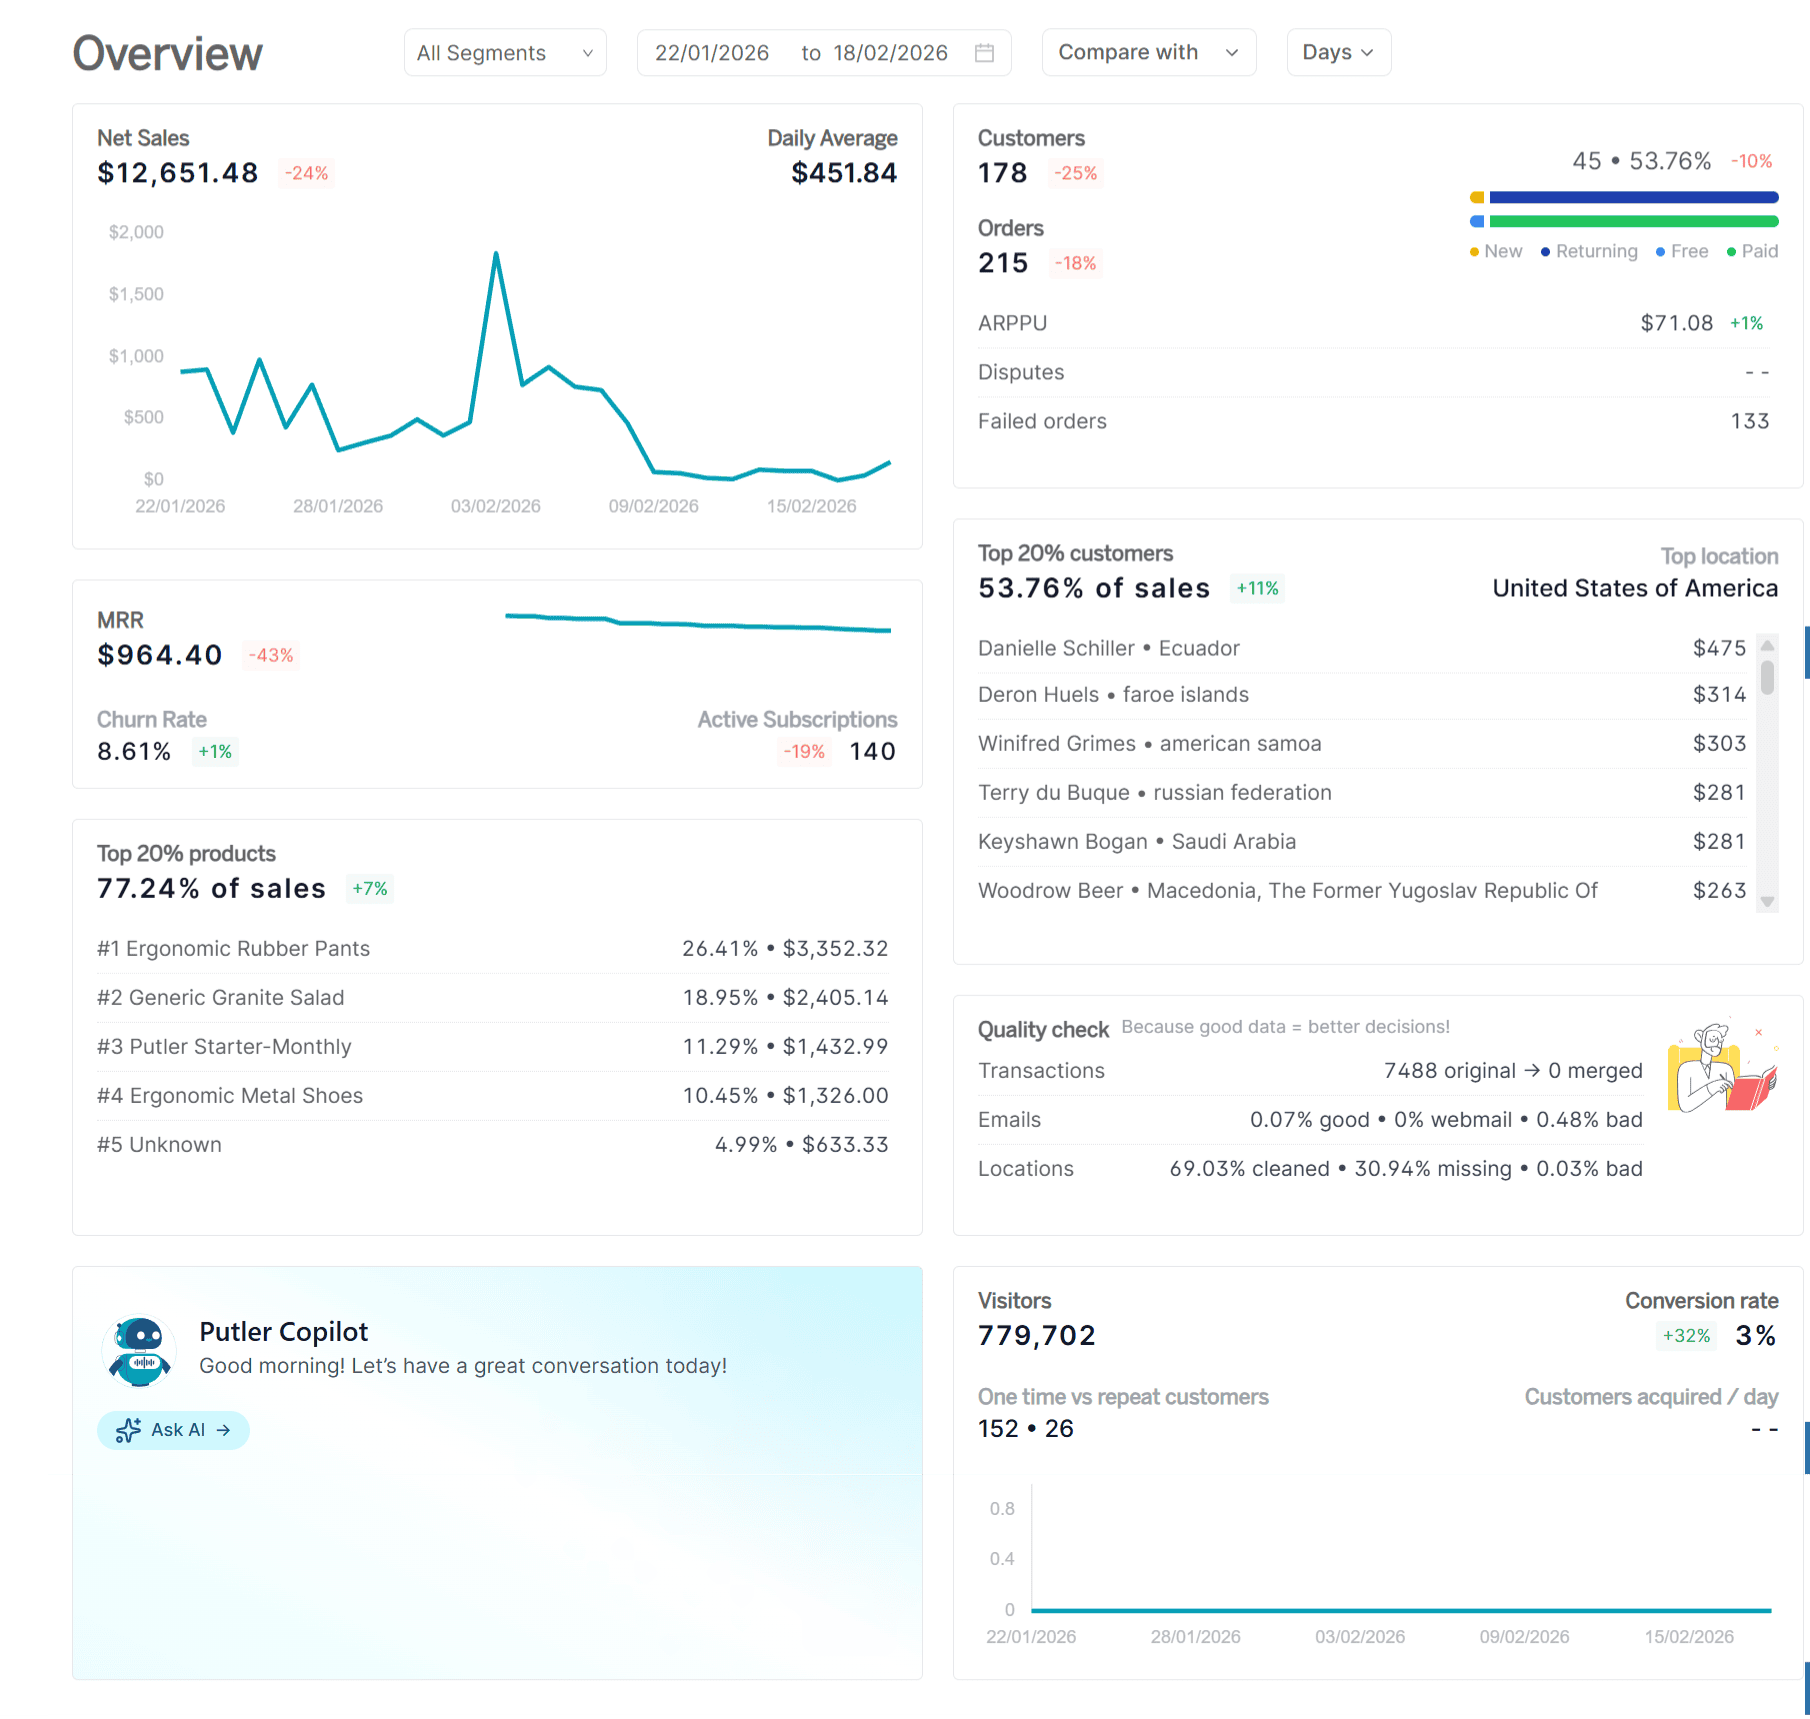
That is the job Putler is built for. It connects 17+ stores, payment gateways, and marketplaces, merges duplicate transactions, converts currencies and time zones, and then reports on the cleaned data. A PayPal payment and the WooCommerce order behind it count once, not twice.
| Area | Polar Analytics | Putler |
|---|---|---|
| Main job | Attribution, warehouse-backed BI, and custom margin reporting | Consolidated sales, customer, product, and subscription reporting |
| Pricing basis | GMV, with Core from US$750/month | Monthly revenue, from $20/month for up to $10,000 |
| Trial | Seven days, without Pixel or custom connectors | 14 days, no credit card, all features on 90 days of data |
| Ad attribution | First-party Pixel with several models | Not a core feature |
| Customer analysis | Cohorts, retention, and LTV | RFM segments, customer profiles, and subscription metrics |
On Putler’s published tiers, a store with $100,000 in monthly revenue pays $150 per month. Every plan includes data cleanup, currency conversion, forecasting, weekly email reports, and unlimited team members with no per-seat charge. Segments export to CSV or Mailchimp.
Putler is not a replacement for Polar’s attribution or contribution-margin reporting. It doesn’t offer a first-party ad pixel or campaign-level profit, so a team whose main question is ad efficiency should keep evaluating Polar or a dedicated attribution tool.
The better test is the same one this review recommends for Polar: pick the recurring question first, then see which tool answers it with the least upkeep.
Frequently asked questions
How much does Polar Analytics cost?
Core is advertised from US$750/month as of October 5, 2026. Pricing depends on GMV and the purchased configuration, so the entry price doesn’t establish your total charge.
Who is Polar Analytics best for?
The documented capabilities make it worth considering for ecommerce teams needing connected, customized, recurring reporting. Fit depends on whether the reports answer a useful business question and whether the team can maintain the inputs.
Does Polar Analytics have a free trial?
The published terms describe a seven-day trial. Product guides state that the Pixel and custom connectors are unavailable on free-trial accounts, so confirm how your required features can be evaluated.
How long does Polar Analytics take to set up?
Polar documents initial syncs of up to 24 hours, with some sources taking longer. Full setup also depends on permissions, required connectors, and reporting definitions; this review hasn’t measured onboarding duration.
Can a Polar profit report include actual business costs?
The documented contribution-margin calculations use product costs, imported costs or expenses, and connected advertising spend. Whether the report covers your actual costs depends on the inputs and configuration supplied.
Does a higher reported ROAS prove incremental sales?
No. Attribution assigns credit to observed touchpoints under a chosen model. Establishing incremental sales requires evidence about what would have happened without the marketing activity; a dashboard change alone doesn’t answer that question.
What should you evaluate before buying?
Pick one decision you need to make repeatedly, such as comparing contribution margin across markets. Write down the sales, returns, costs, expenses, and filters the answer requires, then ask to see how that report is built and which package provides it.
Use the public screenshots to understand the controls, and request a demonstration of the parts the trial cannot expose. Confirm the quote against those requirements before purchasing. You should leave the evaluation knowing which decision the report supports, who will maintain its inputs, and what the service will cost.