Data Analytics for Retail: The Key to Outperforming Your Competitors
Data analytics for retail business involves harnessing the real power of the data to gain insight into your business. But it all starts by using the right tool. So let's get started.
Last updated on April 30, 2026
If you run a retail business today, whether it’s a Shopify store, an Amazon storefront, or a mix of both, you’re sitting on a goldmine of data.
But let me be honest… data without direction is just noise.
I’ve seen this first-hand, business owners juggling reports, spreadsheets, and tabs, hoping it’ll somehow make sense. That’s where data analytics for retail comes in.
It helps you cut through the clutter and actually understand:
What’s working in your business
What’s not performing as expected
What to do next across your sales, products, customers, and marketing
This guide focuses on three key groups:
Store owners who also sell online (omnichannel)
Retailers who wish to expand digitally
Analysts or consultants exploring customer trends in retail behavior
In my experience, retail today isn’t just about brick-and-mortar. It’s about selling across channels – your website, marketplaces like Amazon, and maybe even a physical location. And to thrive, you need to connect all that data.
Slow adoption of eCommerce and e-books, strategic errors with online partnerships.
Linens ‘n Things
Home Goods Retail
2008
Struggled against online competition in the home goods sector.
Sports Authority
Sporting Goods Retail
2016
Failure to adapt to the changing retail landscape for sporting goods, including online sales.
RadioShack
Electronics Retail
Ongoing closures from 2015
Failure to adapt to online sales and competition from big-box stores.
Toys “R” Us
Toy Retail
June 2018
Slow development of online presence, intense price competition from online retailers.
The Limited
Apparel Retail
2017
Struggled with online competition and shifting fashion trends in the mall-based apparel market.
Nine West
Footwear Retail
2018
Inability to maintain relevance and compete with online footwear sales.
These are the retailers who shut down all their operations with major losses. Same goes with clothes, mobiles, groceries, you name it.
Why? Because they were too slow to notice and adapt to the shifting buying patterns of consumers moving from physical stores to eCommerce.
And when they finally tried to catch up, they failed again, this time by ignoring the power of data. Without sophisticated data analytics, they couldn’t make informed decisions, giving competitors like Amazon a massive edge.
Solution: Data analytics for retail.
This McKinsey report highlights that data-driven decisions boost sales by 10 percent, while personalizing eCommerce experiences with data leads to a 30 to 50 percent increase in digital sales.
Retail data analytics provides you with answers to crucial questions.
Where are your sales really coming from
Which products are crushing it (and which need work)
How your customers behave and buy
Which marketing campaigns are working
What you need to do next to grow
Which channel brings the most customers
How much inventory is just enough—not too much, not too little?
What signals show a customer is ready to leave—or stay forever?
And much more.
Before you dive deeper, learn how to actually read your store’s data, start with eCommerce Analytics 101.
What is data analytics for retail in today’s omnichannel world?
“Retail” used to mean physical stores. Something you could walk into, talk to a sales rep, and buy from.
But today? It’s way broader.
Retail now means:
A Shopify store with global customers
An Amazon seller account with hundreds of SKUs
A WooCommerce store running flash sales
Maybe even a weekend pop-up at a local market
Retail is everywhere. And so is your customer.
That’s why modern data analytics in retail industry has changed, too. It’s not just about counting footfalls or tracking inventory in a physical store. It’s about understanding performance across all your selling platforms.
Data headaches every multichannel retailer faces
I have been working with Putler for over a decade now and during my tenure I have worked and have constantly been in conversation with many eCommerce store owners.
Based on this knowledge, I have identified problems they are facing with retail analytics implementation.
Here’s my tell-all guide to the challenges faced and the solutions that saved their sanity.
Risks of inaccurate eCommerce data
What you don’t know, or think you know, about your data could be costing you more than you realize.
Fragmented data sources
Every morning used to start with the “dashboard dance”—logging into Amazon Seller Central, then Shopify, then pulling up WooCommerce reports, checking Etsy stats, and finally opening the POS system.
Each platform speaks its own language and exports data in different formats, making comprehensive analysis nearly impossible.
Platform-specific tracking limitations
When businesses wanted to understand how customers browse their products on Amazon, they hit a wall: no custom tracking allowed.
Similarly, Etsy and other marketplaces limit what behavior data you can capture, leaving huge blind spots in customer journey mapping.
Inconsistent data definitions
Talk about frustration. I discovered “conversion rate” meant something different on every platform. Amazon counted units sold per session, while Shopify calculated orders per visitor.
This made comparing performance across channels like comparing apples to oranges (or maybe more like apples to power tools).
And that’s just scratching the surface of how deeper identity issues can quietly derail your business.
Customer identity and journey gaps
When customers move across platforms, most businesses are left piecing together a very incomplete story.
Cross-channel customer identification
Last holiday season, a store owner told me he realized Olivia from Instagram, who bought a dress on his Shopify store, was likely the same Olivia who purchased matching accessories on Amazon.
But his system saw them as completely different customers.
This fractured view prevented him from understanding true customer value.
Offline-online data sync
Another problem was the day he had to cancel three online orders because items had sold in his physical store but weren’t updated in his online inventory was the day he knew he needed serious help.
The manual reconciliation was taking him hours every day. But identity gaps aren’t the only technical hurdles standing in the way of clean, actionable data.
Technical and API limitations
Even the most powerful platforms have hidden ceilings that can quietly throttle your growth.
API limits and data freshness
“Real-time” data isn’t always real-time. Many platforms limit how often you can pull data, and some only update their reports every few hours.
During a flash sale, this meant making decisions with outdated information.
Attribution and marketing ROI
I once spent $200 on Instagram ads, convinced they were driving my sales surge, and I was using Putler analytics.
The tool showed that most buyers had actually heard about us from organic searches that cost me nothing.
Handling returns, refunds & chargebacks
Returns were an accounting nightmare. A customer would buy on Amazon, return to a physical store, and suddenly, have inventory discrepancies and financial records that didn’t match.
The ripple effect extends across the supply chain. Each platform processed returns differently, creating a reconciliation maze.
Privacy, compliance & consent
When GDPR hit, you needed a law degree to understand what data you could collect and how you needed to store it across all sales channels.
Each platform had different consent mechanisms, making compliance a moving target.
Selecting and Integrating a BI/Analytics Tool
Many store owners wasted months and thousands of dollars on a fancy BI tool that their team couldn’t use because it was too complex. All that beautiful data visualization was worthless if nobody looked at it.
Scalability & ongoing maintenance
Every time a new sales channel or product line was added, the carefully constructed data system threatened to collapse.
What worked for three channels broke completely when a fourth channel was added, and updating the data pipeline became a part-time job.
Of course, having access to data is one thing; knowing how to interpret it is an entirely different challenge.
Analytics accuracy and interpretation
More data isn’t always better, especially when it clouds the real signals you should be acting on.
Actionable insights vs. data overload
One of the major problems I noticed everyone faced with retail analytics platforms is that they are tracking so many metrics that they become paralyzed by information.
Should I focus on Amazon conversion rates, Etsy average order value, or website traffic? The forest was lost in the trees.
Seasonal analysis challenges
Last year, someone shared how comparing year-over-year performance became nearly impossible after adding two new sales channels.
The big question? Was the holiday sales growth due to better products, smarter marketing, or just more places for customers to shop?
And while making sense of data is crucial, getting your whole team to use it the right way is where the real magic happens.
Team enablement and access control
The best retail store analytics system fails if the right people can’t access or don’t trust the numbers.
Team data literacy & adoption
My biggest surprise was discovering that the biggest data challenge wasn’t technical—it was human.
My sales team didn’t trust the new dashboards and was still using their own spreadsheets, and nobody was making decisions based on our expensive new analytics for retail.
“Need-to-know” data access dilemma
As a marketeer, I myself was drowning in metrics, trying to make sense of data meant for sales, ops, and finance.
Meanwhile, the sales team kept asking for updates on their numbers because they didn’t have direct access. It created bottlenecks, confusion, and delays.
The real fix? Giving each team access only to the metrics they needed. Once that happened, everyone worked faster, stayed focused, and finally trusted the data.
All of which brings us to a smarter, faster way to pull everything together without the usual headaches.
Retail analytics solution
Now that we have discussed all the benefits and challenges of data analytics for retail businesses, let’s talk about the solution.
First, I will be introducing each retail analytics tool, then I will be comparing each tool based on the solution.
But no tool is designed to provide you with a complete solution to all retail challenges. We are just talking about which tool can tackle most of them.
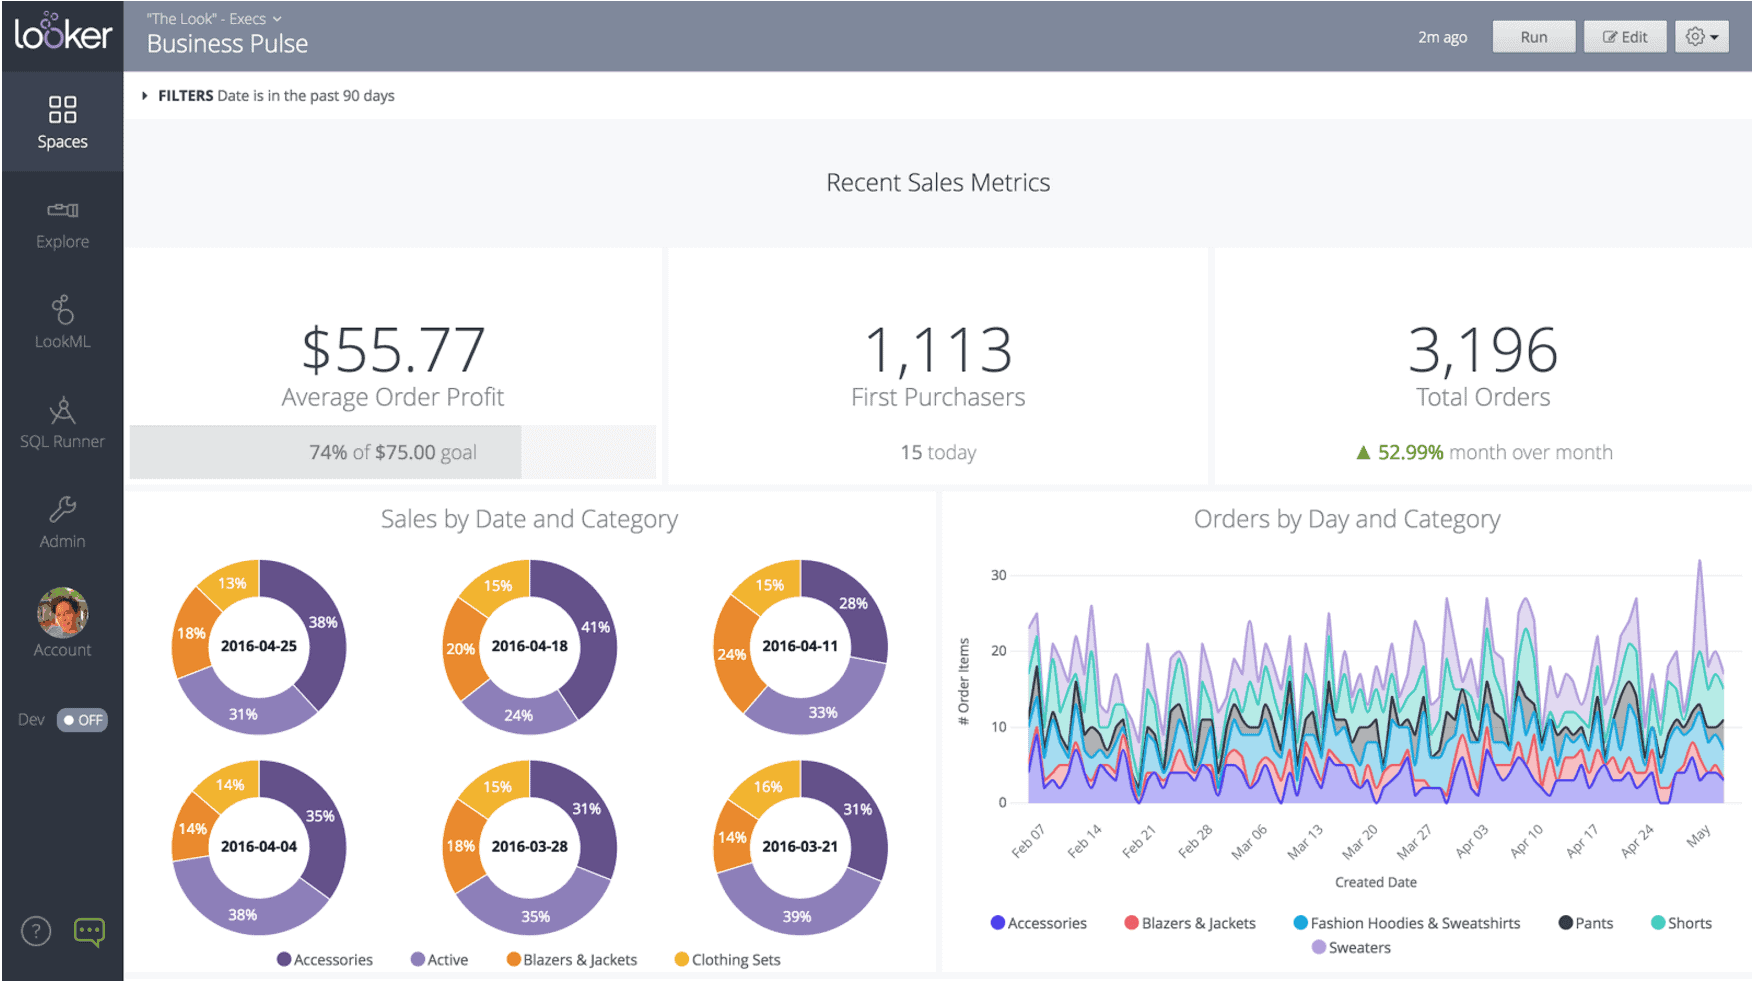
Looker
Looker is a data tool that helps teams explore, analyze, and share insights. It connects directly to databases, so you can work with live data. Looker uses a special language called LookML to create custom views, making it easy for businesses to understand their data and make better decisions together.
Highlights:
Built for cloud environments and works seamlessly with Google BigQuery.
Uses LookML (Looker Modeling Language) to define business logic and standardize metrics.
Scalable for real-time analytics across large datasets.
Enables embedded analytics and customized data experiences inside apps or portals.
Ensures a single source of truth by enforcing metric consistency across reports.
Best suited for data-driven organizations with technical resources.
Integrates well with Google Cloud tools and offers strong data governance features.
Pricing:
Viewer user: $30/user/month
Standard user: $60/user/month
Developer user: $125/user/month
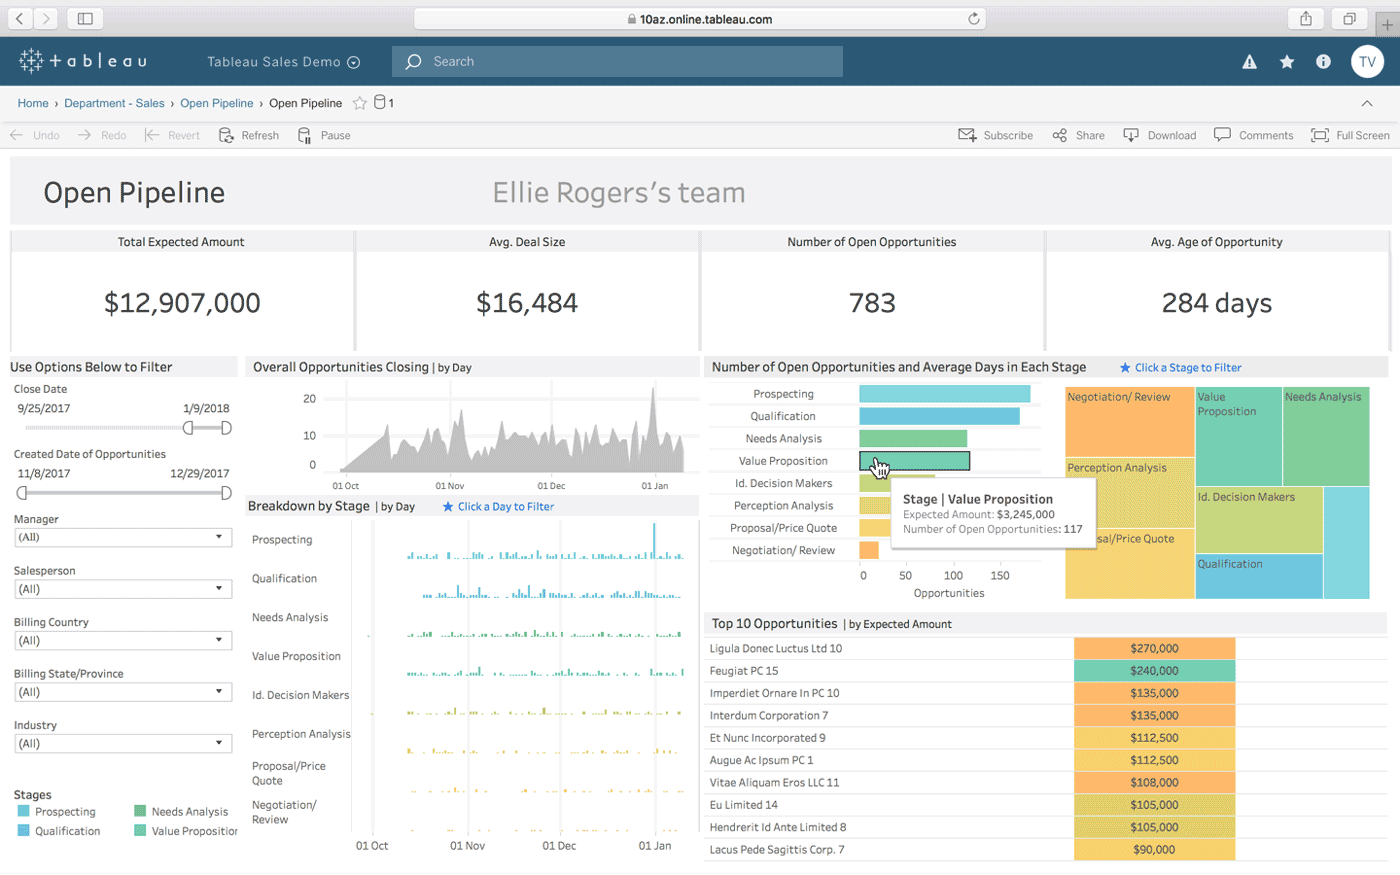
Tableau
Tableau is a popular tool that helps turn complex data into easy-to-read charts and dashboards. It’s great for anyone who wants to explore data without needing to code. With simple drag-and-drop features and real-time updates, Tableau makes it easier to understand data and make smart business decisions.
Highlights:
Industry-leading data visualization tool.
Supports complex, custom dashboards across data sources.
Great for large datasets when connected to a warehouse (e.g., BigQuery, Snowflake).
Requires ETL or data engineering setup for fragmented sources.
Scalable for enterprise use with role-based access and sharing.
Strong at time-based analysis, trendlines, seasonal comparisons.
Best for teams with dedicated analysts or data teams.
Pricing:
Creator: $70/user/month
Explorer: $35/user/month
Viewer: $12/user/month
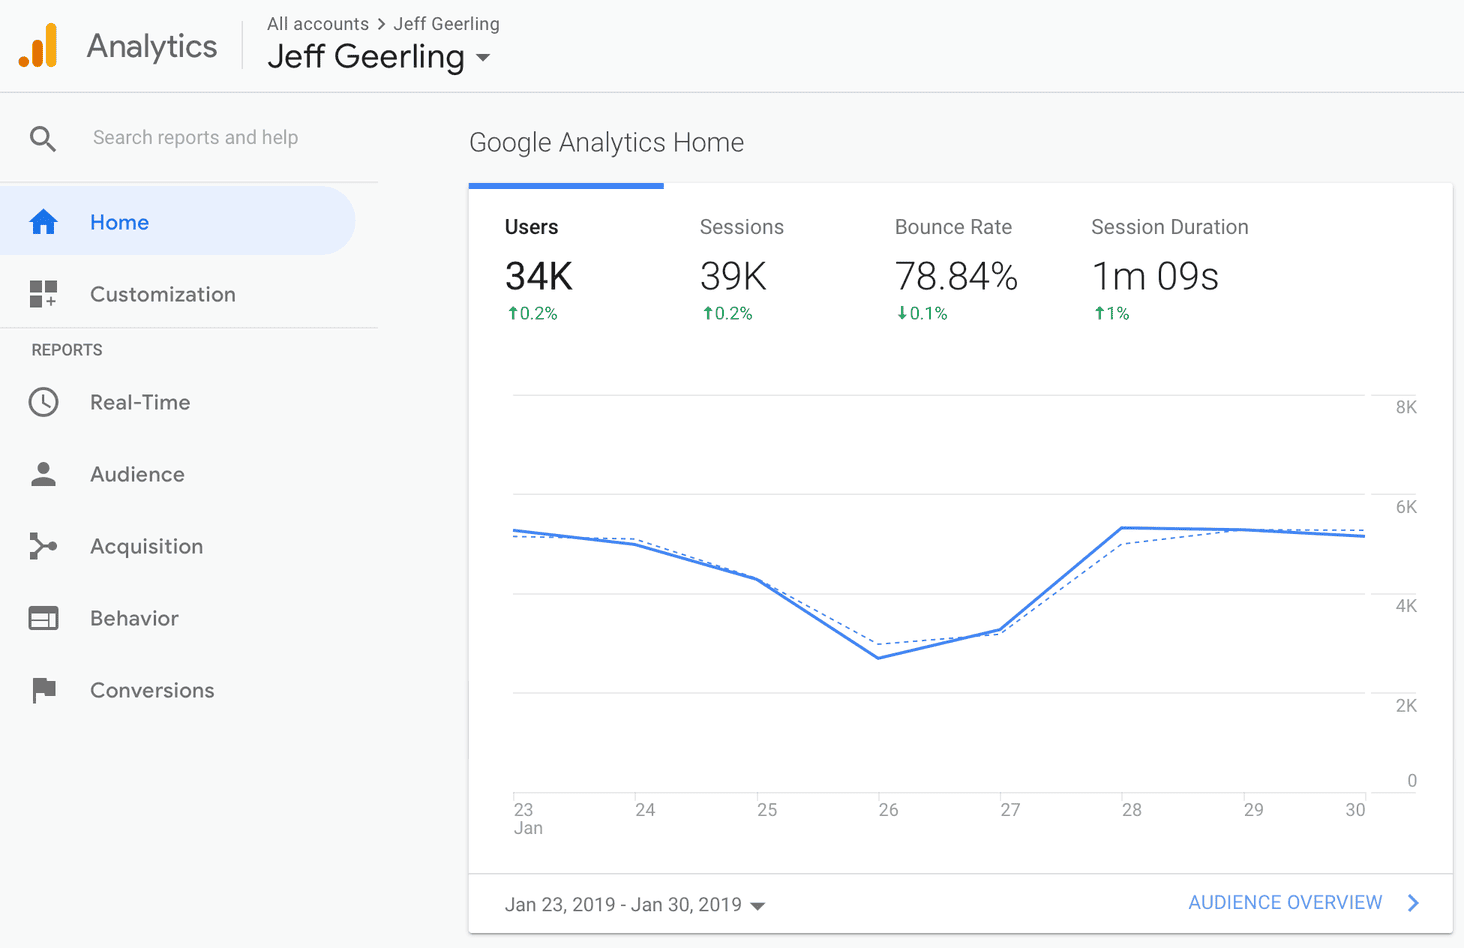
Google Analytics
Google Analytics is one of the most popular web analytics tools. It caters to a wide range of industries, including retail businesses. It helps you to track and analyze your website traffic and user behavior. It provides valuable insights into your visitors and helps optimize your online presence.
Highlights:
Tracks user behavior on websites and mobile apps using an event-based model.
Provides detailed insights into traffic sources, user journeys, and conversion paths.
Integrates natively with Google Ads, Looker Studio, Firebase, and BigQuery.
Includes Consent Mode and privacy settings for GDPR and CCPA compliance.
Supports audience segmentation, funnel tracking, and engagement metrics.
Doesn’t handle eCommerce operations like refunds, offline sales, or multi-channel consolidation.
Some data sampling and time lag issues, especially for high-traffic sites or free-tier users.
Pricing:
Google Analytics is a free tool, and Google 360 starts from $ 50,000 per month.
Why choose Putler over others?
Retailers who sell online through platforms like Shopify, WooCommerce, Etsy, Amazon, or across multiple eCommerce channels.
Compares data before and after campaigns for better evaluation, measures performance using sales volume, revenue, and other crucial metrics.
Automatically pulls and deduplicates data from multiple sources, reduces manual work, and provides real-time insights.
Sends weekly performance emails to admins, including snapshots of business health and key metrics. Keeps you updated even when away from the dashboard.
Pricing:
Starter Plan: $20/month, 1 user, up to 3 data sources.
Growth Plan: $50/month, unlimited users, up to 15 data sources.
Custom Plan: Custom pricing for businesses with specific needs.
Analytics for retail comparison
Here is a breakdown of these analytics for retail to further clarify your decision.
Challenge
Tableau
Looker
Putler
Google Analytics (GA4)
Fragmented data sources
✅ With ETL/data warehouse
✅ Via BigQuery connectors
✅ Built-in integrations
⚠️ Tracks only websites & apps; limited source data
Inconsistent metrics
✅ Custom calculated fields
✅ Custom via LookML
✅ Standard retail KPIs
❌ Fixed definitions, Complex
Cross-channel customer ID
⚠️ Needs customer mapping
⚠️ Needs data modeling
✅ Combines customer profile
⚠️ Only for website/app sessions, not across tools
Behavior tracking
❌ Not built-in
✅ With GA4 integration
❌ Not behavior-focused
✅ Strong web/app behavior tracking
Offline-online sync
✅ Possible via integration
✅ BigQuery-based sync
⚠️ Limited offline integration
❌ Web/app only – no offline support
API limits & data freshness
⚠️ Depends on data source
✅ Real-time BigQuery
✅ Handles platform limits
⚠️ 24–48h lag, sampled data in reports
Returns, refunds, chargebacks
✅ With data input
✅ If modeled properly
✅ Natively supported
❌ Not supported directly
Privacy & compliance
✅ User access & filters
✅ Encryption, access control
✅ GDPR-ready
✅ Consent mode, privacy controls
Scalability
✅ Enterprise-ready
✅ Cloud-native & scalable
⚠️ Best for SMBs
✅ Designed for high traffic
Seasonal trends
✅ Strong time series features
✅ Date filters + visual tools
✅ Built-in holiday-season reports
✅ Date comparison, trends available
Cross-platform team access
✅ Server/Cloud access
✅ Shareable reports
✅ Multi-user access
✅ Admin/user roles for teams
Conclusion
Most retailers are drowning in data but starving for insights. I’ve seen how connecting these 15 data challenges transforms businesses from reactive to strategic.
Think of multichannel retail like cooking in five kitchens simultaneously, impossible without the right system. The retailers winning today aren’t just selling better products.
They’re making smarter decisions because their data tells one complete story, not many conflicting ones.
2 thoughts on “Data Analytics for Retail: The Key to Outperforming Your Competitors”
Tarhib IT Limited
Fantastic insights on data analytics for retail! Your clear and practical advice is incredibly valuable for anyone in the industry. Thanks for sharing your expertise! 📊🛍️👏


Fantastic insights on data analytics for retail! Your clear and practical advice is incredibly valuable for anyone in the industry. Thanks for sharing your expertise! 📊🛍️👏
Glad you found my advice valuable.