

Small businesses generate more data than ever before from websites, ecommerce stores, payment gateways, marketplaces, email campaigns, and customer interactions. The challenge is no longer collecting data; it’s turning that data into actionable insights that drive growth.
Businesses that regularly use analytics can identify profitable products, understand customer behavior, optimize marketing spend, and make better decisions faster than competitors relying on intuition alone.
That habit has a name. Analytics for small business is the practice of turning the data a business already collects into decisions about products, customers, and spend.
A widely cited McKinsey Global Institute analysis found data-driven organizations are 23 times more likely to acquire customers, six times more likely to retain them, and 19 times more likely to be profitable.
This article covers what small business analytics actually is, the data challenges that get in the way, the free tools worth starting with, and where a unified tool fits once those tools run out of room.
In this guide, you’ll learn what small business analytics is, which metrics matter most, the best analytics tools to use, common challenges businesses face, and how tools like Putler help bring all your business data into one place.
What analytics for small business actually means
Analytics for small business is not about crunching massive datasets. It is about answering practical questions with the data already coming in from a store, a payment processor, and a website.
IBM defines data analytics as applying analytic techniques to large, varied data sets, structured and unstructured, from many sources, to surface hidden patterns, correlations, and insights a business can act on.
For a small eCommerce business, that definition shrinks to four questions:
- Which products make the most profit, not just the most revenue?
- Where do the best customers come from?
- Which marketing efforts actually pay off?
- Why do some customers buy once and vanish while others keep coming back?
It also helps to know that analytics comes in layers. Descriptive analytics tells you what happened. Diagnostic analytics tells you why. Predictive analytics estimates what happens next. Prescriptive analytics suggests what to do about it. Most small businesses live in the first two layers and grow into the others. That progression is the heart of practical data analysis for small business.
For a deeper foundation on tracking an online store, the eCommerce Analytics 101 guide is a solid starting point.
Why small businesses need actionable data, not more data
Most small businesses do not have a big data problem. They have a usable data problem.
As Gartner’s Peter Sondergaard put it, data is only raw material. Analytics is the engine that turns it into something useful.
Big data is about volume. Usable data is about value. Volume is the enterprise game, with warehouses and data teams. Value is the small business game, and it runs on a handful of numbers tied directly to decisions.
The common trap is tracking everything. Every dashboard, every metric, every report. Months later the reports look impressive and sales have not moved, because data is not insight. A report that does not change a decision is decoration.
The fix is a single question worth writing on a wall: what are the 10 to 15 numbers that actually drive decisions here? A business that can answer that has already won half the battle of big data for small business. Everything else is noise.
Benefits of small business analytics
- Identify your most profitable products and services.
- Understand customer behavior and buying patterns.
- Improve marketing ROI.
- Increase customer retention.
- Forecast future revenue more accurately.
- Make data-backed decisions with confidence.
Key small business analytics metrics to track
A useful metric set spans five categories: website traffic, sales and products, customer insights, marketing performance, and financial health. The table below maps the core metrics in each, and what each one tells a business owner.
| Category | Metric | What it shows |
|---|---|---|
| Website & traffic | Pageviews | Total pages viewed |
| Unique visitors | Count of individual users | |
| Bounce rate | % who left after one page | |
| Avg. session duration | Time spent per visit | |
| Traffic sources | Where visitors came from | |
| Sales & products | Units sold | Total products sold |
| Gross revenue | Sales before returns/discounts | |
| Net revenue | Sales after returns/discounts | |
| Avg. order value (AOV) | Avg. spend per order | |
| Refund rate | % of refunded orders | |
| Customer insights | Customer lifetime value | Total value per customer |
| Purchase frequency | How often people buy | |
| RFM score | Recency, frequency, and spend level | |
| Churn rate | % of customers lost | |
| Retention rate | % of customers kept | |
| Marketing performance | CAC | Cost to get a new customer |
| ROAS | Revenue per $1 spent on ads | |
| Email open/click rate | Email engagement | |
| Social engagement rate | Likes, comments, shares | |
| Campaign conversion rate | % of leads who convert | |
| Financial metrics | MRR | Monthly recurring revenue |
| ARR | Yearly recurring revenue | |
| Gross profit margin | Profit after product costs | |
| Operating expenses | Business running costs | |
| Net profit | Final earnings after all costs |
One metric deserves more weight than the rest: profit, not revenue. A product can top the revenue chart and still lose money once production cost, shipping, returns, and fees come out. Revenue flatters. Profit tells the truth. Any business analytics for small business setup that stops at revenue is measuring the wrong finish line.
Common small business analytics challenges
Small business analytics breaks down in predictable places. The challenges below fall into four groups: collecting data, choosing tools, segmenting customers, and finding the time to do any of it. Each one has a practical fix.
Data collection challenges
The first wall is getting clean, complete data in one place.
1. Fragmented data sources: Data sits scattered across Amazon, Shopify, PayPal, and the website. It is a puzzle with half the pieces in different rooms. The fix is a centralized hub that connects every sales channel automatically, so everything shows up in one place.
2. Uncertainty about what data matters: A flood of numbers does not point to what drives growth. Conversion rate, customer acquisition cost, and repeat purchase frequency are the three that tell most of the story for a small store.
3. Inconsistent data formats: Shopify reports sales one way, Amazon another, and comparing them feels like translating two languages. Standardized metrics across channels remove the guesswork.
4. Data accuracy concerns: One tool says 500 visitors, another says 650, and cross-checking eats the afternoon. Picking one source of truth and sticking with it solves more than any reconciliation effort.
5. Data duplication issues: A single customer who buys through two channels gets counted twice, which inflates the customer count and distorts every downstream metric. Identity resolution builds one unified profile per customer, so the numbers reflect reality.
Tool and technology challenges
The second wall is the tools themselves: cost, complexity, and compliance.
6. High cost of data tools: Enterprise platforms are powerful and priced for enterprises. Scalable, pay-as-you-grow tools built for small businesses cover the real need without the half of features nobody uses.
7. Data privacy compliance: GDPR and CCPA are stressful to read, let alone implement, without a legal team. Tools with built-in compliance carry most of that load.
8. Complexity of tools: Reports that look like they need a data science degree get ignored. Visual dashboards that read in plain language get used.
9. Inaccurate forecasting: Inventory and staffing decisions made on guesswork tend to miss. Predictive analytics learns from past trends to make those calls sharper.
10. Real-time data access: Reports read days after the fact arrive too late to act on. A real-time dashboard shows what is happening now, while there is still time to respond.
Customer segmentation challenges
11. Treating every customer the same: Telling VIPs apart from one-time buyers feels like finding specific faces in a stadium. Behavioral analytics groups customers by how they act, so the right message reaches the right people.
Resource and strategy challenges
The last wall is the smallest team problem: no time, no plan, no budget.
12. Limited resources: When one person is the CEO, marketer, and support rep, manual analysis never happens. Simple tools with automated insights do the watching instead.
13. Lack of data strategy: Data collected with no plan just sits there. A basic roadmap that links each key metric to a business goal gives every number a purpose.
14. Budget constraints: Analytics competes with inventory and ad spend for the same rupee or dollar. Starting with free tools earns quick wins, which fund stronger tools later.
That last point leads straight to the free tools worth starting with.
Free and freemium tools for small business analytics
Free tools are the right starting point for most owners. Three are worth knowing before spending anything, and each fits a different need. This is where small business data analytics usually begins.
Google Analytics
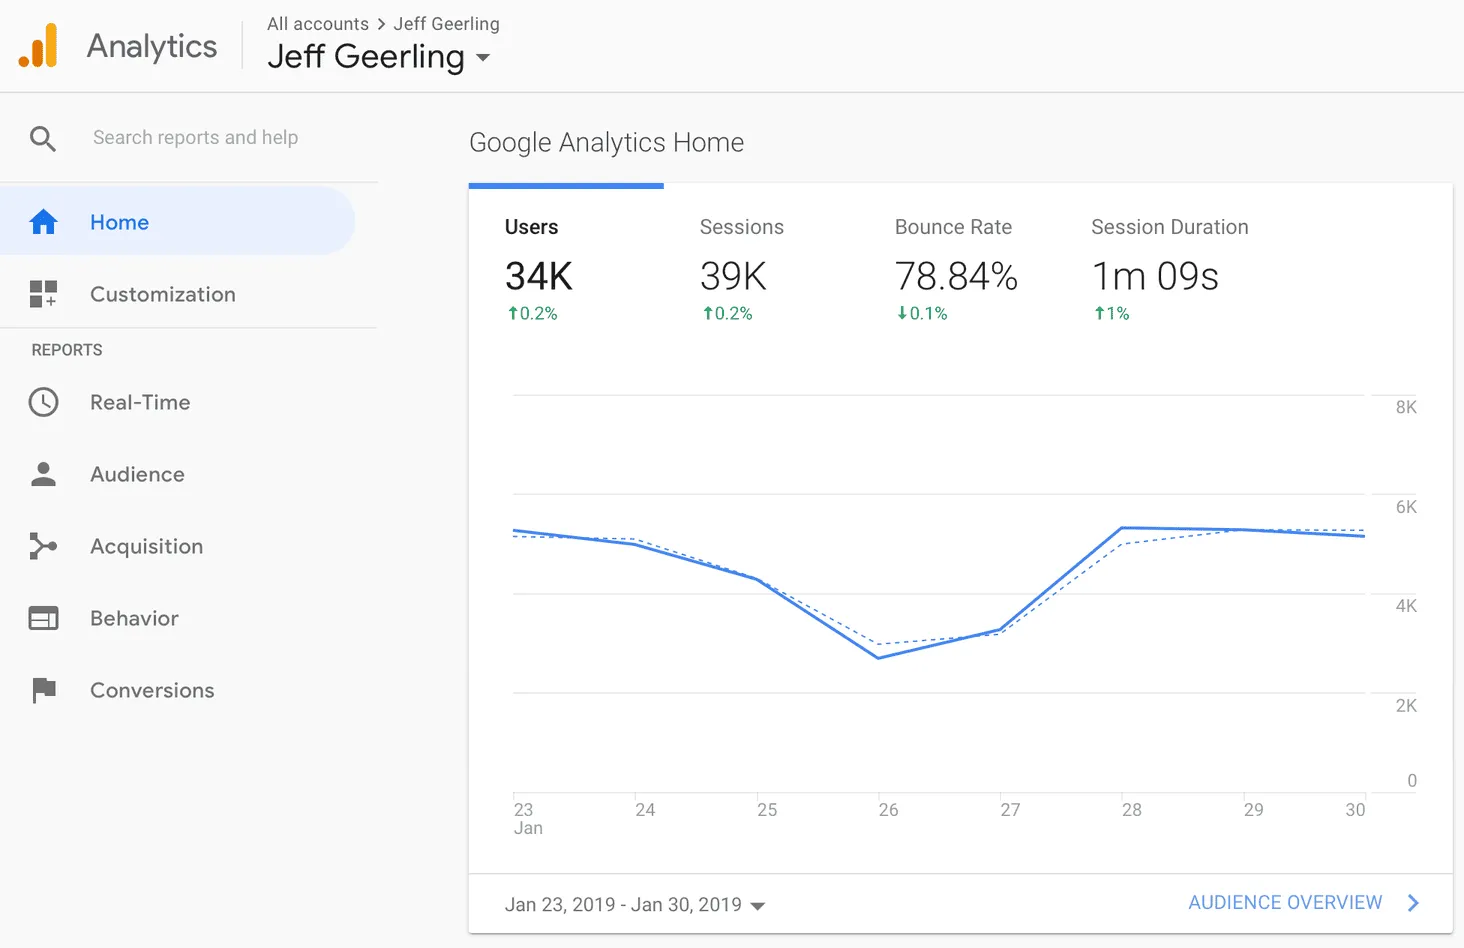
Google Analytics is free and gives solid website traffic insight, which makes it a natural first step. Its limits show once a business grows past a simple website. The jump to Google Analytics 360 starts at roughly $50,000 a year, which leaves a wide gap between free and enterprise.
Features:
- Comprehensive website traffic analysis
- Customizable dashboards and reports
- Integration with other Google services such as Google Ads and Search Console
- Real-time data tracking
- User demographics and behavior insights
Pros:
- Free and widely supported: tracks website and marketing data thoroughly at no cost.
- Strong traffic insight: good at showing sources, behavior, and conversions.
- Built-in goal tracking: funnel visualization comes standard.
Cons:
- Steep learning curve: beginners struggle to get past setup.
- Limited retention: free users get up to 14 months of data (2 months by default).
- No direct commerce connections: does not link to Shopify, Amazon, or PayPal.
- Sampling issues: large datasets get estimated, not counted.
Who is it for: Bloggers, startups, and small websites that want free website-traffic insight. A good entry point that lacks depth for multi-channel or eCommerce businesses.
Matomo
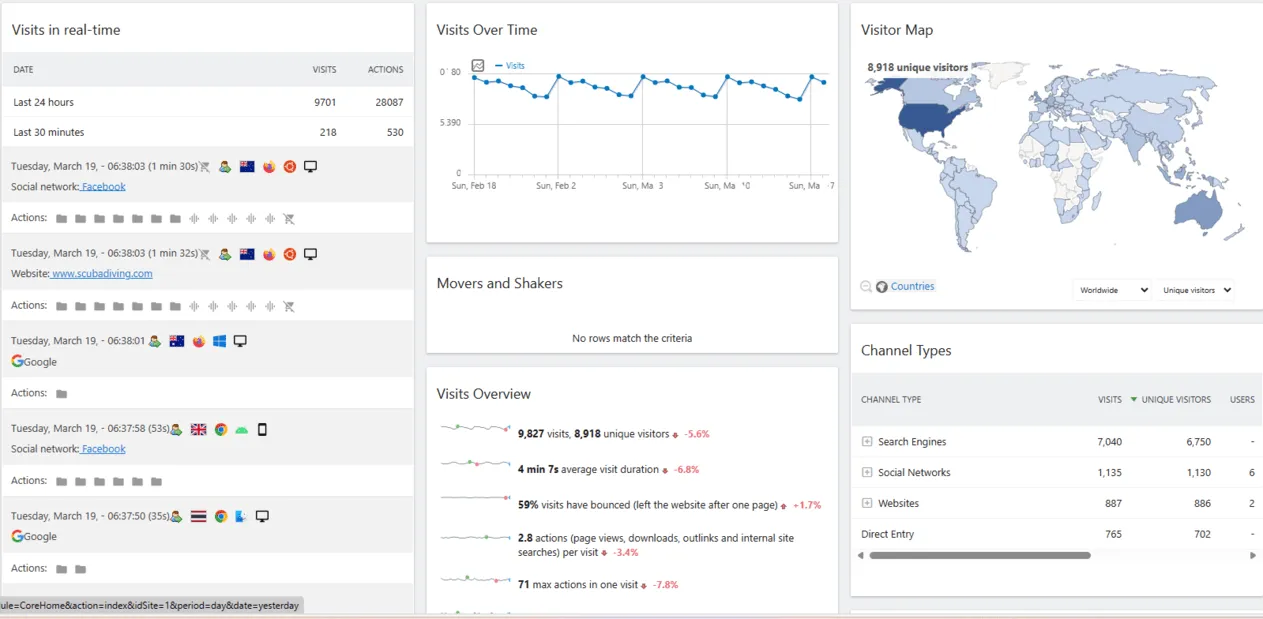
Matomo (formerly Piwik) is the open-source alternative, built around full data ownership and privacy. It removes sampling limits and gives more control. The self-hosted version needs technical upkeep, and the cloud version gets pricier as traffic scales. It suits teams that need control beyond basic tracking, which is a real consideration when weighing data analytics services for small business.
Features:
- Full data ownership and GDPR compliance
- No data sampling
- Customizable tracking and reporting
- Heatmaps and session recordings, limited on free plans
- Integration with popular CMS platforms such as WordPress
Pros:
- Privacy built in: GDPR compliance and full data ownership by default.
- No sampling: real-time tracking on complete data.
- Open and extensible: clean UI, easier to standardize than GA across plugins.
Cons:
- No native commerce links: not integrated with Shopify, Amazon, or PayPal.
- Technical setup: self-hosting needs server skills.
- Thin free tier: limited segmentation and advanced features without paying.
Who is it for: Privacy-conscious businesses and agencies that want control over their data, with some technical skill or budget for the cloud version.
Open Web Analytics (OWA)
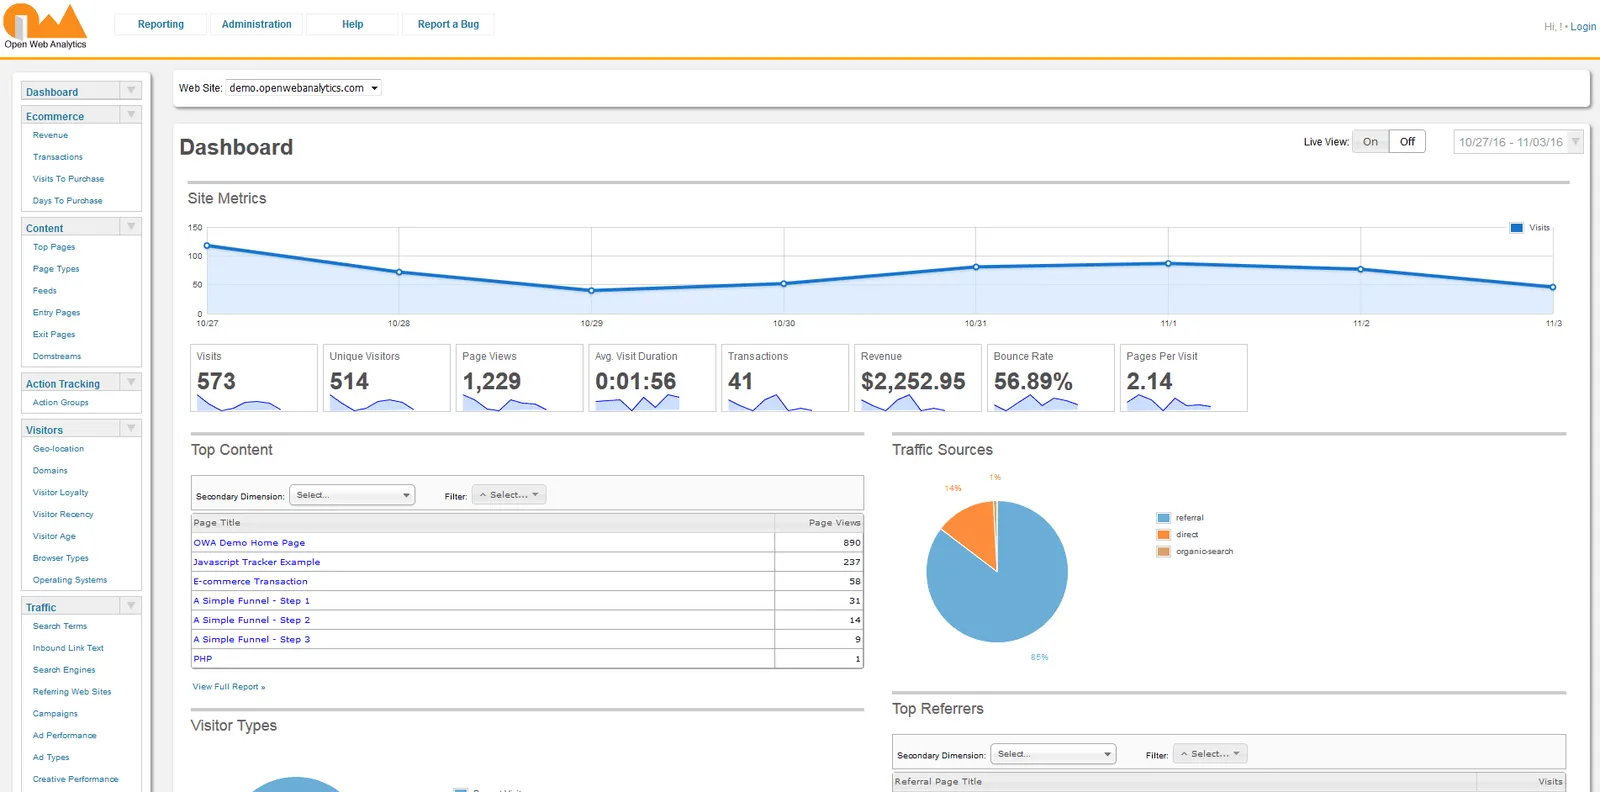
Open Web Analytics is a fully self-hosted free option that keeps all data in-house. It handles basic visitor tracking well. The interface feels dated next to modern tools, and it needs server knowledge once traffic grows past a few thousand monthly visitors. It is a workable choice for simple small business data analytics on a tight budget.
Features:
- Self-hosted with full data control
- Click-stream tracking and detailed visitor logs
- Customizable dashboards and reports
- Integration with WordPress and MediaWiki
- Support for multiple websites and campaigns
Pros:
- Free and open-source: no third-party data sharing.
- Self-hosted control: clickstream data, heatmaps, and session tracking included.
- Lightweight: fits small businesses with simple sites.
Cons:
- Dated interface: the user experience lags modern tools.
- Limited integrations: no eCommerce tracking or funnel views.
- No predictive or segmentation features: no forecasting, no identity resolution.
Who is it for: Developers or small businesses that want basic analytics without giving up data ownership, and can handle the technical maintenance.
Why free analytics tools eventually fall short
Free tools are valuable starting points. They also share three limits that catch up with a growing business.
- Limited scope: they track website behavior, not the whole business. A store selling across its own site, Amazon, and Etsy sees only a fragment in each tool.
- Technical burden: proper configuration, event tracking, and updates take ongoing effort, which busy owners rarely have.
- Data without answers: free tools hand over numbers and charts. Turning those into decisions is left entirely to the owner.
The pattern is clear. Free tools answer “what happened on my website.” A growing business needs to answer “what is happening across my entire business, and what should I do about it.” That is a different tool category, and it is built for owners rather than data analysts.
How Putler makes analytics for small business simple
Putler is a multichannel analytics tool that connects Shopify, WooCommerce, Amazon, and the payment gateways behind them into one unified view. It removes the need to switch between native dashboards, because all the business data lives in one place.
Setup is plug and play and takes a few minutes. Putler offers 200+ business metrics, but five features do most of the heavy lifting for a small business owner.
RFM segmentation
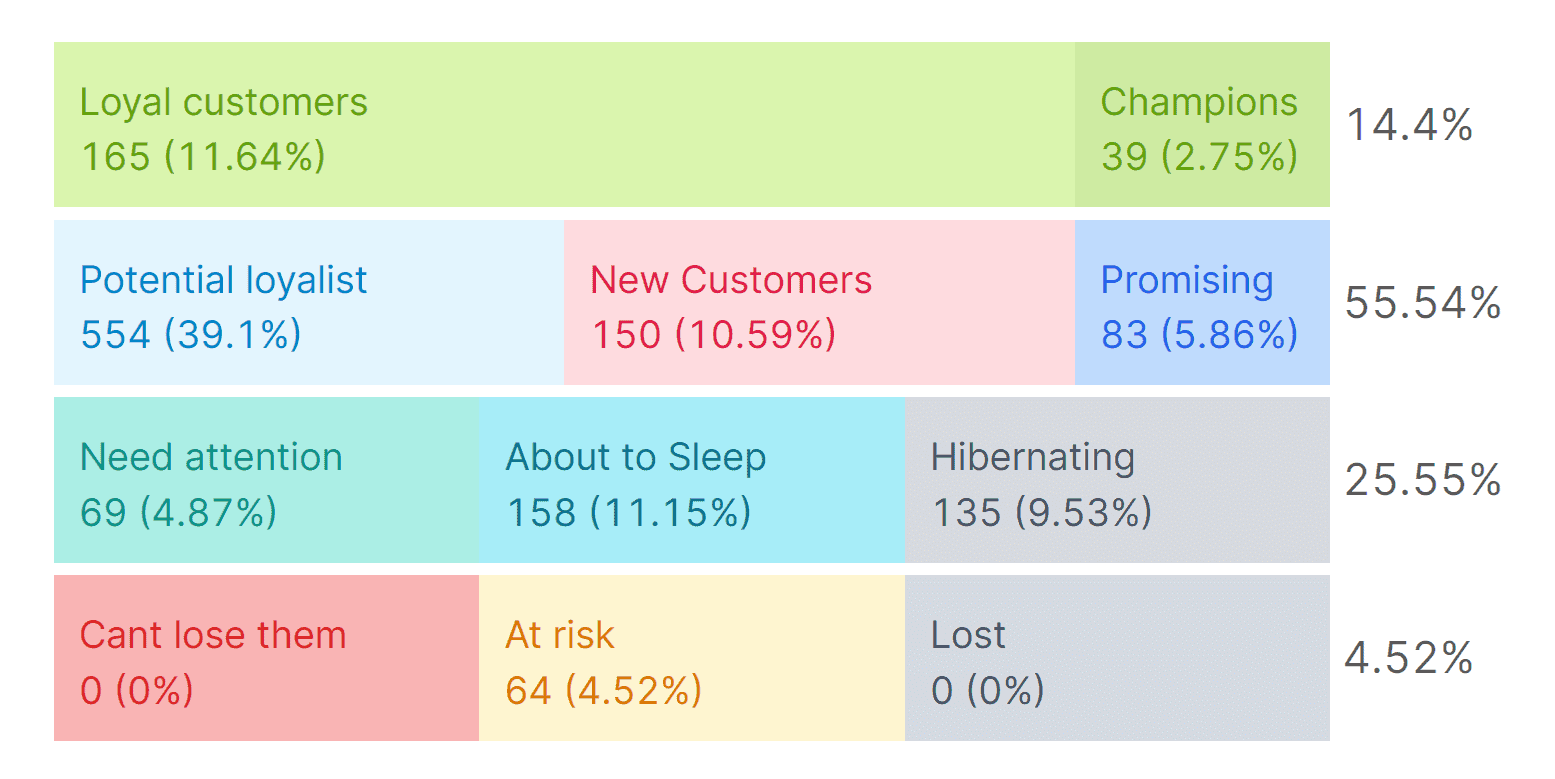
What it does: identifies champions, the customers who spend most and buy often, and flags those slipping away. One click on RFM segmentation separates loyal customers from at-risk ones, which makes win-back campaigns possible before a customer is gone for good. The segments update as behavior changes, so the list stays current on its own.
Top sellers analysis
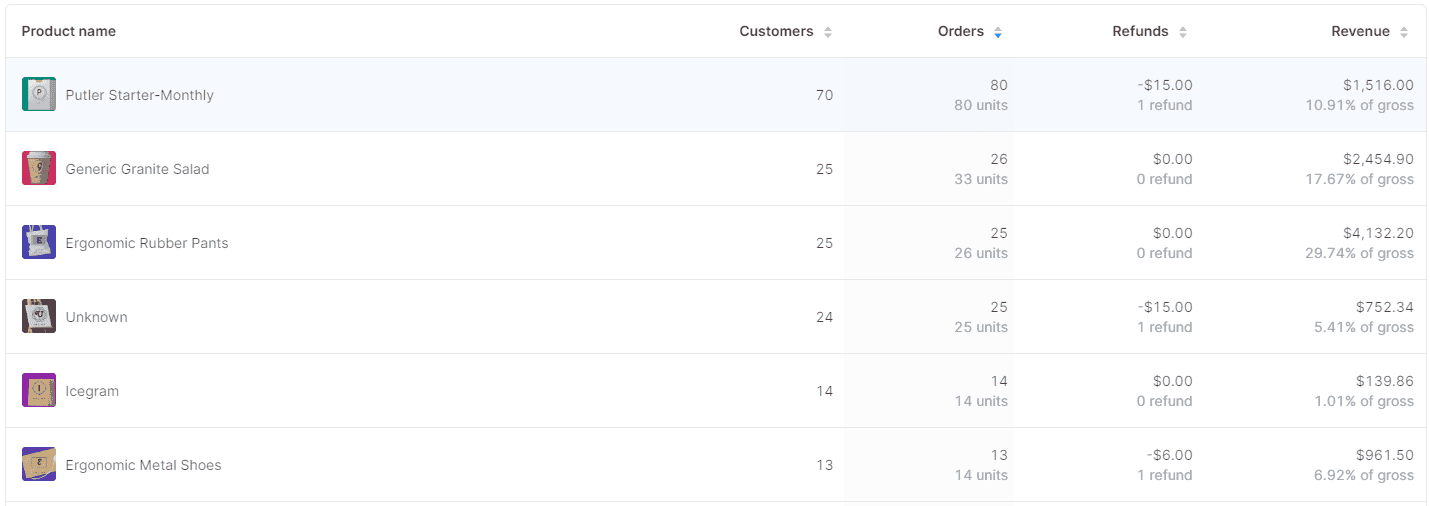
What it does: highlights the 20% of products generating 80% of revenue. Sorting by orders or revenue shows which products deserve more budget and attention, which is the fastest way to double down on what already works rather than guess.
Cross-selling opportunities
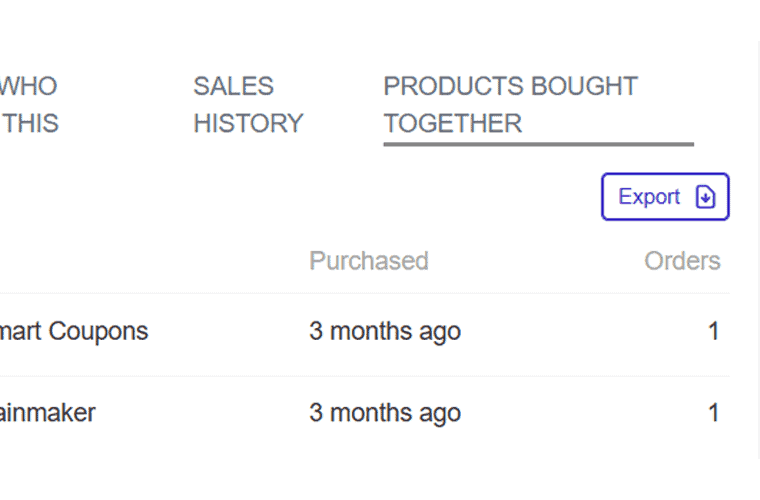
What it does: reveals which products customers buy together. The frequently bought together view turns into product bundles with sensible discounts, which lifts average order value without any guesswork.
Customer segmentation
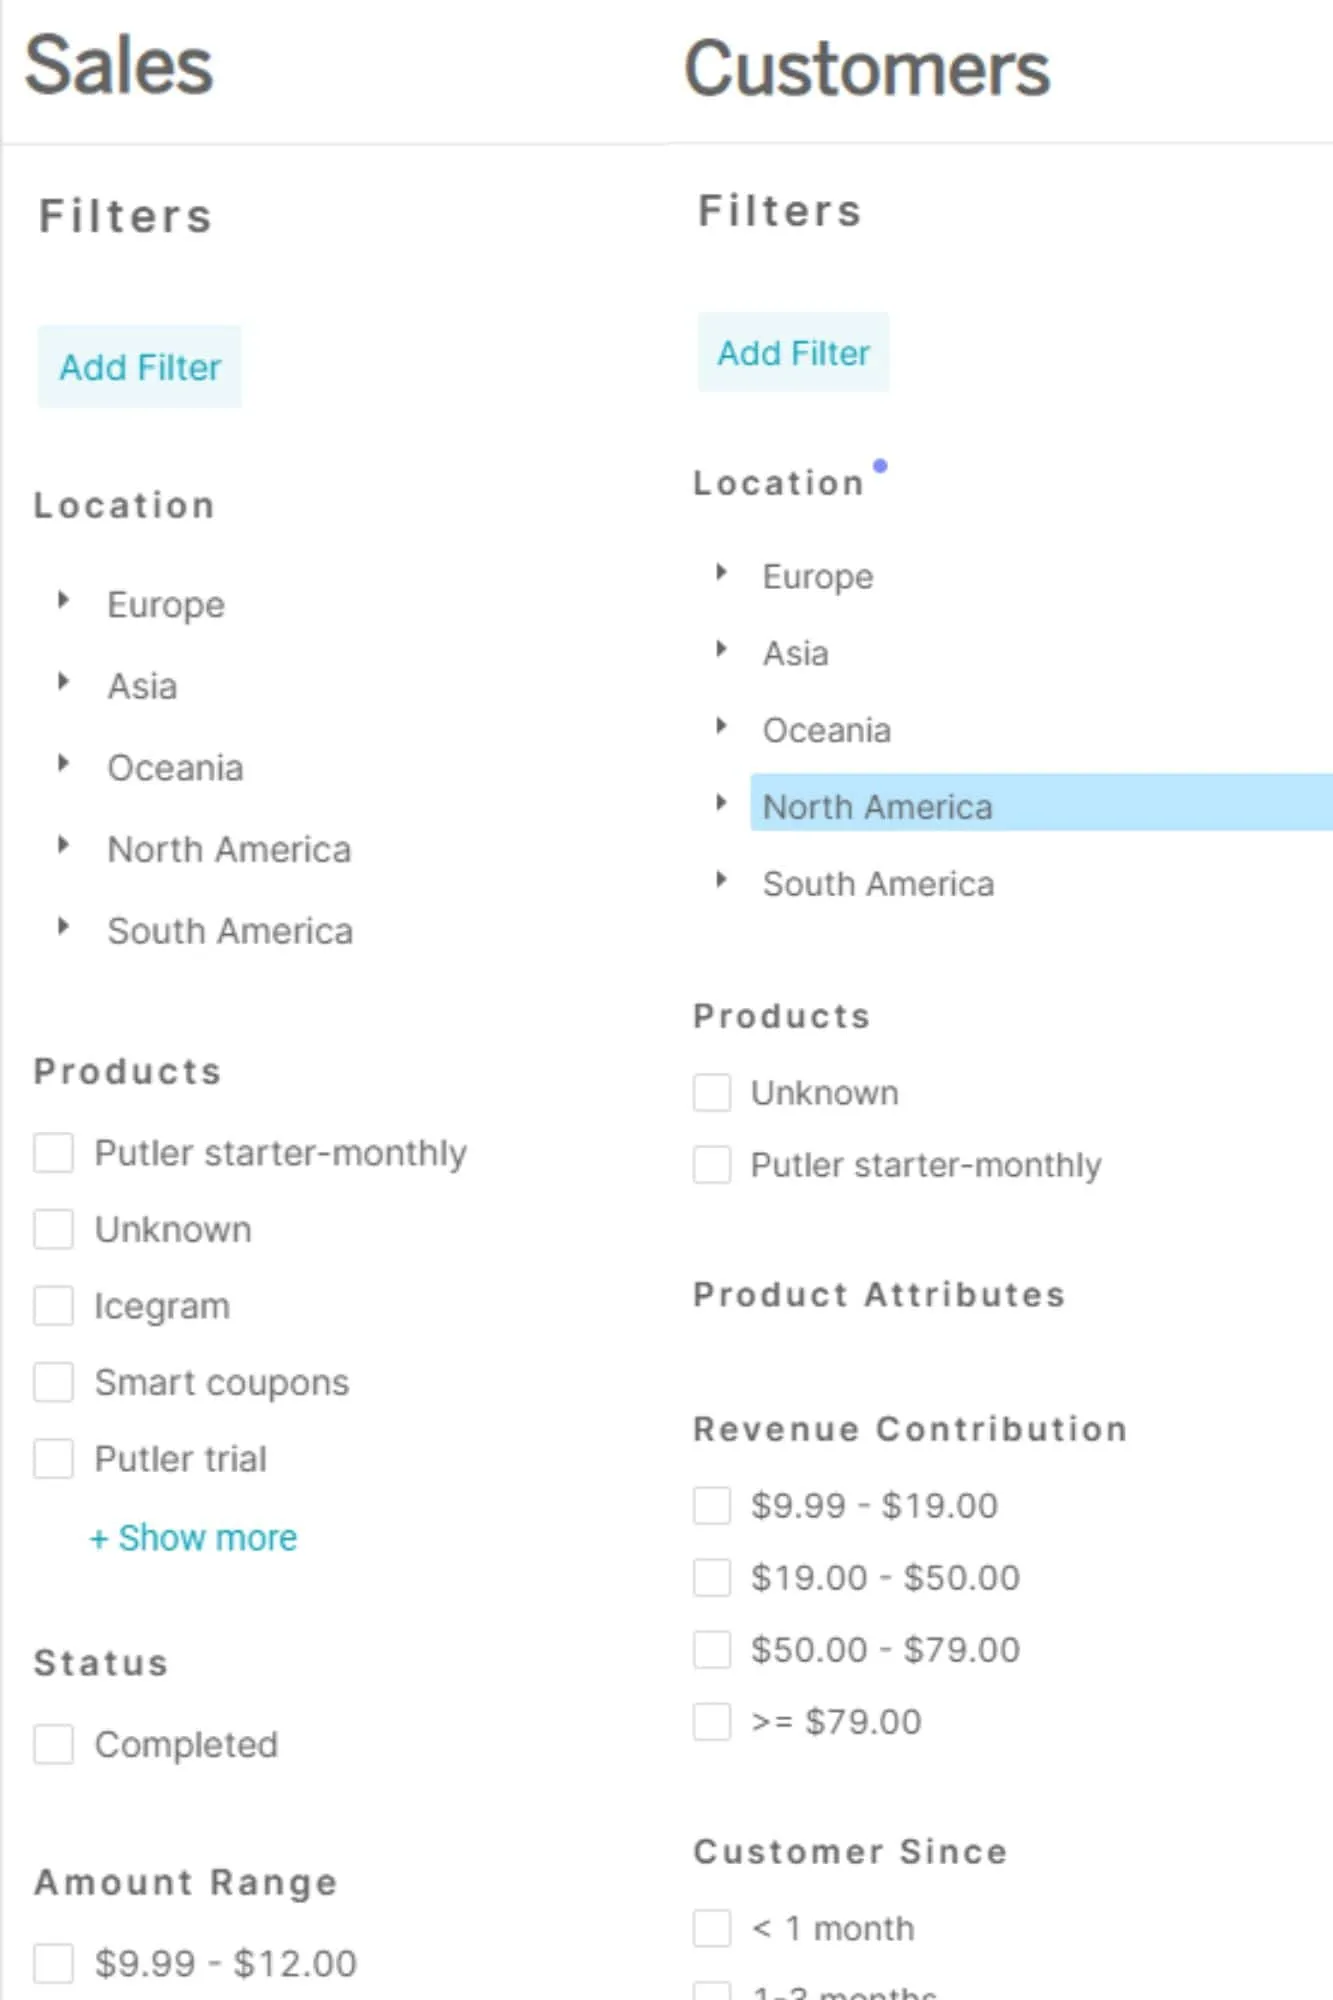
What it does: builds targeted lists from any combination of built-in filters. Pulling a list of European customers who spent over $100 last month takes two clicks, which is exactly the input a geo-targeted campaign needs.
Multiple integrations
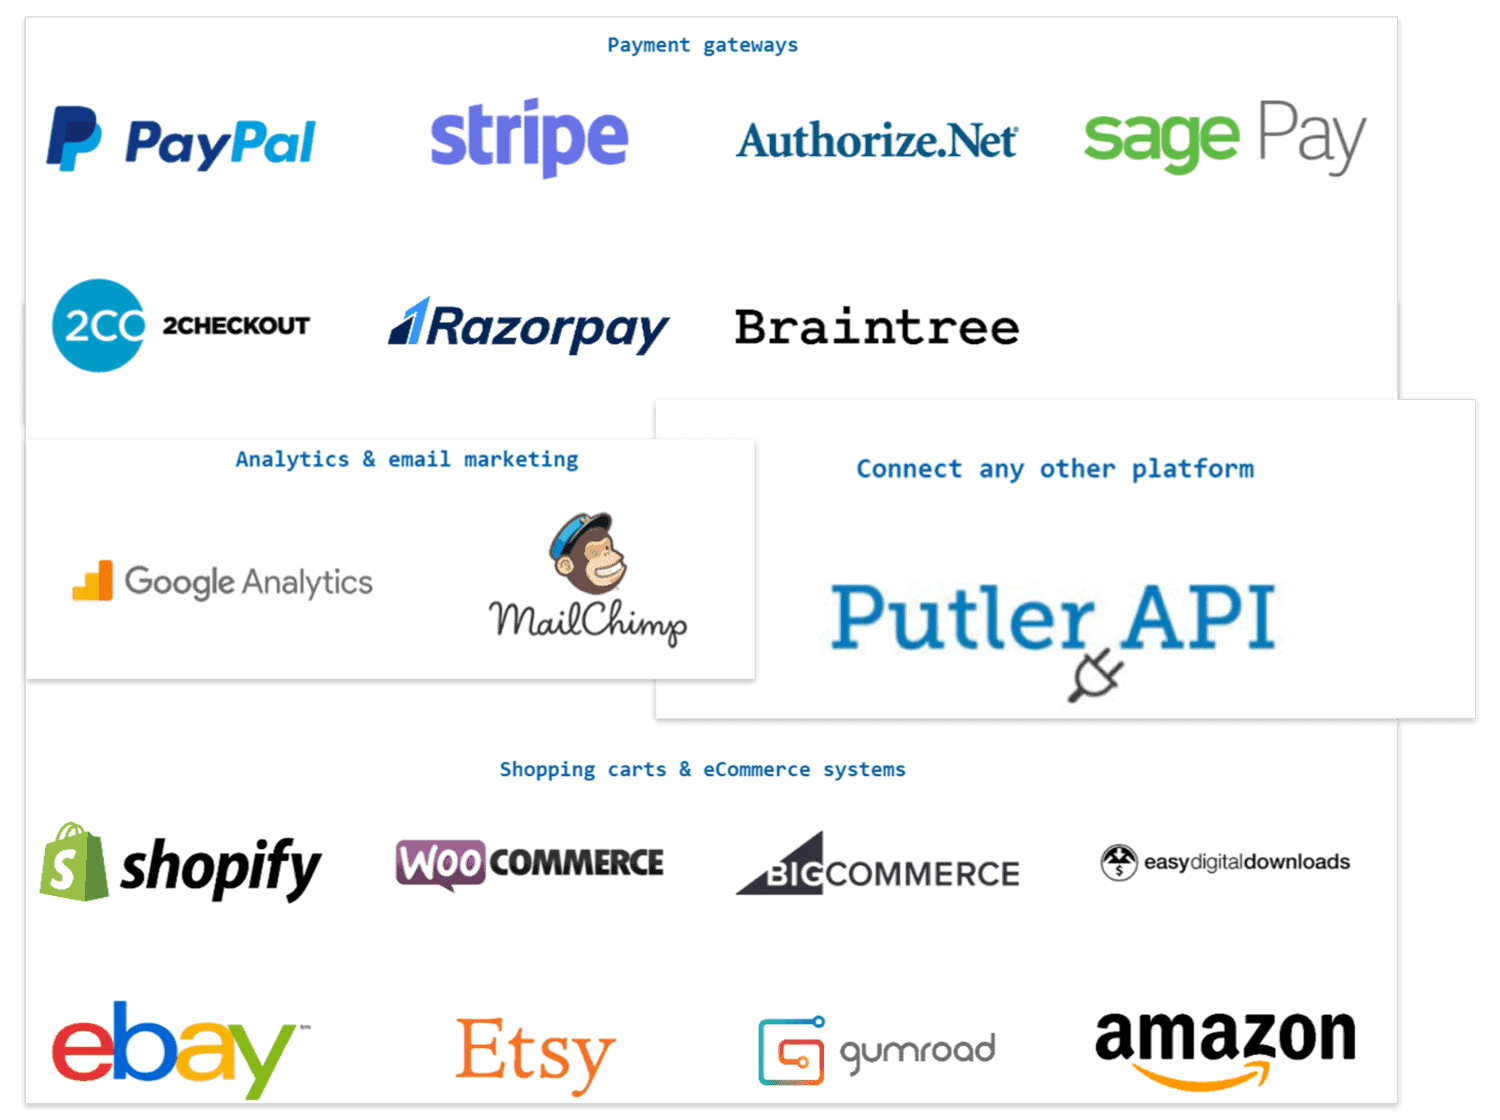
What it does: brings data from every sales channel, payment processor, and marketing tool together. Connecting 17+ platforms shows whole-business performance in one place, and Putler deduplicates transactions that appear across systems, so a PayPal-on-Shopify sale counts once, not twice.
Who is it for: eCommerce and small businesses selling across multiple platforms that want clear, comprehensive analytics without the technical hassle. It is built for the owner who needs answers, not another dashboard to manage.
How to choose the right analytics tool for your small business?
When evaluating analytics software, consider:
- Data sources you need to connect.
- Ease of use.
- Reporting capabilities.
- Customer analytics features.
- Forecasting capabilities.
- Budget and scalability.
How to get started with small business analytics
The goal was never more data. It is the right data, tied to decisions, in one place. A small business that tracks what matters and ignores the rest makes sharper calls than a competitor buried in dashboards.
FAQs
Do I need technical skills to use Putler?
No. Putler is built for busy business owners. The dashboard needs no coding knowledge or technical setup.
What integrations does Putler support?
Putler integrates with PayPal, Stripe, Razorpay, Shopify, WooCommerce, Etsy, Amazon, and more. It also works with Google Analytics and offers an API for custom integrations.
How is it different from Google Analytics or Looker?
Google Analytics is complex and website-only. Looker is built for large companies. Putler is built for small businesses, with simple, clear reports that drive decisions.
Does it work for SaaS and eCommerce businesses?
Yes. SaaS businesses get MRR and churn dashboards. eCommerce businesses get product and customer analytics. Each gets tailored views.
What analytics should a small business track?
Small businesses should focus on metrics that directly impact growth and profitability. The most important ones include revenue, profit margin, average order value (AOV), customer acquisition cost (CAC), customer lifetime value (CLV), conversion rate, retention rate, and traffic sources. Instead of tracking dozens of metrics, concentrate on the numbers that help you make better business decisions.
What is the best analytics tool for a small business?
The best analytics tool depends on your business needs. Google Analytics is a popular choice for tracking website traffic and visitor behavior. For businesses that need deeper insights into sales, customers, products, and multiple sales channels, tools like Putler provide a more complete view by combining data from ecommerce platforms, marketplaces, and payment gateways into a single dashboard.
Can small businesses use analytics for free?
Yes. Many analytics tools offer free plans or free versions. Google Analytics, Looker Studio, and Open Web Analytics are popular free options for tracking website performance and generating reports. However, as a business grows and starts selling across multiple channels, it may need a more advanced solution that provides customer analytics, sales analytics, forecasting, and unified reporting.