
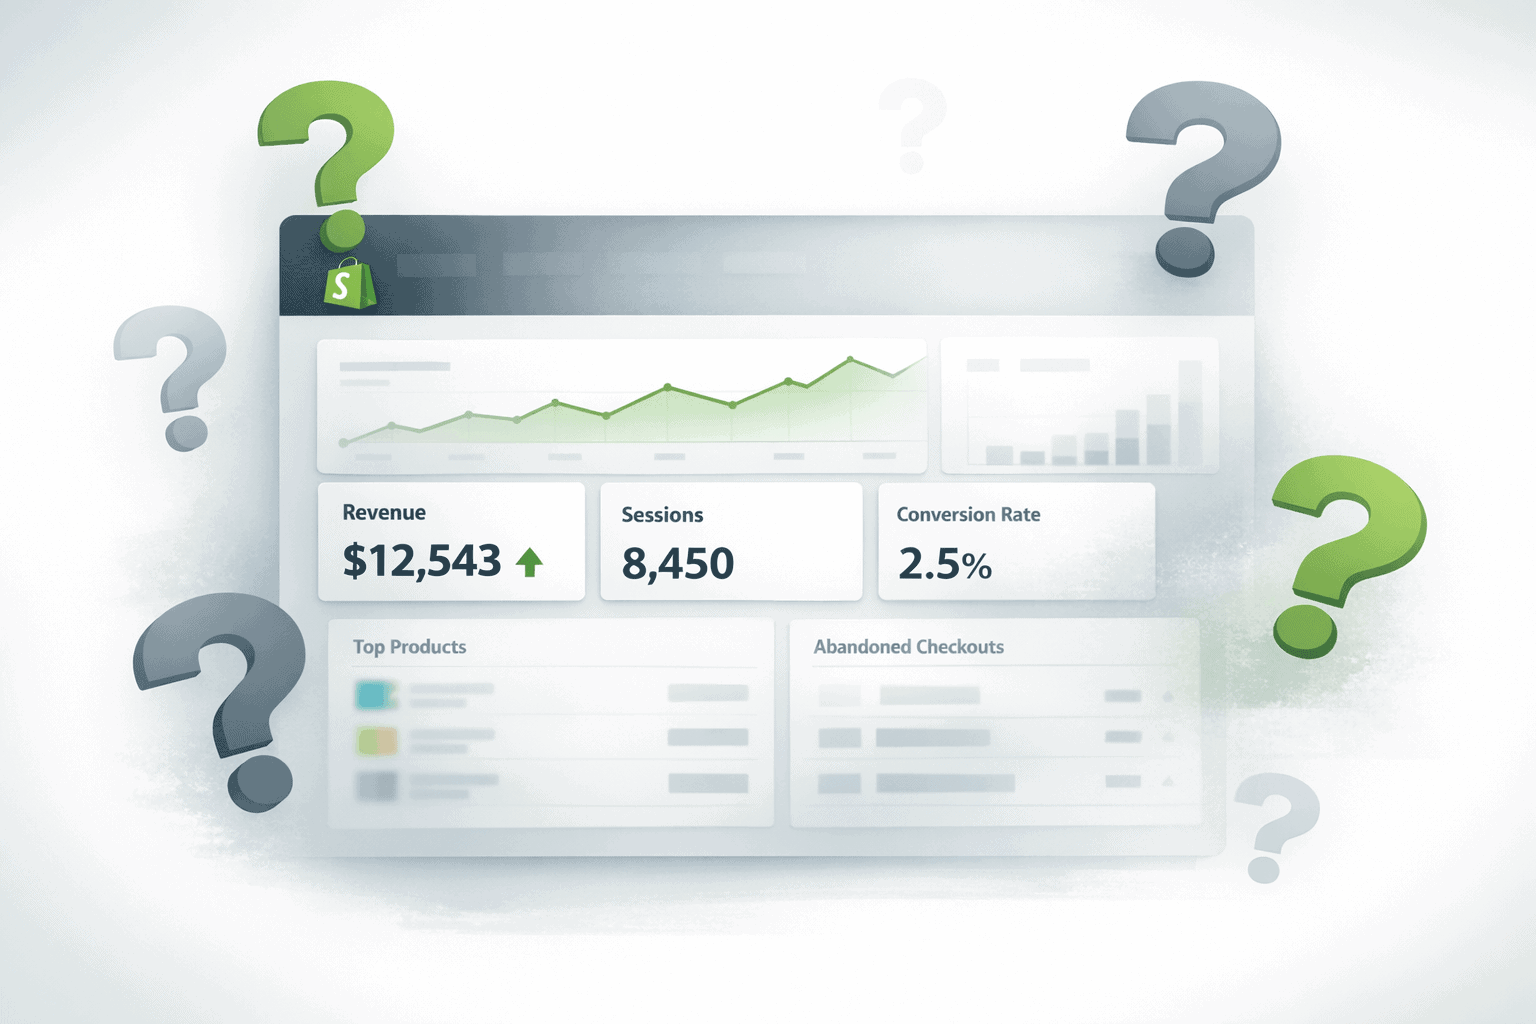
Shopify’s analytics look complete at first glance. Revenue, sessions, conversion rate, top products. It all seems like everything you need.
But the moment you start asking harder questions, the dashboard goes quiet. Which channel actually drove that sale? Which customers are worth winning back? Are you actually profitable after ad spend and product costs? How many people dropped off at checkout and why?
These are not edge case questions. They are the questions every growing store needs to answer. And Shopify analytics limitations make most of them impossible to answer from inside the platform alone.
This article covers every significant gap, what the 2025 updates did and did not fix, and the most practical ways to fill what Shopify leaves out.
What Shopify analytics actually gives you
Before getting into what Shopify analytics cannot do, it helps to understand what it actually offers. Because it is genuinely useful for a lot of things.
The Overview Dashboard shows your core store metrics at a glance: total sales, net sales, online store sessions, conversion rate, average order value, and returning customer rate.
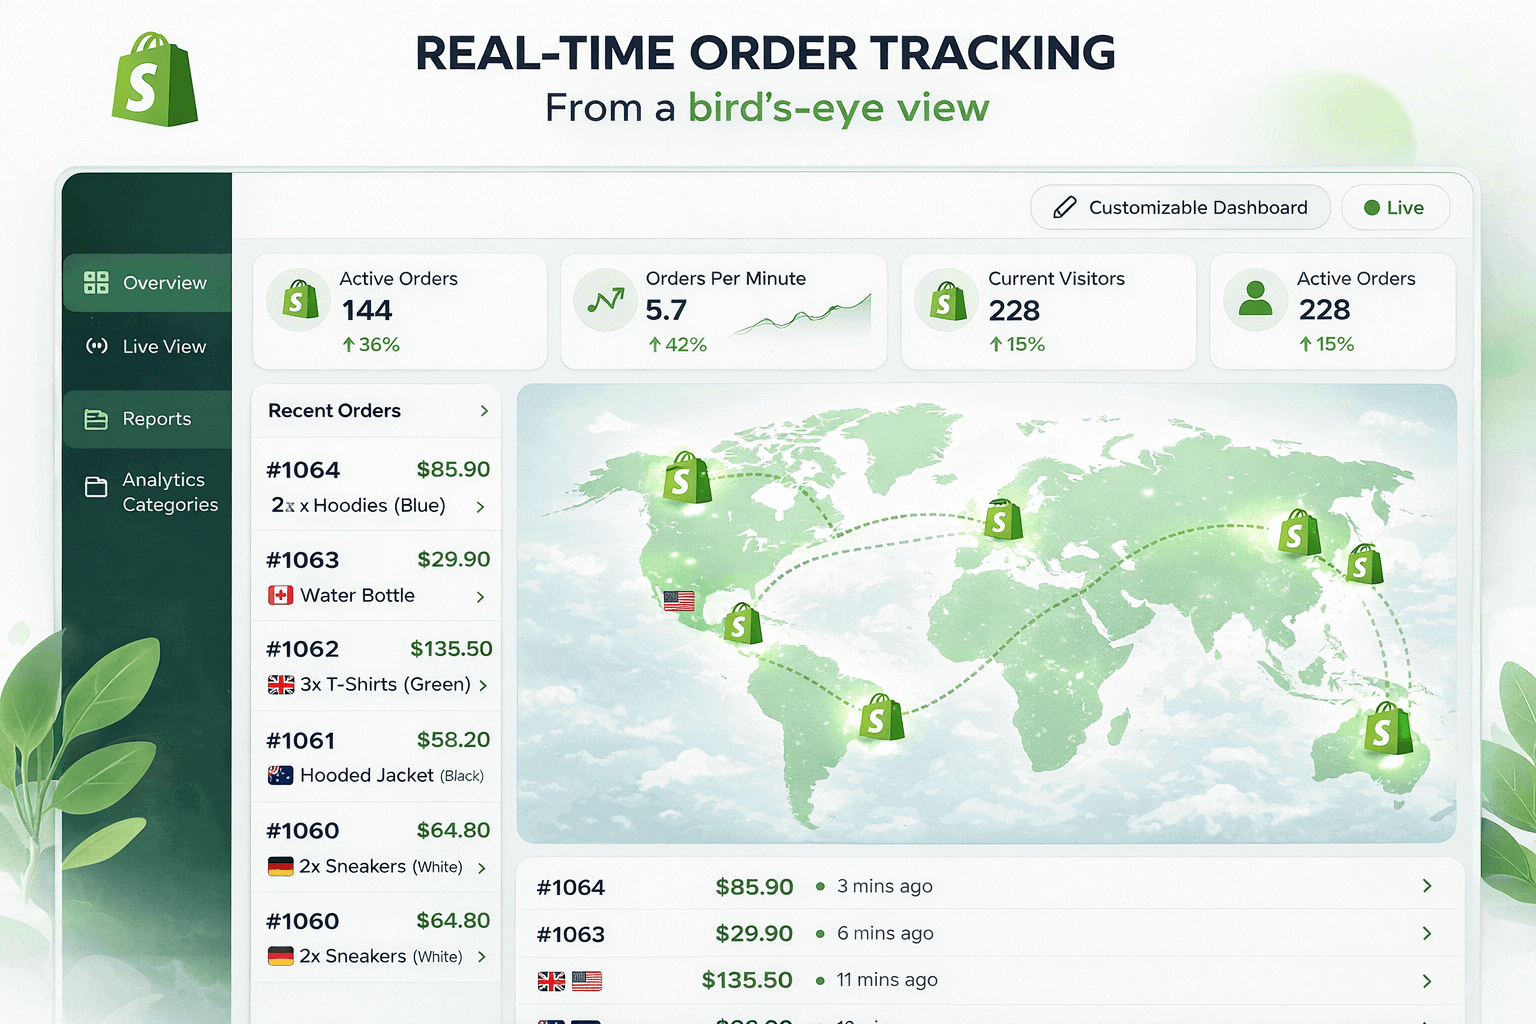
Since the Winter 2025 update, these metric cards are fully customizable. You can add, remove, resize, and reorder them to match what you check most often. Metrics refresh in near real time, which makes the dashboard genuinely useful during a product launch or flash sale.
Live View shows a real-time world map of active visitors, current session counts, and a basic purchase funnel from visitors through to completed purchases. It is the closest thing to watching your store floor in real time.
Reports are organized across 11 categories: Acquisition, Behavior, Customers, Finance, Inventory, Marketing, Orders, Profit, Sales, and more.
For a new store or a store in its early stages, this is a solid foundation. You can track what is selling, monitor your conversion rate, check inventory health, and get a basic picture of where customers are coming from.
The problem is that this foundation has a hard ceiling. And most growing stores hit it faster than they expect.
The plan paywall that makes it worse
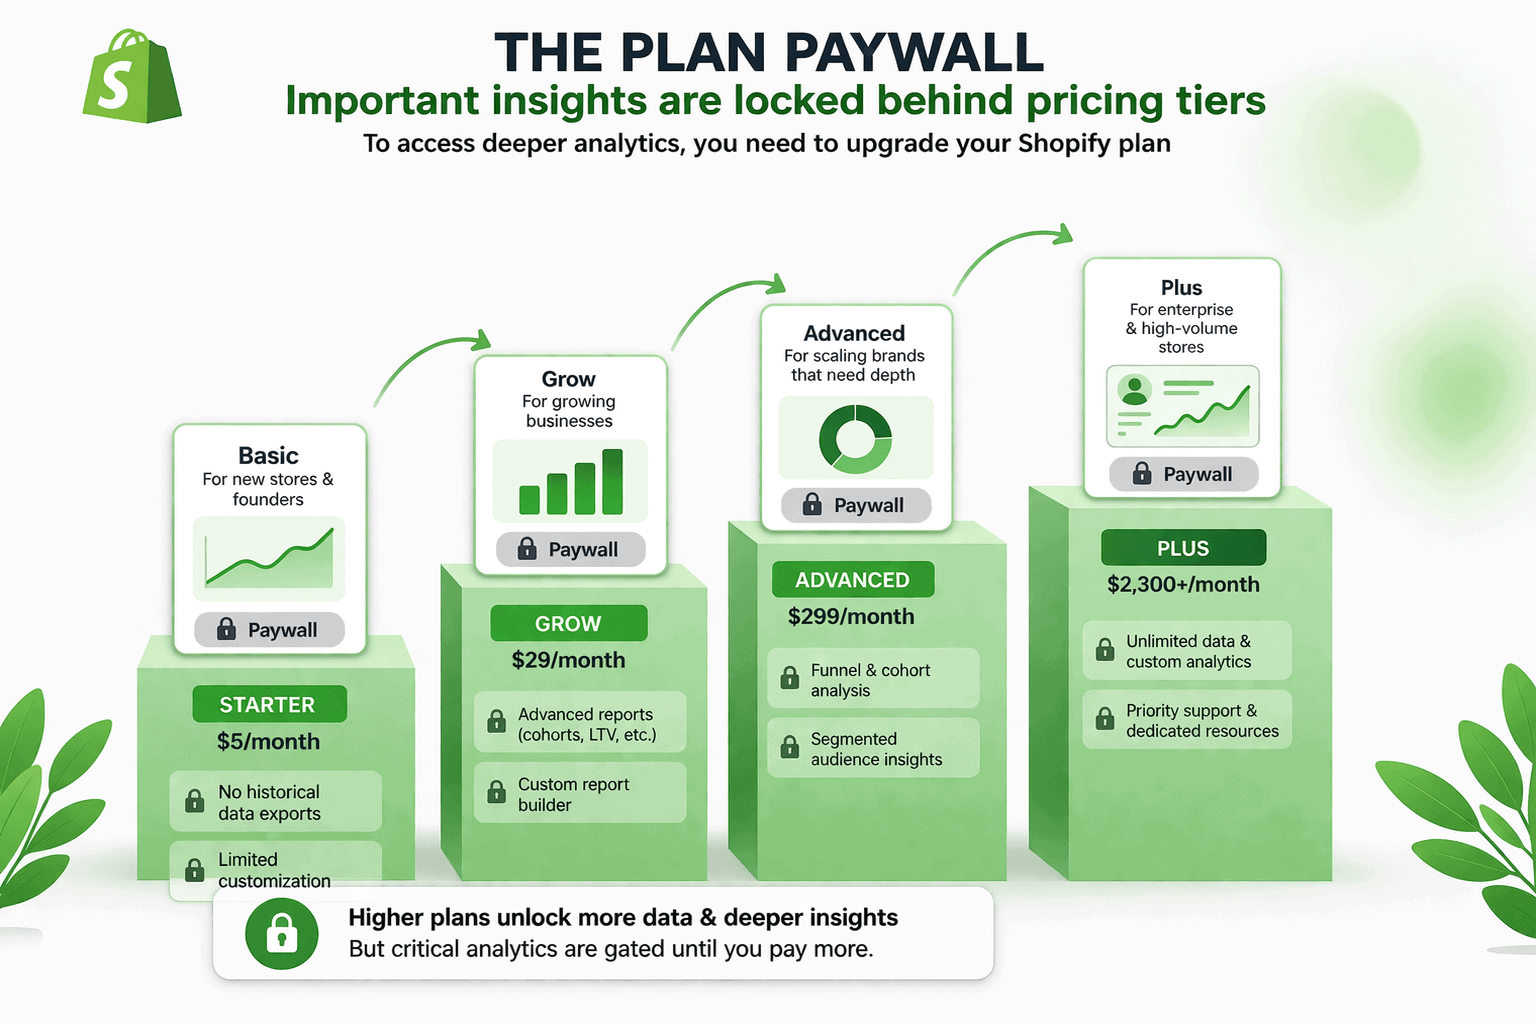
One of the most frustrating Shopify analytics limitations has nothing to do with what the platform can or cannot track. It is about what Shopify decides to hide from you unless you pay more.
Basic plan ($39/month): Dashboard, Live View, finance reports, product analytics, and basic acquisition reports. Sales reports, full customer reports, order reports, inventory reports, and profit reports are all unavailable. Custom report creation does not exist at this tier.
Grow plan ($105/month): Most standard reports unlock here. But custom reports, profit reports, and advanced customer segments are still gated.
Advanced plan ($399/month): Custom report creation, profit reports, ShopifyQL querying, and scheduled automated exports finally become available. This is where Shopify analytics actually becomes useful for serious analysis.
Shopify Plus ($2,300+/month): ShopifyQL Notebooks and full API access for enterprise-level reporting.
The gap between Basic and Advanced is $4,320 per year. A meaningful portion of that premium is simply paying to access analytics that should arguably be available to every store owner from day one.
And even after paying for Advanced, universal restrictions apply across every plan. Reports display a maximum of 1,000 rows in the admin. Exports are capped at 10,000 rows per report. Historical session data only extends back to October 2022.
Shopify analytics limitations that hurt growing stores
Attribution is last-click only

Shopify gives 100% of the conversion credit to the last touchpoint before purchase.
A customer who discovered your store through a YouTube ad, got retargeted on Instagram, opened an email, and then typed your URL directly ends up attributed to Direct. The YouTube ad, the Instagram retargeting, and the email all get zero credit.
The modern customer journey spans five to eight touchpoints before a purchase. Shopify sees only the last one. Every marketing decision made on this data is built on an incomplete picture.
Traffic source data you can’t trust
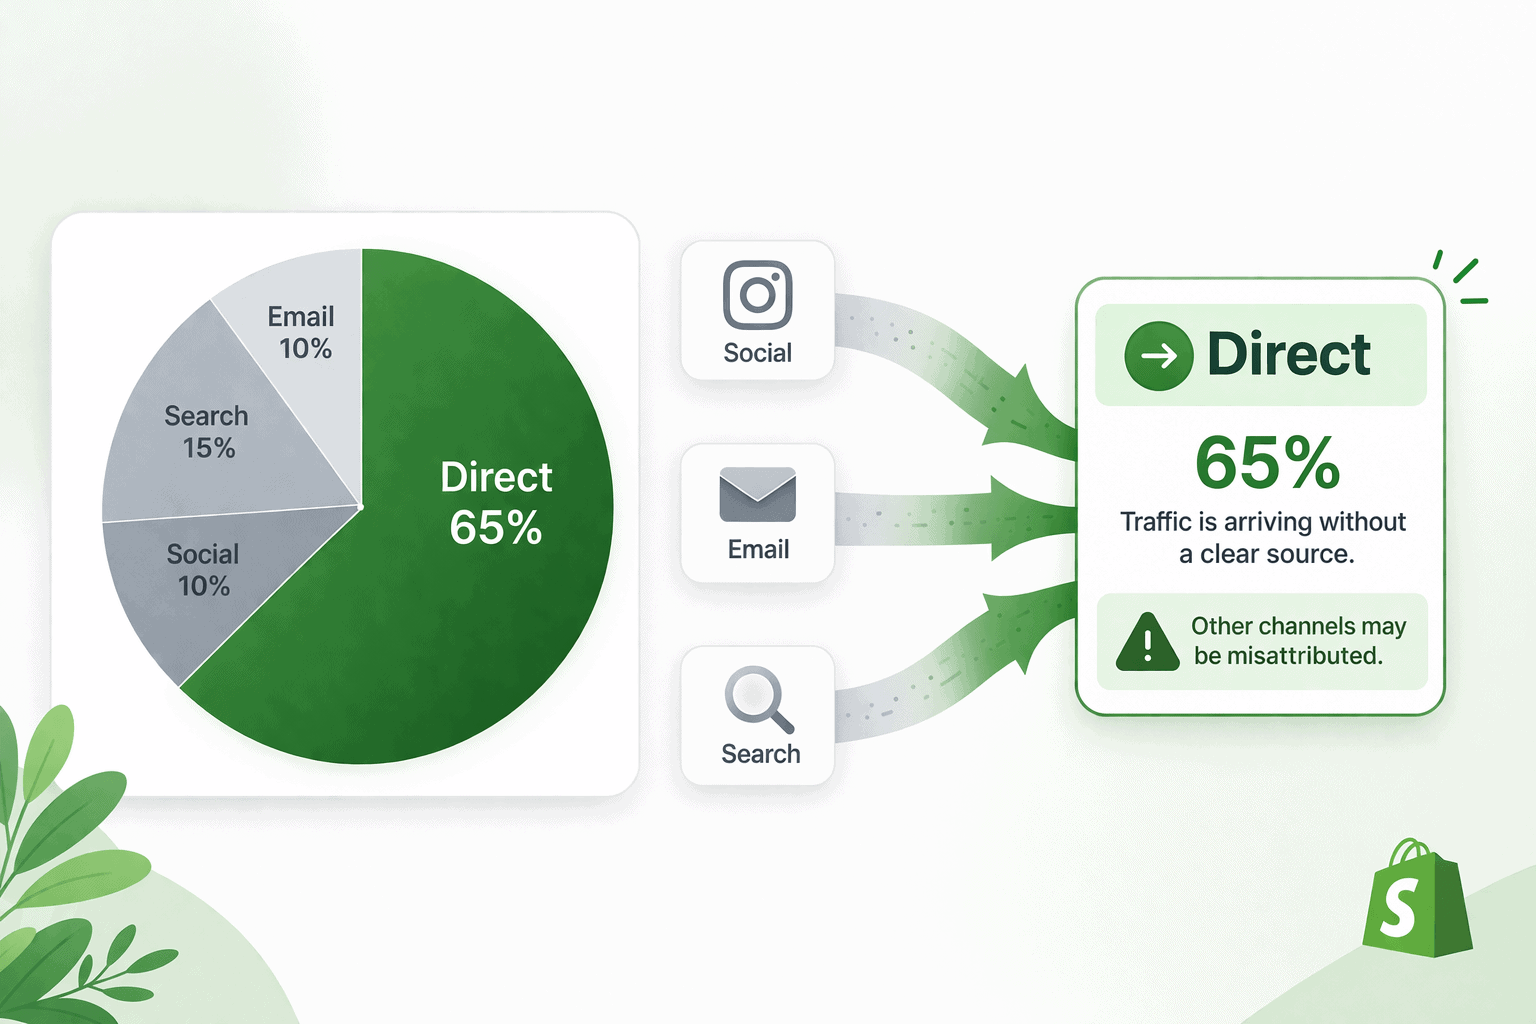
Up to 40% of Shopify traffic shows as Direct when it actually came from identifiable marketing channels.
Missing UTM parameters, third-party checkout apps breaking session continuity, iOS privacy restrictions, and JavaScript redirects in cart widgets all contribute to artificially inflating direct traffic.
A Littledata study across 180,000 orders found Shopify’s Sessions by Traffic Source report offered only 1% visibility on actual marketing performance. That is not a useful number to base budget decisions on.
No cross-channel reporting
Shopify only sees Shopify. If you also sell on Amazon, Etsy, eBay, or any other platform, each one lives in its own silo. There is no consolidated view of your total business performance across channels.
There is also no integration with ad platform spend data. You cannot calculate true ROAS from inside Shopify because it has no idea what you spent on Google Ads or Meta to generate those sales.
No customer lifetime value

Shopify shows you order counts per customer. It does not calculate customer lifetime value, segment customers by value tiers, or connect CLV to the channels that acquired them.
Without CLV data, you cannot tell whether your customer acquisition costs are sustainable.
No funnel or checkout drop-off analysis

Shopify shows your overall conversion rate. It cannot show you where in the journey people are dropping off or why.
There is no custom funnel visualization, no checkout step analysis, and no way to see which landing pages convert best versus which ones leak traffic. You know your store converts at 2.8%. You cannot diagnose why it is not 3.5%.
No profit reporting without manual COGS entry
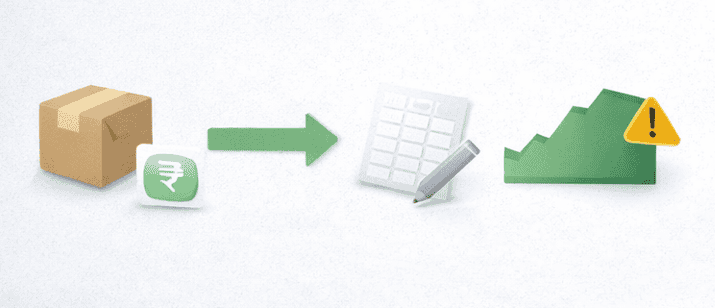
Shopify can show profit reports but only if you manually enter the cost of goods for every product and variant. And even then, the COGS field is static.
It does not update when supplier prices change, which means your profit reports silently become inaccurate every time your costs shift.
No content or blog analytics

If your Shopify store has a blog, Shopify cannot tell you which posts drive traffic, how long people read them, or whether your content is contributing to conversions.
For any store investing in content marketing or SEO, this makes an external tool not optional but essential.
No cross-device tracking
A customer who browses on mobile and buys on desktop appears as two completely separate sessions in Shopify. The mobile session shows no conversion.
The desktop session shows no prior engagement. You cannot see the full journey, and you cannot accurately measure mobile’s contribution to revenue.
No predictive analytics

Shopify reports are entirely backward-looking. There is no revenue forecasting, no churn prediction, no demand modeling, and no purchase intent scoring.
You can see what happened last month. You cannot see what is likely to happen next month or which customers are about to stop buying from you.
No alerts or anomaly detection

Shopify does not notify you when something unusual happens. No alert when your conversion rate drops 30% overnight. No notification when a product suddenly spikes in refund rate.
No warning when your sessions drop sharply on a Tuesday with no obvious cause. You find out only when you happen to open the dashboard and notice something looks wrong.
Live View has no memory

Live View shows what is happening in your store right now. The moment you close it, that data is gone.
There is no historical storage of Live View sessions, no ability to compare today’s live activity to last Friday’s, and no filtering by traffic source or product.
It is useful for watching a launch in real time. It is useless for anything that requires looking back even for one hour.
Deleting an order permanently erases its data

If you delete an order in Shopify, its data is removed from your reports immediately and cannot be recovered.
There is no archive, no soft delete, and no way to exclude an order from fulfillment without losing its analytics contribution.
No ROAS calculation from ad platform data
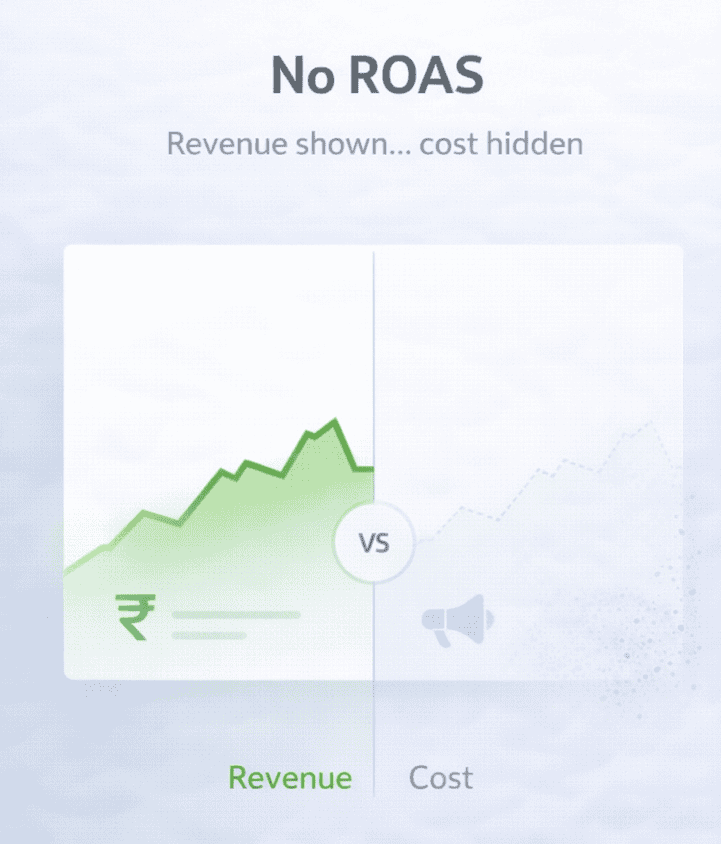
Shopify has no native integration with Google Ads, Meta, TikTok, or any other paid platform for spend data.
Merchants managing meaningful budgets are forced to manually pull spend data from each platform and correlate it against Shopify revenue in a spreadsheet, every single time they want to know whether their campaigns are profitable.
Session counts are structurally inflated
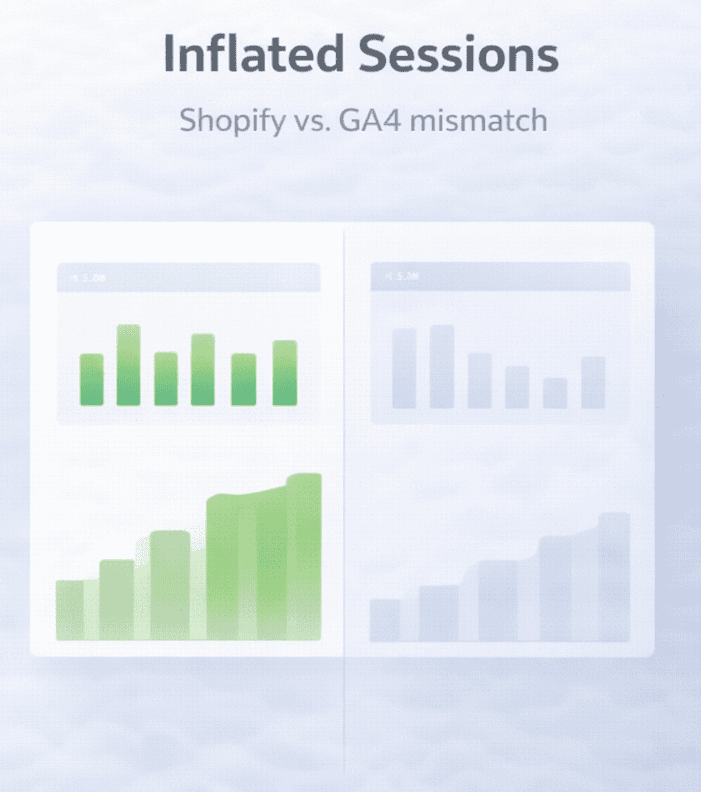
Shopify’s session count runs 40 to 60% higher than GA4 for the same store and the same period.
This happens because Shopify counts server-side events like add to cart and checkout steps as new sessions, inflating the denominator in your conversion rate calculation.
The result is that your Shopify conversion rate looks lower than it actually is.
Did the 2025 updates fix any of this?
Shopify’s 2025 and 2026 analytics updates were the most significant in the platform’s history. It is worth being honest about what actually improved and what structural gaps remain untouched.
What genuinely got better
The fully customizable dashboard is a real improvement. The Winter 2025 RFM customer report is a meaningful addition, you can now see your Champions, Loyal Customers, At Risk, and Hibernating segments directly inside Shopify.
Natural language report creation via Sidekick AI lets you ask questions in plain English and get ShopifyQL queries generated automatically. The Winter 2026 update added heatmap visualizations, minute-level event monitoring during launches, improved bot filtering, and multi-store analytics.
What did not change
Attribution is still last-click only. There is still no cross-channel reporting. CLV is still not automatically calculated or connected to acquisition channels.
Plan gating is still in place. There is still no ad platform spend integration, no ROAS calculation, and no predictive analytics beyond basic trend lines.
The 2025 updates made Shopify analytics more usable. They did not make it complete.
Workarounds that help
Add GA4 for traffic and behavioral intelligence: Google Analytics 4 is free and fills Shopify’s biggest visibility gaps. It adds accurate traffic source attribution, checkout funnel drop-off analysis, cross-device tracking, bounce rate and engagement metrics, and data-driven multi-touch attribution.
Connect it through the free Google and YouTube Channel app. Just keep in mind that GA4 typically shows 10 to 20% fewer conversions than Shopify due to ad blockers and cookie consent rejections. Use Shopify as your revenue source of truth and GA4 for behavioral intelligence.
Maximise Shopify’s built-in filters and Sidekick AI: Most store owners use a fraction of what Shopify’s reports already offer. You can stack multiple filters simultaneously, compare any two date periods side by side, and sort every report table by any column.
The new Sidekick AI natural language querying lets you ask questions without touching ShopifyQL syntax.
Use CSV exports for manual profit analysis: Export your monthly orders from Shopify, add a COGS column for each product, and pull your actual ad spend from Google Ads and Meta.
A basic spreadsheet gives you gross profit per order and true marketing ROI per channel. It is time-consuming but it is the only free way to see profit visibility until you adopt a dedicated tool.
The honest limit of these workarounds: even with GA4 plus optimised Shopify usage, you still have no multi-store consolidation, no automatic CLV calculation, no ad platform spend integration, and no relief from the hours spent manually correlating data across platforms every week.
When you need more than workarounds
GA4 fills the traffic gaps. Better Shopify filters help at the margins. But if you are selling across multiple channels, running paid campaigns, and still spending hours every week assembling data that should already be in one place, workarounds stop being a solution and start being the problem.
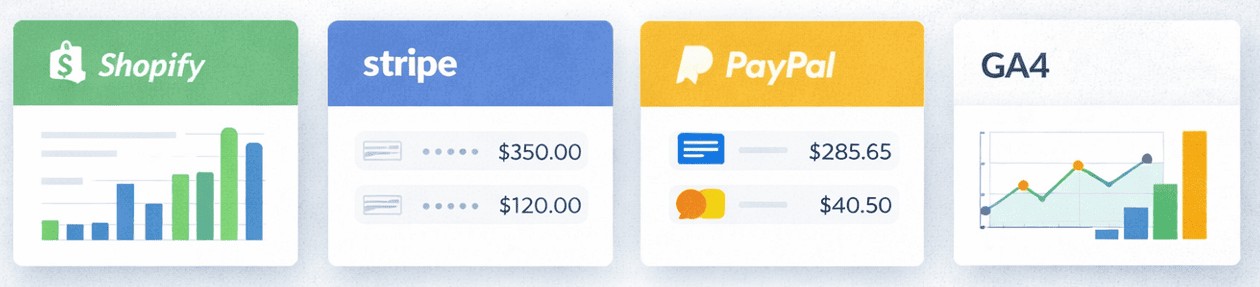
Putler solves this at the foundation. It connects to your Shopify store and your payment gateways as completely separate data sources, then automatically consolidates, deduplicates, and cleans everything into one accurate revenue number.
The same transaction appearing in both Shopify and Stripe gets counted once. Currencies get converted using actual daily exchange rates across 36 supported currencies. Time zones normalize automatically.
Here is what Putler adds on top of that clean data foundation:
Customer lifetime value and RFM segmentation: Putler automatically calculates CLV across every connected platform and scores your entire customer base into 11 behavioral groups. Unified customer profiles combine purchase history across every channel.
Sales heatmap: A color-coded grid showing your actual peak selling hours and days across the full week. The sales heatmap stops you from scheduling campaigns on instinct and starts you making timing decisions based on real revenue patterns.
Product intelligence across all channels: Product analysis shows which products drive revenue across every platform combined, not just Shopify. It also surfaces which products are frequently bought together, giving you real cross-sell opportunities based on actual purchase behavior.
Transaction management in one place: Every sale, refund, and dispute from every payment processor in one unified feed. You can also process refunds directly from Putler without logging into your gateway separately.
Traffic connected to real revenue: Putler’s eCommerce web analytics layer connects your GA traffic data to actual transaction data. You see which pages, sources, and keywords generate real sales, not just visits.
One dashboard for everything: The eCommerce dashboard shows revenue, top customers, top products, forecasts, and live activity the moment you log in.
Putler starts at $20 per month for stores with up to $10,000 in monthly revenue. For any Shopify store that has hit the analytics ceiling and is tired of paying $399 per month just to access custom reports, it provides more intelligence at a fraction of the cost.
Shopify analytics limitations are a starting point problem, not a permanent one
Shopify’s built-in analytics serve their purpose. For a new store finding its feet, the dashboard gives you enough to make basic decisions without any setup.
The 2025 updates made it meaningfully better, and the customizable dashboard, RFM segmentation, and natural language querying are genuine improvements worth using.
But Shopify analytics limitations become real the moment you start scaling. And a paywall that charges $4,320 more per year just to access custom reports is a meaningful barrier for exactly the stores that need better data most.