
Roughly 77% of FMCG sales still happen in a physical store, according to NielsenIQ’s Consumer Outlook 2026. That number surprises people who assumed the category had moved online for good.
The real shift isn’t that FMCG went digital. It’s that FMCG brands now sell through more channels than they can see across. Retailer POS data sits in one system, distributor sell-through in another, your own ecommerce store in a third, Amazon in a fourth, and marketing spend somewhere else entirely.
Analytics for FMCG companies is what connects those pieces. This article covers what FMCG analytics is, the data sources it draws on, the use cases delivering results right now, and how the picture changes for brands selling mostly online.
What is FMCG analytics?
Analytics for FMCG companies is the process of collecting, analyzing, and visualizing data from sales, customers, products, inventory, marketing, and distribution to help fast-moving consumer goods companies make better commercial decisions.
In practice it answers four questions that decide whether you gain or lose category share:
- Where products are selling, and why: by region, retailer, channel, and SKU
- Which promotions drive incremental sales: versus which ones pull forward purchases customers would have made anyway
- What demand looks like next quarter: accurately enough to avoid both stockouts and write-offs
- Which customers and channels are profitable: after fees, fulfilment, and returns
The distinction worth holding onto: reporting tells you what happened, analytics tells you what to do about it. Most FMCG teams have plenty of the first and not much of the second.
Why analytics for FMCG companies matters more than ever
Three pressures are converging, and each one raises the cost of guessing.
Channel fragmentation: a brand that once sold through a handful of retail accounts now sells through grocery, mass, convenience, marketplaces, quick-commerce apps, and possibly its own DTC site. Each channel reports differently. PepsiCo’s own DTC sites, Snacks.com and PantryShop.com, sit alongside its retail business rather than replacing it, which is the shape most FMCG brands end up with.
Rising trade and acquisition costs: trade spend complexity keeps growing while margins tighten. Deciding where promotional money goes without incrementality analysis is expensive guesswork.
The AI value gap: the AI market in FMCG and retail is forecast to grow from $190 billion in 2025 to $461 billion by 2029, yet BCG’s Widening AI Value Gap report found 60% of companies generate no material value from AI despite investing in it. Spending on analytics and getting value from analytics have become two different things.
There’s a fourth pressure that gets less attention. The average employee spends around 13 hours a week working with data, and for commercial directors and category managers most of that goes into reconciling sources rather than deciding anything.
The upside is well documented. McKinsey estimates CPG companies applying digital and AI across commercial operations can unlock 6% to 10% in incremental revenue and 3 to 5 percentage points of EBITDA growth over three to five years.
The data sources behind analytics for FMCG companies
FMCG data analytics pulls from three categories of data, and most brands underuse at least one. Knowing which is which matters, because they answer different questions and cost wildly different amounts.
Internal data
This is data your company generates. It’s usually free and already sitting somewhere.
- Sell-in data: what shipped from your warehouse to accounts, with product, quantity, and price detail
- Ecommerce and DTC data: transactions from your own store, marketplace accounts, and payment gateways
- Marketing data: campaign spend, engagement, and attribution from ad platforms and email tools
- Inventory and supply data: stock levels, lead times, and production runs
Internal data tells you what you shipped and what you spent. It doesn’t tell you what consumers actually bought, which is the gap the next two categories fill.
Syndicated data
Syndicated data comes from third-party research firms and gives you category and competitor visibility you can’t generate yourself. The main providers are NielsenIQ, Circana (formerly IRI), and SPINS.
- Store or POS data: scanner data from retail checkouts covering sales, pricing, distribution, and promotions down to UPC level
- Panel or household data: collected from consumers through surveys and tracked purchases, covering demographics, brand loyalty, and household penetration
The practical difference: POS data tells you what sold, panel data tells you who bought it and why.
Worth knowing: syndicated data has real gaps. Walmart and wholesale clubs don’t supply cash register data to syndicated providers, so those markets have to be sourced directly from the retailer and added in. Small independent stores are largely untracked and get estimated. Panel data costs more than POS data and often has inadequate sample sizes at UPC level.
Retailer and distributor data
- Retailer direct data: shared by individual chains, offering the closest view of actual consumer purchases at that account
- Sell-through data: from distributors and wholesalers, showing what moved to indirect retailers
This is where the operational pain concentrates. Beyond the major syndicated providers, brands often string together 30 or more separate retail portals, each with a different structure and layout, to assemble a complete picture.
That fragmentation is also a relationship problem. 64% of retailers believe they share adequate data with CPG partners, while only 40% of CPG companies agree. The two sides don’t see the same situation.
Where business analytics in FMCG actually pays off
Five use cases account for most of the measurable return from analytics for FMCG companies. They share a pattern. Each one improves a specific recurring commercial decision rather than producing another dashboard.
Demand forecasting
Forecasting is the most mature application in FMCG analytics, and the numbers behind it are unusually concrete.
AI-driven demand sensing ingests POS data, weather, local events, competitor pricing, and social signals to produce continuous SKU-store forecasts. The accuracy gap is wide: roughly 92% for AI-driven methods against 75% for traditional approaches. Mean absolute percentage error falls around 22%, and product waste drops roughly 15% as a direct result of not overproducing against inflated forecasts.
The named results hold up:
- Unilever increased ice cream sales up to 30% in key markets after connecting weather data to demand forecasting
- Danone improved forecast accuracy by 90% and cut product waste through AI-driven demand and promotional planning
- A personal-care CPG documented by McKinsey achieved a 13% forecast accuracy improvement, a 40% reduction in supply shortages, and a 35% reduction in inventory
Forecasting typically delivers measurable ROI within 60 to 90 days, because the data usually exists internally and the decision recurs every planning cycle.
Trade promotion optimization
This is the largest controllable line on most FMCG P&Ls and the one most often run on habit.
Trade spend runs 15% to 20% of net sales on most CPG P&Ls, and McKinsey puts CPG trade promotion investment at roughly 20% of revenue with a large share underperforming.
Trade promotion optimization uses elasticity models, historical lift curves, and cannibalization analysis to separate genuine incremental volume from volume that would have happened anyway. Machine learning models applied to trade promotion have shown roughly 17% to 20% improvement in promotional ROI. One mid-market CPG engagement lifted gross profit 8% overall and 13% on flagship brands while improving trade promotion ROI from 80% to 92%.
The measurement point that decides everything: your baseline is the expected non-promoted volume by SKU, store, and week. Get the baseline wrong and every incrementality claim built on it is wrong too.
Mechanics behave differently. Temporary price reductions tend to pull forward pantry loading. Multi-buys expand baskets on household staples. Display creates trial in impulse categories. Feature supports awareness during seasonal peaks. Elasticity by retailer and region tells you which to use where.
Pricing and revenue growth management
RGM has moved from a specialist function to the owner of commercial decisions. In 2026, 70% of companies rely on RGM to own post-event ROI analysis, 55% place trade promotion and pricing optimization under RGM leadership, and 45% assign what-if scenario planning to revenue management teams.
The definition of success shifted with it. 75% of organizations now measure promotional effectiveness using ROI or incremental profit, while only 43% emphasize net sales as a primary KPI.
The constraint isn’t analytics: 53% of retailers are open to new promotional tactics when supported by strong data, yet 47% of organizations still default to legacy anniversary-based planning. The gap is sales adoption and change management, not modelling capability.
Category and shelf analytics
Retailers control shelf space, promotional windows, and first-party purchasing data that brands can only reach through partnership. Category analytics is how you earn that partnership, by proving you grow the category rather than just your own share.
Retail execution and shelf analytics can show results within 45 to 90 days when image data is already available. One CPG client achieved 14% year-on-year sales growth from assortment and store-mix recommendations after connecting an analytics platform to retailer data.
Customer and consumer segmentation
Segmentation moves past broad demographics toward behavioural clusters built on actual purchase patterns, category habits, and channel preference.
For brands with direct consumer relationships through DTC or marketplace channels, this gets considerably more precise, because you see individual purchase histories rather than aggregate panel estimates.
Online and in-store need different analytics
The 77% in-store figure hides how fast the online share moves in specific categories. Online grocery reached 12.5% share in 2023 and hit 19% during peak months by late 2025. Amazon holds over 40% of US ecommerce and controls most retail media ad spend.
Most FMCG brands run two analytics problems at once, and they don’t behave the same way.
In-store analytics is aggregate and delayed: you see what sold at store and week level through POS and syndicated data. You rarely see who bought it. Panel data estimates the who, at cost, with sample-size limits at SKU level.
Online analytics is individual and immediate: every transaction carries a customer identity, a basket, a source, and a timestamp. You see repeat rates, lifetime value, and cohort behaviour directly rather than through estimation.
That difference compounds. Every year without a direct consumer data programme is a year of learning that can’t be recovered retrospectively.
Why retail media raised the stakes
Retail media networks changed the economics of the retailer relationship. Spending surpassed $50 billion in 2025, and roughly 62% of global retailers have built in-house media networks to monetise their first-party customer data.
The practical effect: you now pay retailers not just for shelf space but for the right to reach consumers their loyalty programme already claimed. Meanwhile 49% of retail media platforms struggle to accurately measure ad-to-store conversion, so you’re buying audiences you can’t fully verify.
Brands with their own consumer data sit in a stronger position, which is why DTC keeps expanding even where it’s a small revenue share. Mondelez has publicly targeted 20% of sales through DTC by 2030. P&G grew subscription revenue 89% year over year after adding AI-driven replenishment and predictive bundling to its subscription programme.
What eCommerce-first FMCG brands track
If most of your volume moves through your own store, marketplaces, or DTC subscriptions, the picture shifts toward metrics you measure directly:
- Product profitability after all costs: margin rank after fulfilment, returns, and channel fees, not revenue rank
- Repeat purchase rate and reorder cadence: consumables have natural replenishment cycles, and knowing yours drives email timing and inventory
- Customer lifetime value by acquisition channel: which channels bring buyers who come back versus buyers who buy once
- True channel profitability: Amazon revenue and Amazon profit are different numbers once fees and returns are counted
- Cross-channel customer overlap: whether your marketplace buyers and DTC buyers are the same people
If you’re building this foundation from scratch, the eCommerce Analytics 101 guide covers the groundwork.
Putler for eCommerce-first FMCG analytics
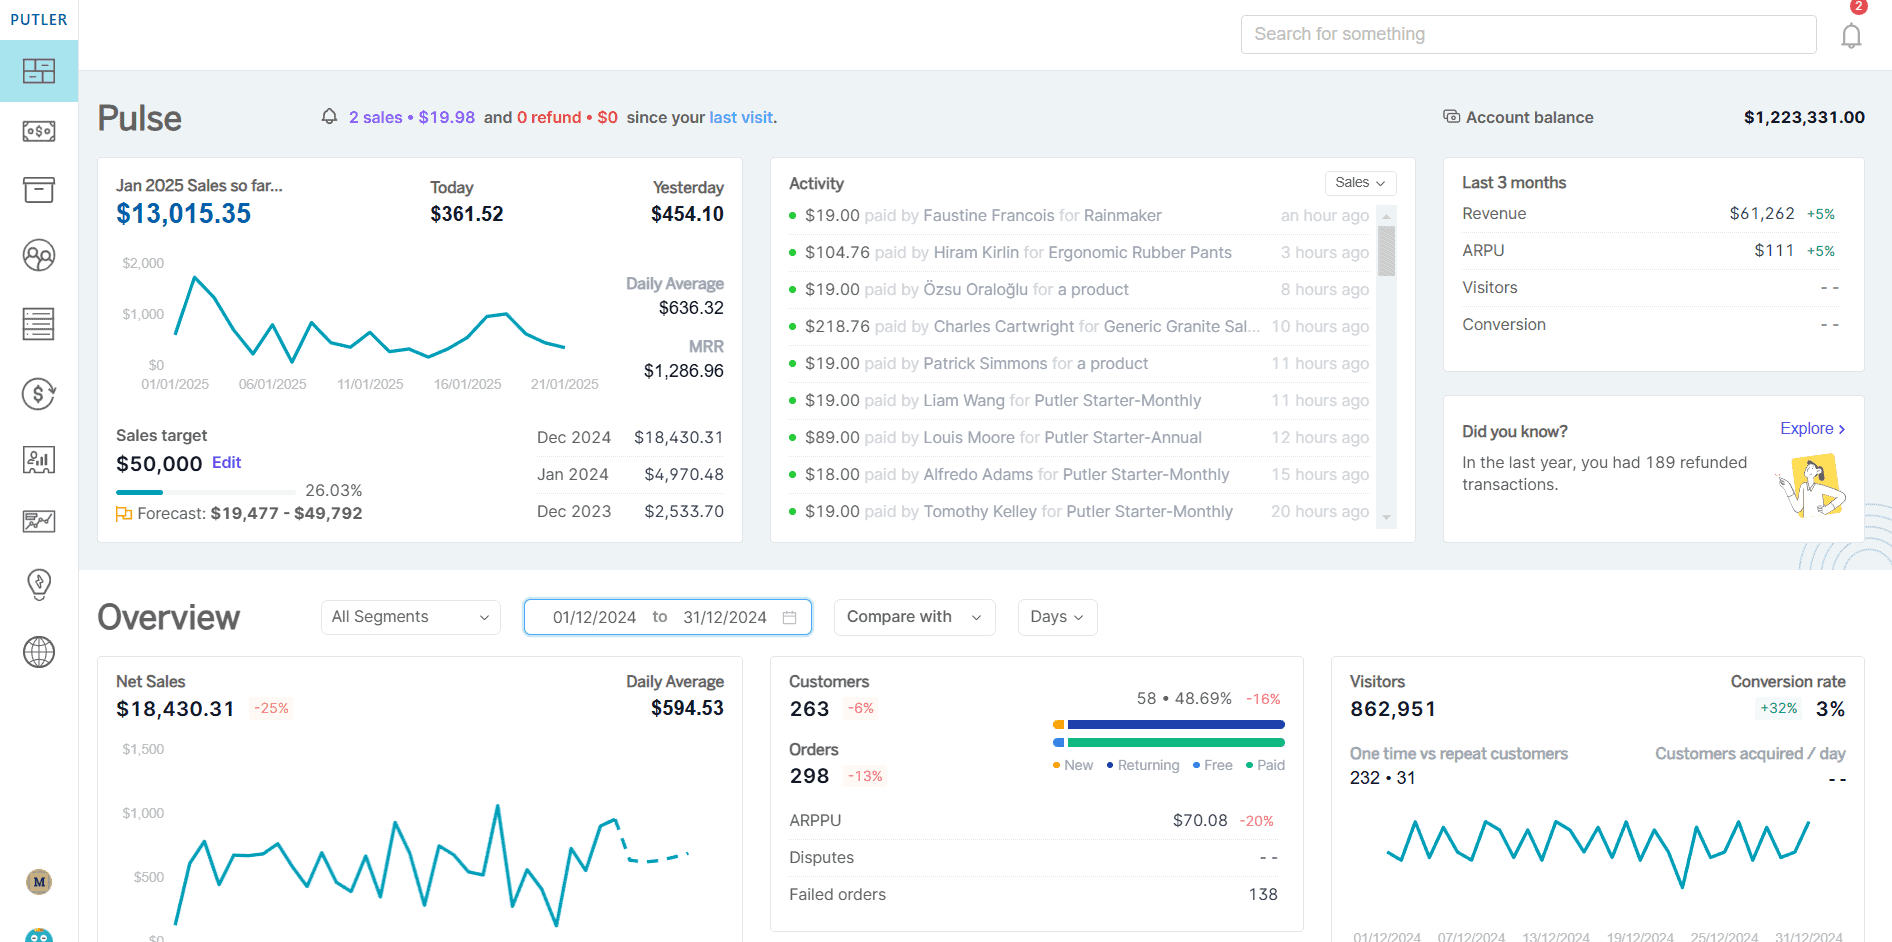
Putler is built for the online side of that split. It consolidates sales, customer, product, and transaction data from ecommerce platforms, marketplaces, payment gateways, and web analytics into one dashboard.
Worth being clear about scope. Putler doesn’t replace syndicated data, trade promotion management systems, or distributor reporting. For a brand whose volume runs mostly through retail accounts, those systems stay the core. Putler covers the part of the business flowing through digital channels, which for most FMCG brands is the fastest growing and the least well instrumented.
Multi-channel consolidation
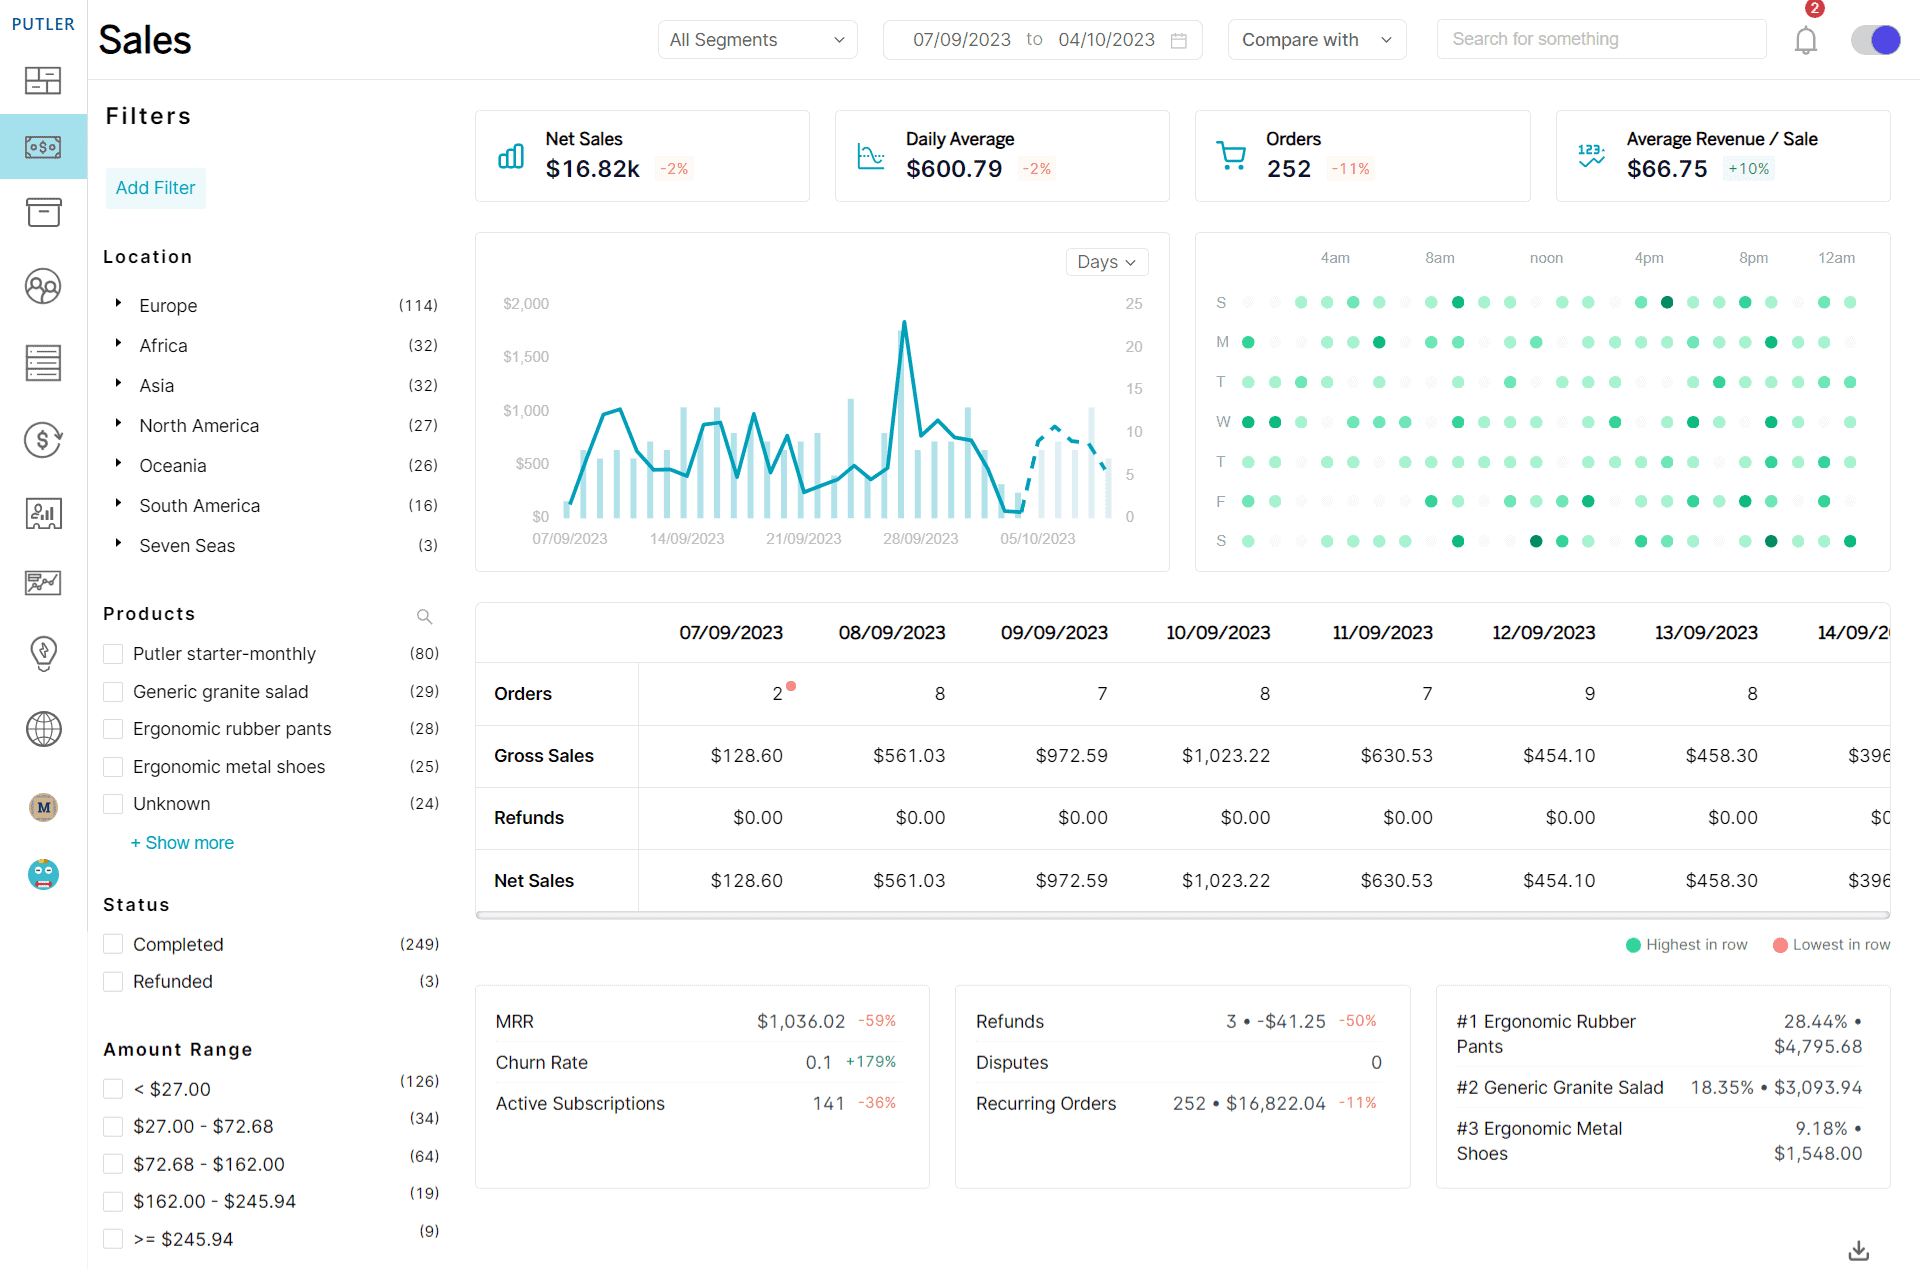
Putler connects 17+ integrations covering Shopify, WooCommerce, Amazon, Stripe, PayPal, Google Analytics, and Mailchimp. Data from every connected source lands in one view rather than five browser tabs.
Automatic deduplication: a customer paying by PayPal on a Shopify store creates a record in both systems. Putler identifies and removes those duplicates, so revenue isn’t double-counted across sources.
Advanced customer segmentation
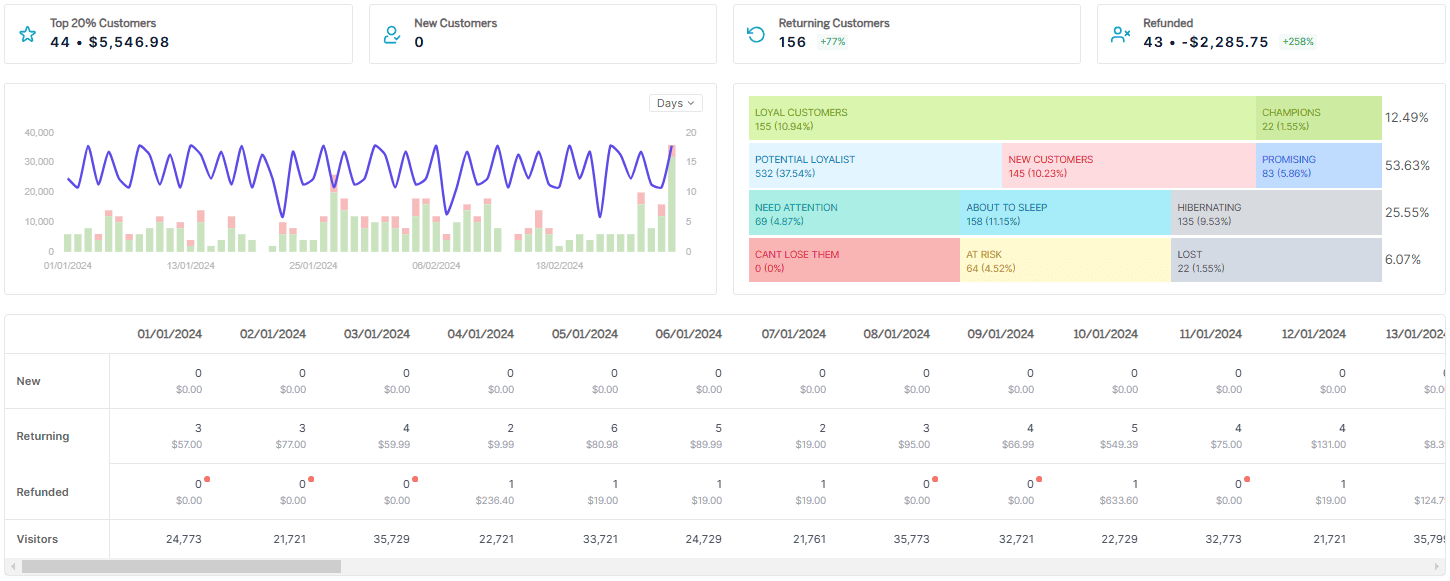
Putler sorts your customer base into behavioural segments with one click, using recency, frequency, and monetary value:
- Champions: loyal, high-value customers who justify VIP treatment
- At Risk: previously good customers showing signs of slipping away
- Need Attention: regular customers who haven’t purchased recently
- Promising: new customers showing potential to become regulars
- Can’t Lose: former high-value customers who’ve gone inactive
Customers move between segments automatically as behaviour changes, so segmentation stays current without maintenance. For consumables with predictable reorder cycles, that timing matters more than for most categories.
Product and filter depth
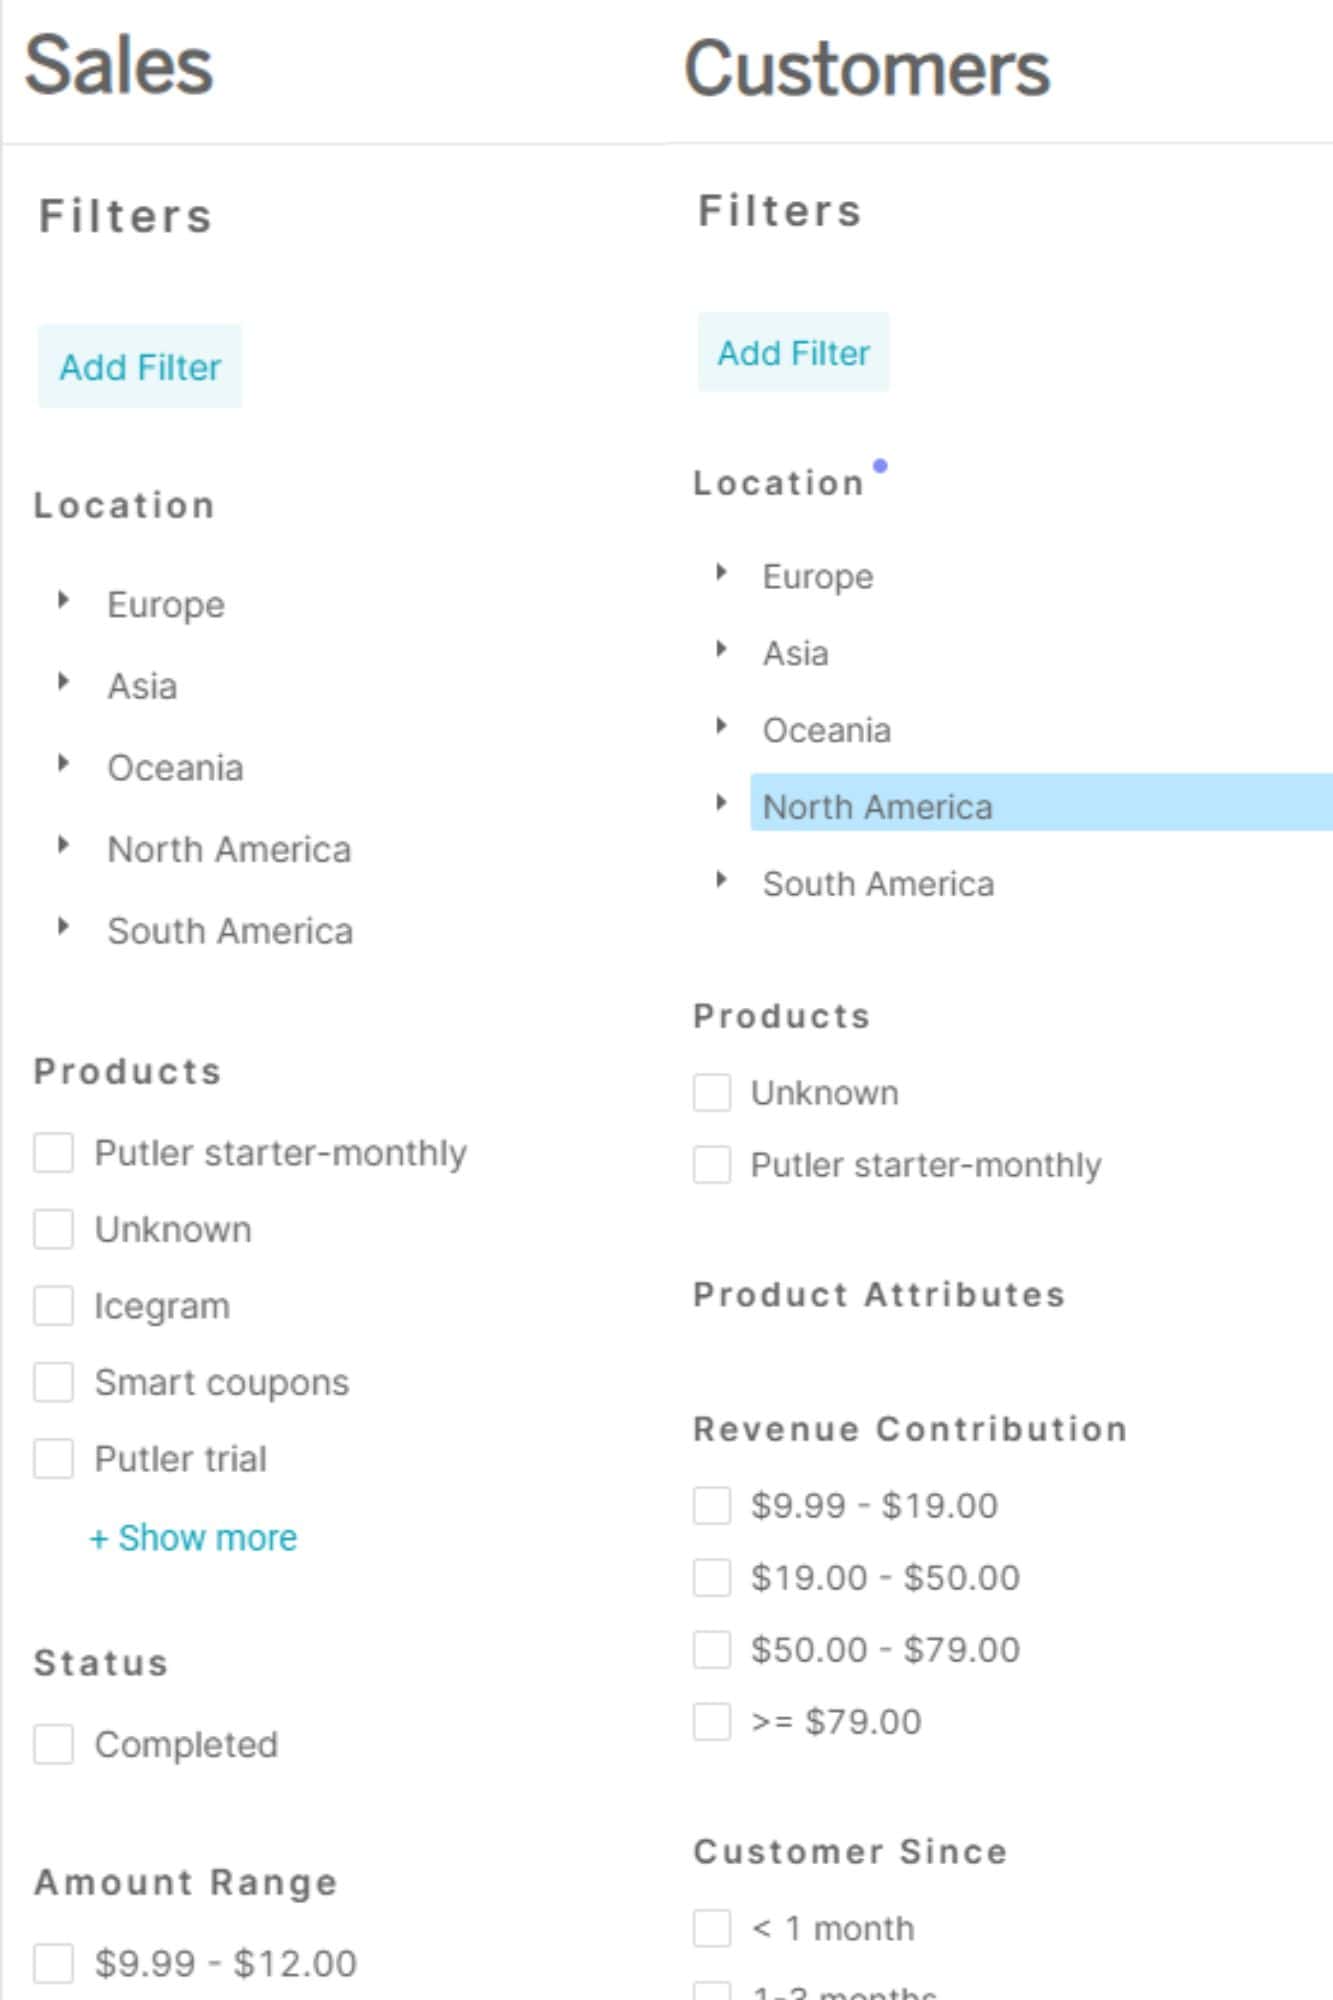
Putler shows which products carry margin, which ones sell together, and which drive first purchases versus repeat ones. Filters span location, product, revenue, and order status, and combinations can be saved so you check the same slice week after week without rebuilding it.
Weekly insights and forecasting
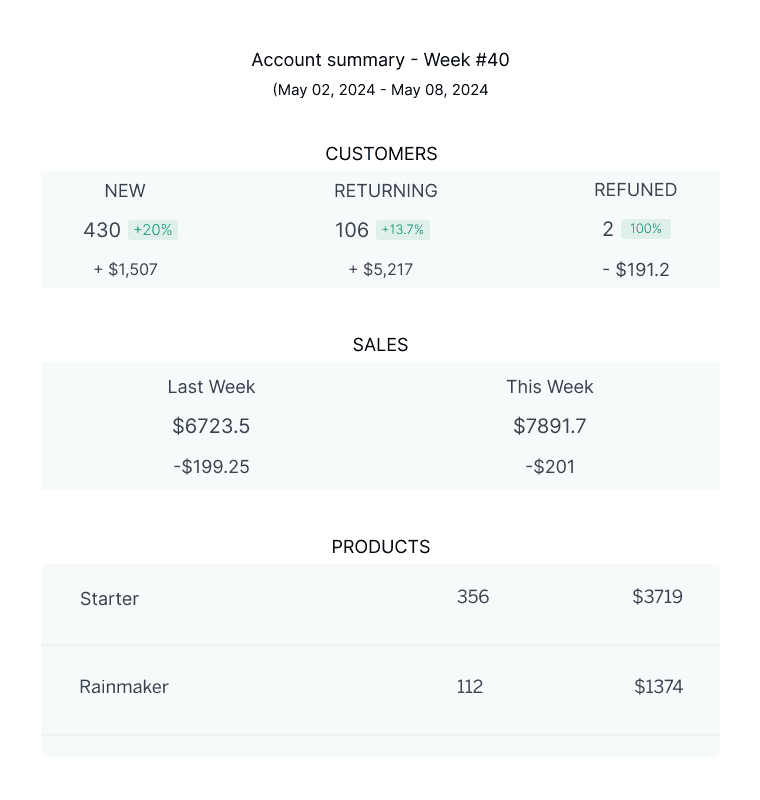
Weekly insight emails deliver a digest of key metrics and notable changes rather than waiting for you to log in. Putler’s forecasting projects revenue and customer growth from your historical data, which helps on the inventory side where consumables move fast.
When Putler isn’t the right fit
Putler solves a specific problem well. Worth naming where it doesn’t.
Brands with significant brick-and-mortar operations
If most of your volume moves through retail accounts, Putler covers the smaller part of your business. It doesn’t integrate with POS systems or ERP platforms, and it doesn’t ingest syndicated data from NielsenIQ, Circana, or SPINS.
For brands running multi-location retail, distributor networks, or trade promotion planning, the core stack looks different: a CPG data platform for retailer data consolidation, a trade promotion management system, syndicated subscriptions, and enterprise BI like Tableau or Power BI on top.
Subscription-heavy businesses with advanced requirements
Putler includes SaaS dashboards covering churn, MRR, and LTV. For an FMCG brand with a subscription component alongside one-off purchases, that’s usually enough.
If subscriptions are the whole business model, with complex tiers, variable billing cycles, or granular cohort requirements, specialist tools like ProfitWell, Baremetrics, or ChartMogul go deeper.
Teams that need custom data modelling
Putler gives you pre-built dashboards rather than a dashboard builder. That’s the right trade for most teams. If you have a data function that wants to write SQL against a warehouse and model its own metrics, you want a warehouse and a BI layer instead.
When Putler is the right fit
You sell online through Shopify, WooCommerce, or Amazon
Putler’s integrations with major ecommerce platforms and marketplaces are its strongest area. It suits the brand running a Shopify store, an Amazon seller account, and maybe a WooCommerce site for wholesale, where no single platform’s native analytics shows the whole picture.
You want insights rather than a dashboard project
Most analytics tools give you building blocks and leave interpretation to you. That works if you have an analyst. Most growing FMCG brands don’t.
Putler ships with pre-built dashboards and weekly insight emails, so the work becomes acting on findings rather than configuring reports. No SQL, no data modelling.
You need clarity more than depth
If your team gets overwhelmed by enterprise data analytics in FMCG companies, Putler sits at a useful middle point. Enough depth to answer real commercial questions, not so much that operating it needs a specialist.
FAQs
What is FMCG analytics?
FMCG analytics is the process of collecting and analyzing data from sales, customers, products, inventory, marketing, and distribution to help fast-moving consumer goods companies make better commercial decisions. It covers demand forecasting, trade promotion, pricing, category management, and customer analysis.
What data should FMCG companies track?
Sales performance by channel and SKU, product profitability after all costs, repeat purchase rates, inventory and stock-out levels, promotional incrementality, average order value, customer lifetime value, and marketing campaign performance.
What are the main data sources in FMCG analytics?
Three categories. Internal data covering shipments, ecommerce transactions, and marketing spend. Syndicated data from NielsenIQ, Circana, and SPINS covering category and competitor performance. Retailer and distributor data showing what actually sold at each account.
How does data analytics improve FMCG sales?
By separating incremental promotional volume from volume that would have happened anyway, forecasting demand accurately enough to avoid stockouts and write-offs, identifying which products and channels carry real margin, and targeting retention at customers likely to lapse.
What is trade promotion optimization?
The use of elasticity models, lift curves, and cannibalization analysis to determine which promotions generate genuine incremental volume. Trade spend runs 15% to 20% of net sales for most CPG companies, so promotional efficiency has a direct margin impact.
How accurate is AI demand forecasting in FMCG?
AI-driven approaches reach roughly 92% forecast accuracy against about 75% for traditional methods. Named results include Unilever lifting ice cream sales up to 30% in key markets using weather-based forecasting and Danone improving forecast accuracy by 90%.
Which analytics tool is best for FMCG brands?
It depends on where your volume sits. Retail-led brands need syndicated data, trade promotion management, and a CPG data platform. eCommerce-first brands are better served by a consolidated ecommerce analytics tool. Large organizations with dedicated data teams often add enterprise BI like Tableau or Power BI.
How long before FMCG analytics shows results?
Demand forecasting and trade promotion optimization typically show measurable results within 60 to 90 days, because the data usually exists internally and the decisions recur every planning cycle. Retail execution and shelf analytics can show results in 45 to 90 days where image data already exists.
Getting value from analytics for FMCG companies
The brands getting value from analytics for FMCG companies aren’t the ones with the most data. They’re the ones who connected it and attached decisions to it.
Start with the decision you make most often and least confidently. Connect the data that informs it. Prove the value, then expand.
- Best eCommerce Analytics Software for Business Success in 2026
- Analytics Dashboard: Importance, Types, and Best Tools in 2026
- The Best Web Analytics Tools for Your Website (2026)
- A Beginners Guide to Use Data Analytics for Marketing in 2026
- Subscription Analytics Tools: The Details You Need to Know About (2026)