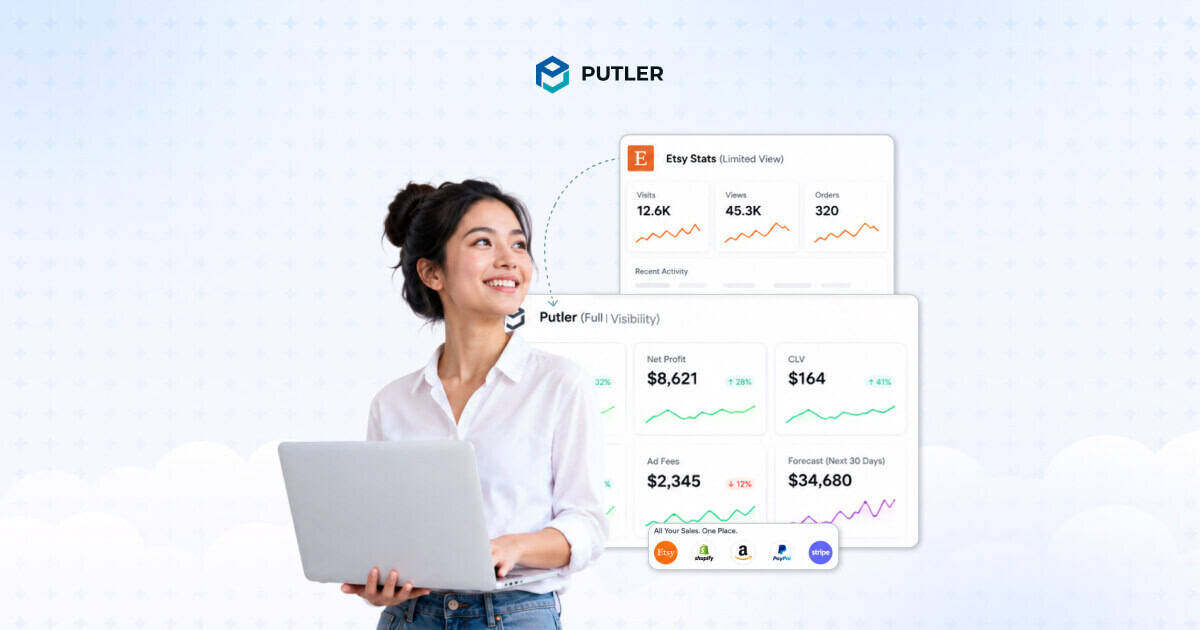
You open your Etsy stats. Visits are up. Orders look decent. Revenue is climbing.
But you still cannot answer the questions that actually matter.
Who are your best customers? Which listings are genuinely profitable after fees and materials? Are people buying from you more than once? Etsy’s dashboard stays silent on all of it.
With over 9 million active sellers on Etsy, the competition for visibility is fierce. The sellers who grow past the hobbyist level are the ones making data-driven decisions.
And Etsy analytics limitations, despite recent platform upgrades, leave critical gaps that make those decisions harder than they need to be.
This article covers every one of those gaps, the workarounds sellers try, and what a proper Etsy seller analytics setup actually looks like for a serious shop.
What Etsy’s stats dashboard actually gives you
Start here, because Etsy does give you something.
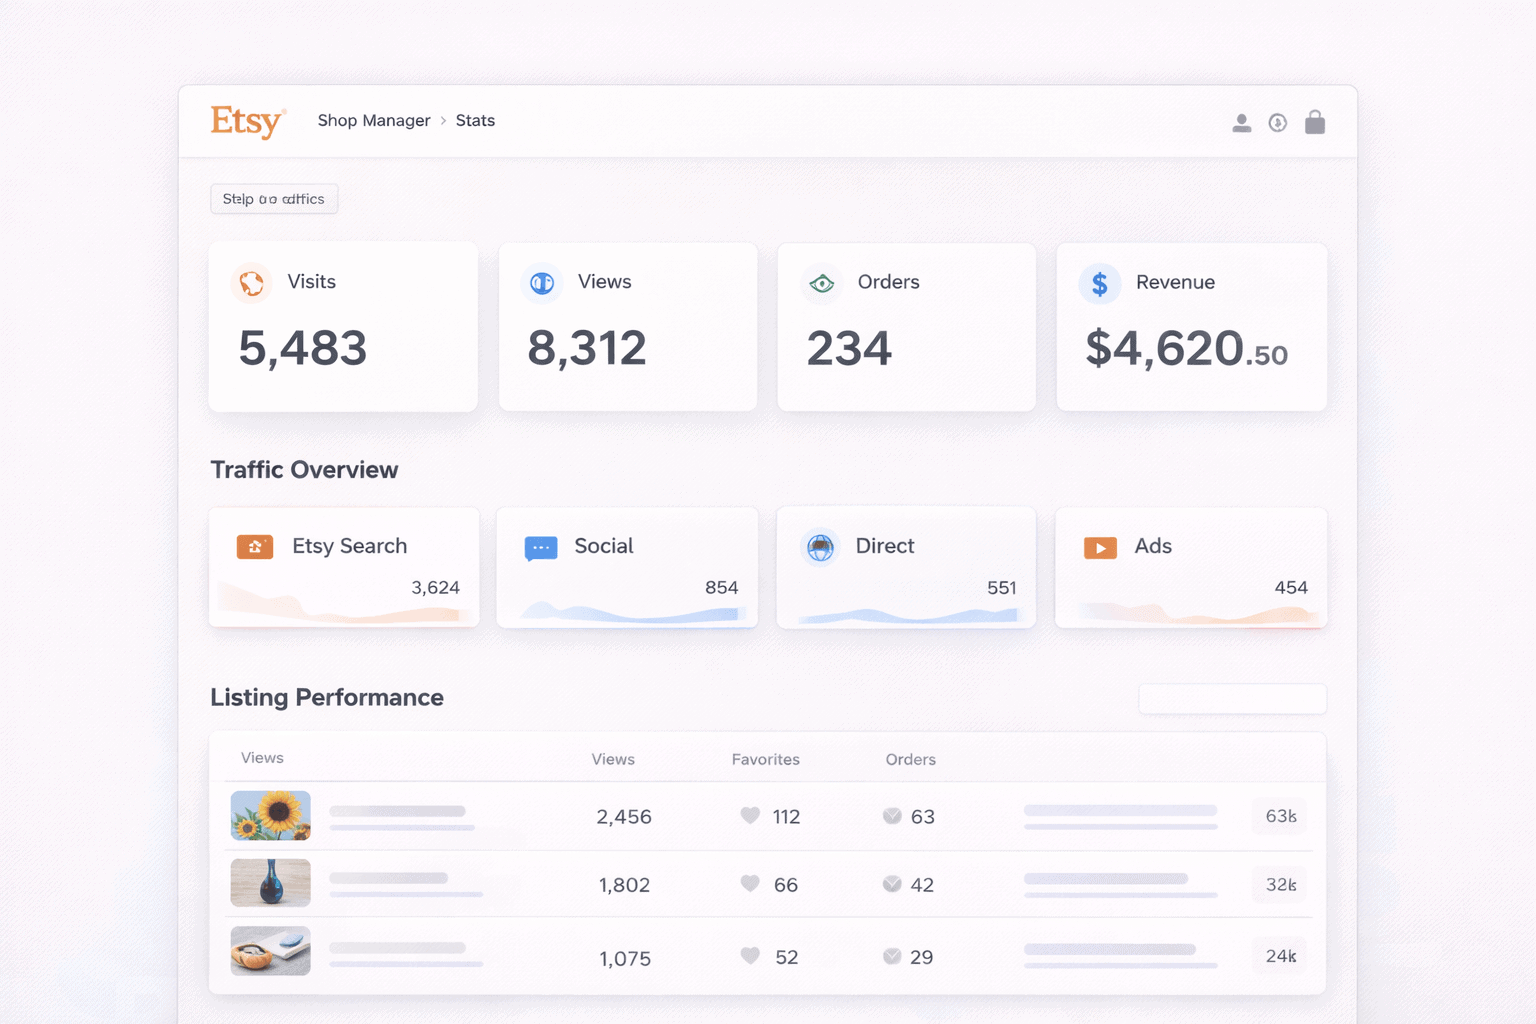
The Stats dashboard inside Shop Manager shows four core metrics: Visits, Views, Orders, and Revenue. You can see how buyers found you across traffic sources including Etsy Search, Direct Traffic, Social Media, Etsy Ads, and Offsite Ads.
The listing stats section shows how individual listings are performing by views, orders, favourites, and revenue over a selected timeframe.
The search terms report surfaces the keywords buyers used to find your shop. The newer Search Visibility page, launched in August 2024, adds Impressions and Click-Through Rate data to give sellers a clearer picture of how listings perform in search results.
For a casual seller checking in occasionally, this is enough. For anyone trying to run a real business on Etsy, it is where the Etsy analytics limitations start showing up fast.
Etsy analytics limitations: where the stats dashboard falls short
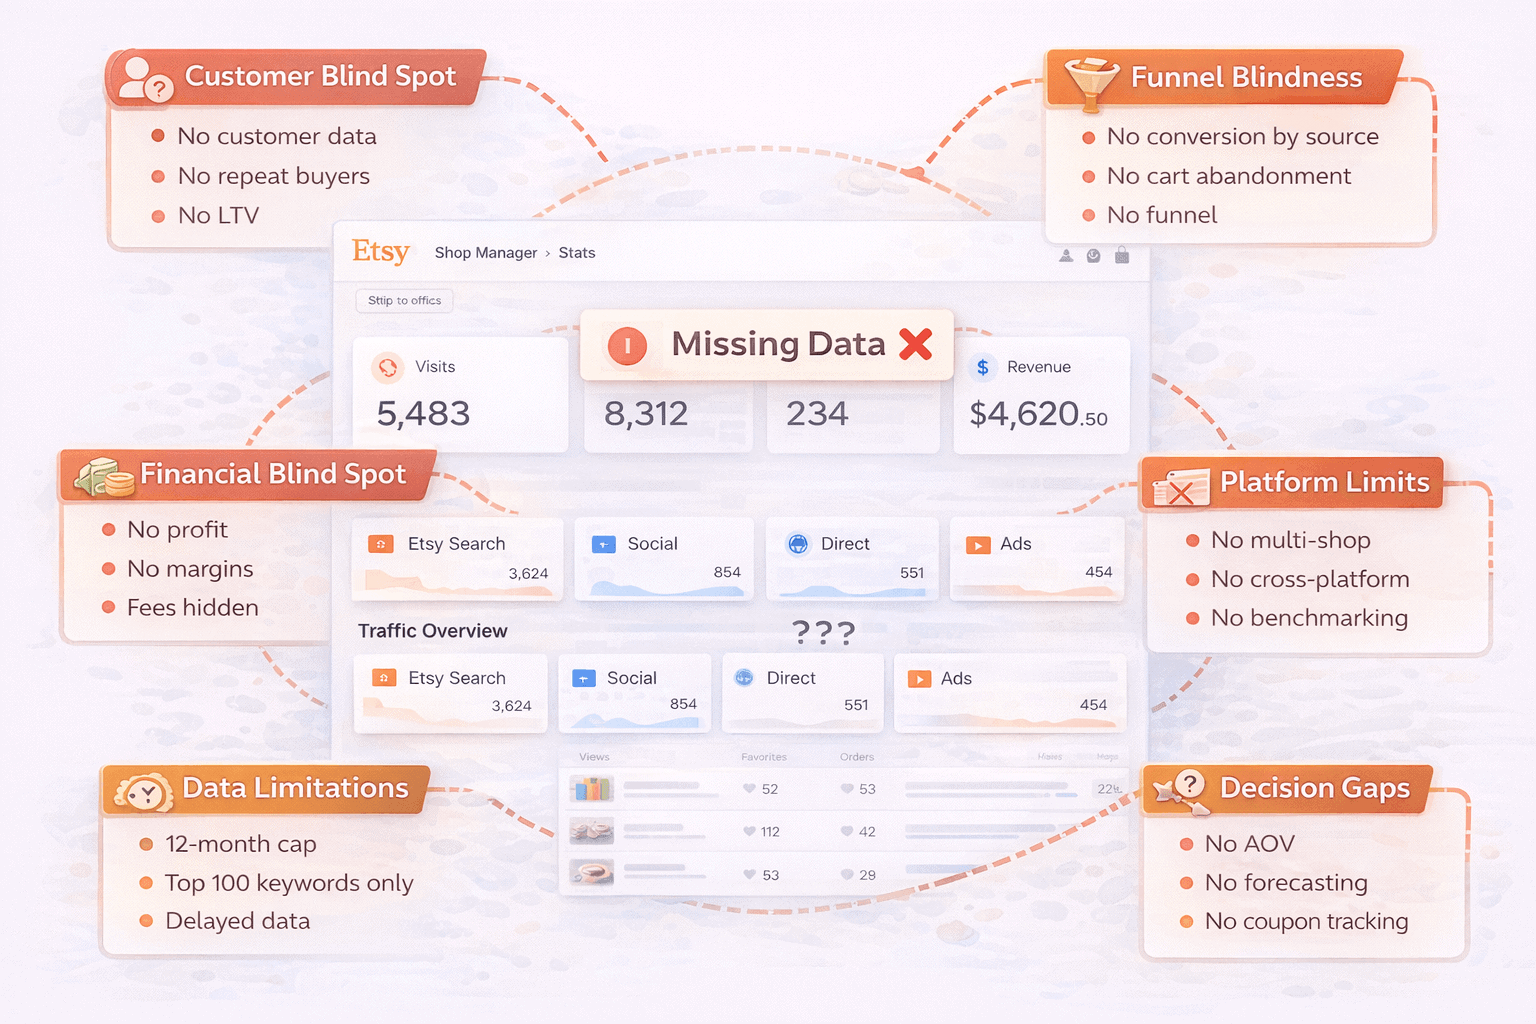
Here is every gap that matters for sellers serious about growth.
No customer data whatsoever
Etsy owns the buyer relationship. That is not a small caveat. It is the core limitation that flows into nearly every other Etsy reporting gap on this list.
Sellers cannot see buyer email addresses, phone numbers, or any persistent contact information beyond what appears in an order. You have no customer list.
You cannot identify who your buyers actually are outside of individual order messages. The moment a sale completes, the customer relationship belongs to Etsy, not to you.
This matters because building a business on repeat customers is not possible when you cannot see who your customers are.
No repeat buyer identification
Etsy’s dashboard shows orders and revenue. It does not distinguish between a first-time buyer and someone who has purchased from your shop a dozen times.
There is no native metric for customer retention rate, no indicator of whether your repeat purchase rate is improving, and no way to identify which customers keep coming back versus which ones bought once and never returned.
For sellers trying to build loyalty, this is a complete blind spot in Etsy shop analytics.
No customer lifetime value tracking
If you cannot identify customers or track repeat purchases, calculating customer lifetime value is impossible inside Etsy’s dashboard.
LTV is the metric that tells you what a customer is actually worth over time, not just in a single transaction.
Without it, sellers cannot evaluate which product lines attract the most valuable buyers, which marketing channels bring in customers who return, or what a new customer acquisition is genuinely worth to the business. Every growth decision becomes a guess.
No profit tracking or margin visibility
Etsy shows gross revenue. It shows nothing about what that revenue actually costs you to generate.
Listing fees ($0.20 per listing), transaction fees (6.5% of the sale price), payment processing fees (3% plus $0.25 per transaction), and offsite ad fees (12 to 15% when applicable) all come out of every order.
Add material costs, packaging, and shipping for physical sellers and the gap between gross revenue and actual profit can be enormous. Etsy’s dashboard tracks none of it.
Sellers routinely discover they have been running loss-making products for months because the dashboard showed revenue, not margin. This is one of the most financially costly Etsy analytics limitations for growing shops.
Historical data is capped at 12 months
Etsy Stats only go back one year. For a seasonal business where comparing this December to last December matters more than comparing to last month, one year of history is often insufficient.
Sellers cannot identify multi-year growth trends, analyse how their business has evolved since launch, or build meaningful long-term forecasts from Etsy’s native data alone. Once data ages past 12 months, it is gone from the dashboard entirely.
Search terms report limited to top 100 only
The search terms section shows which keywords buyers used to find your listings. It shows the top 100. Every search term beyond that is invisible.
For shops with large catalogues attracting traffic from hundreds of long-tail queries, the majority of keyword data simply does not exist in the dashboard.
Sellers optimising tags and titles are working from an incomplete picture of how buyers are actually finding them.
Traffic data shows sessions, not buyer intent
Visits tell you how many sessions occurred from each traffic source. They do not show you what those visitors did once they arrived, or how likely they were to buy.
A seller might see that 60% of their visits come from Etsy Search and 20% from Social Media.
What they cannot see is whether the social media visitors convert at 0.5% while Etsy Search visitors convert at 4%. Without conversion rate by traffic source, channel performance is impossible to evaluate accurately.
No abandoned cart or funnel visibility
Etsy gives sellers zero data on shoppers who viewed a listing, added an item to their cart, and left without purchasing.
Cart abandonment rates in eCommerce typically run between 70 and 80%. That represents a massive pool of warm prospects who showed genuine purchase intent.
Sellers have no way to know which listings trigger cart additions but not completions, what the drop-off rate looks like, or what might be causing hesitation at the checkout stage. The funnel is invisible past the listing view.
Data refreshes are delayed, not real-time
Visits data in Etsy Stats refreshes a few times per day. At the end of each day, Etsy runs a second pass to filter out bot traffic, which can reduce previously displayed visit counts.
For a seller running a 48-hour flash sale or monitoring the impact of a social media post, this delay makes the stats useless in the moment.
You cannot see whether a promotion is working while it is live. By the time the data reflects reality, the window to act on it has closed.
Stats data is unreliable and glitches without warning
Etsy’s stats infrastructure has a documented reliability problem that compounds every other Etsy analytics limitation on this list.
In August 2025, a widespread platform issue caused stats dashboards to display all zeros for over 14 hours.
More than 130 sellers reported the outage in a single community forum thread. Etsy provided no public acknowledgement and no timeline for resolution.
Sellers regularly report delayed updates, inconsistent counts, and visit numbers that decrease overnight as Etsy’s end-of-day bot filtering runs.
No multi-shop consolidated view
Many serious Etsy sellers run two or more shops, splitting product lines, brands, or markets across separate accounts. Etsy shows each shop in complete isolation.
There is no native way to view combined revenue across shops, identify customers who buy from more than one of your shops, compare product performance across your portfolio, or see a single unified business picture.
Managing multiple shops means manually reconciling data from multiple dashboards every single time.
No cross-platform visibility
Sellers also operating a Shopify store, a WooCommerce site, or selling through PayPal and Amazon alongside Etsy get no unified data anywhere in Etsy’s dashboard.
Each platform operates as a separate silo. A customer who buys on Etsy on Monday and through your Shopify store on Friday is invisible as a repeat customer in both systems.
For multi-channel sellers, this is one of the most disruptive Etsy analytics limitations to manage at scale.
Listing stats show views, not revenue
The default listing stats view sorts listings by highest view count. Views and revenue are not the same thing.
A listing with 2,000 views and 5 orders is not performing better than a listing with 300 views and 40 orders.
Sellers who optimise for views rather than conversions and revenue are chasing the wrong number. The default view actively misdirects attention toward vanity metrics.
No refund trend analysis
Individual refunds appear in the payment account section as line items.
There is no aggregated refund rate by product, no trend line showing whether refunds are increasing, and no way to identify which specific listings generate disproportionate return requests.
For sellers with physical products, a rising refund rate on a specific item often signals a quality or description problem that needs fixing. Without trend visibility, that signal stays buried in individual order records.
No geographic revenue breakdown
Etsy’s traffic sources section shows which countries visitors came from. It does not show revenue by country, conversion rate by geography, or which international markets are actually buying versus just browsing.
For sellers deciding whether to invest in international shipping or adjust pricing for specific markets, this Etsy reporting gap means making those decisions without the data that would make them sound.
No revenue forecasting
Every number in Etsy’s Stats dashboard looks backward. There is no forward projection, no seasonal revenue forecast, and no growth modelling built into the platform.
Sellers planning inventory levels ahead of a holiday season, deciding whether to hire help, or evaluating whether to invest in new product lines have no native forecasting tool to work with.
No coupon or discount performance tracking
Etsy lets sellers create coupon codes, run percentage-off sales, and send targeted offers. None of that performance data surfaces in the Stats dashboard.
Coupon data lives in the Order Item CSV export. To understand which types of discounts drive the most orders, sellers have to export raw data and build their own analysis from scratch.
For sellers running multiple promotions across busy seasons, this is hours of manual work every time they want a straight answer.
Star Seller metrics push sellers toward unprofitable decisions
The Star Seller badge requires hitting specific thresholds. Miss any of them and the badge disappears. The badge influences search visibility and buyer trust. So sellers protect it.
The problem is that Etsy provides no data connecting the Star Seller badge to actual revenue impact.
Sellers cannot see whether holding the badge generates enough additional sales to justify absorbing the costs of decisions made purely to maintain it — like refunding a disputed order to avoid a case count or upgrading to tracked shipping on every low-value order regardless of margin impact.
No inventory tracking or low-stock alerts
Etsy has no native inventory management system beyond a manual quantity field per listing.
There are no low-stock warnings, no reorder point alerts, and no dashboard signal that a bestseller is about to sell out.
For physical product sellers approaching a peak season, this gap has a direct revenue cost.
A listing that hits zero stock goes inactive in search results. Traffic built up over weeks of algorithm momentum drops immediately.
The seller finds out because orders stopped, not because the dashboard warned them.
Offsite Ads fees are invisible in revenue reporting
When Etsy runs an offsite ad for one of your listings and a buyer purchases within 30 days, Etsy charges either 12% or 15% of the order total as an advertising fee.
Sellers processing over $10,000 in a 12-month period are enrolled automatically and cannot opt out.
The Stats dashboard shows revenue from offsite ad orders.
It does not show the fee as a clearly separated line item within the revenue view.
For a seller whose offsite ads drive significant volume, this Etsy analytics limitation can mask a channel that is generating orders while quietly eroding margin.
No email marketing performance data
Most serious Etsy sellers eventually build an email list outside the platform.
Etsy’s Stats dashboard has no integration with external email platforms and no attribution layer that connects email-driven visits to completed orders.
Without that confirmation, scaling email investment becomes a gut call rather than a data-driven one.
No conversion rate by traffic source
The overall shop conversion rate is calculable from the dashboard by dividing orders by visits.
Etsy does not break that conversion rate down by where the traffic came from.
A seller might see that 30% of their visits come from Pinterest and feel good about their social media effort.
What they cannot see is that Pinterest visitors convert at 0.4% while Etsy Search visitors convert at 3.8%.
Without conversion rate by source, traffic volume from any channel looks like performance even when it is not producing sales.
No competitor benchmarking
Etsy provides no data on how your shop’s metrics compare to similar sellers in your niche or category.
Sellers have no native way to know whether their conversion rate is strong or weak relative to the market, whether their average order value is above or below category norms, or how their traffic growth compares to comparable shops.
No average order value tracking
Average order value is not a native metric in Etsy’s Stats dashboard. Sellers who want to know their AOV have to calculate it manually.
For sellers trying to evaluate whether a bundle offer, free shipping threshold, or upsell strategy is increasing basket size, the absence of a native AOV metric means every test requires a manual calculation rather than a simple dashboard check.
The workarounds Etsy sellers use and why they break down
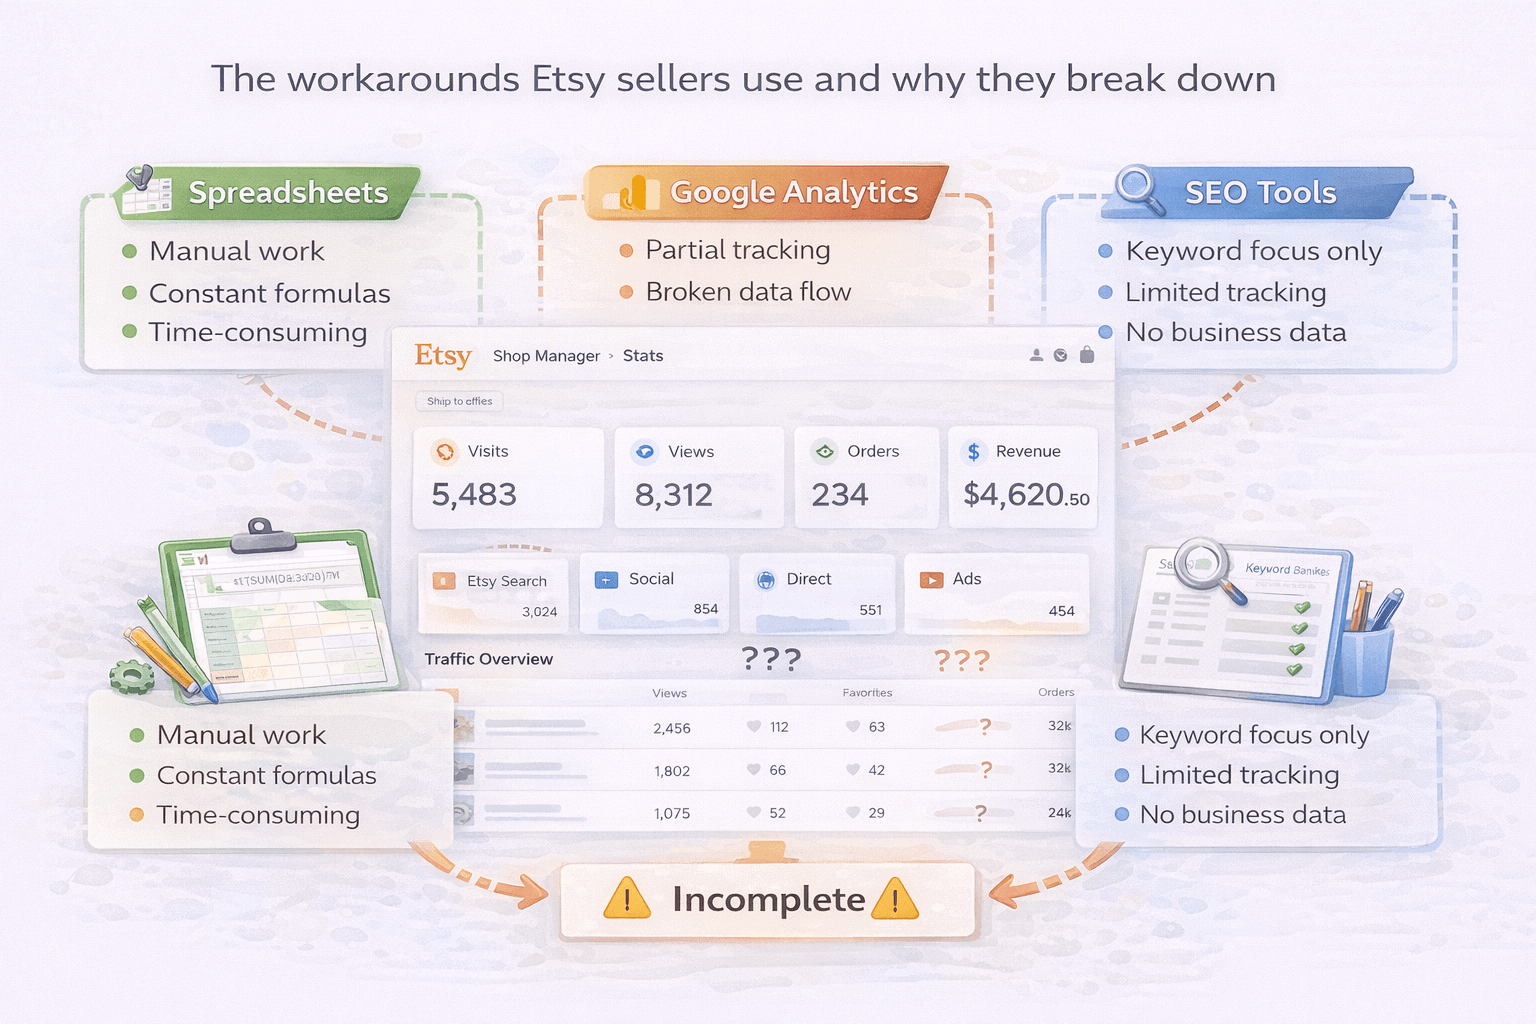
Most sellers hit these Etsy analytics limitations and reach for one of three fixes. Each one helps up to a point. Here is where each one runs out.
Spreadsheets
Exporting order CSVs from Etsy and building Excel models is the most common response to Etsy’s analytics gaps. Sellers can calculate basic profit by manually subtracting fees and material costs from exported revenue data.
But spreadsheets still cannot solve the customer data gap because Etsy does not export buyer email addresses. They cannot identify repeat buyers.
They do not update automatically. A seller managing 200 listings across two shops spending two hours per week on manual reconciliation is losing 100 hours per year to a process that should not exist.
Google Analytics integration
Etsy allows sellers to connect Google Analytics to their shop, which adds a layer of behavioural data. GA4 can show session duration, pages viewed, and traffic source behaviour.
But the integration has real limits. GA4 does not show profit, customer identity, repeat purchase behaviour, or multi-platform revenue.
It also requires a level of technical setup that most Etsy sellers did not sign up to manage. It is a better picture than nothing. It is not a business analytics solution.
Third-party Etsy SEO tools
Tools like Marmalead, eRank, EverBee, and Alura are excellent for keyword research, listing optimisation, and competitor analysis.
What they are not built for is business analytics. They cannot track profit margin, show customer lifetime value, or provide a view of revenue across multiple platforms.
Using an Etsy SEO tool to answer business performance questions is like using a ruler to check the temperature. The tool is excellent. It is solving a different problem.
How Putler addresses Etsy analytics limitations for serious sellers
These Etsy analytics limitations share a common root: Etsy gives you traffic data and order counts, but withholds everything that makes those numbers actionable as a business owner.
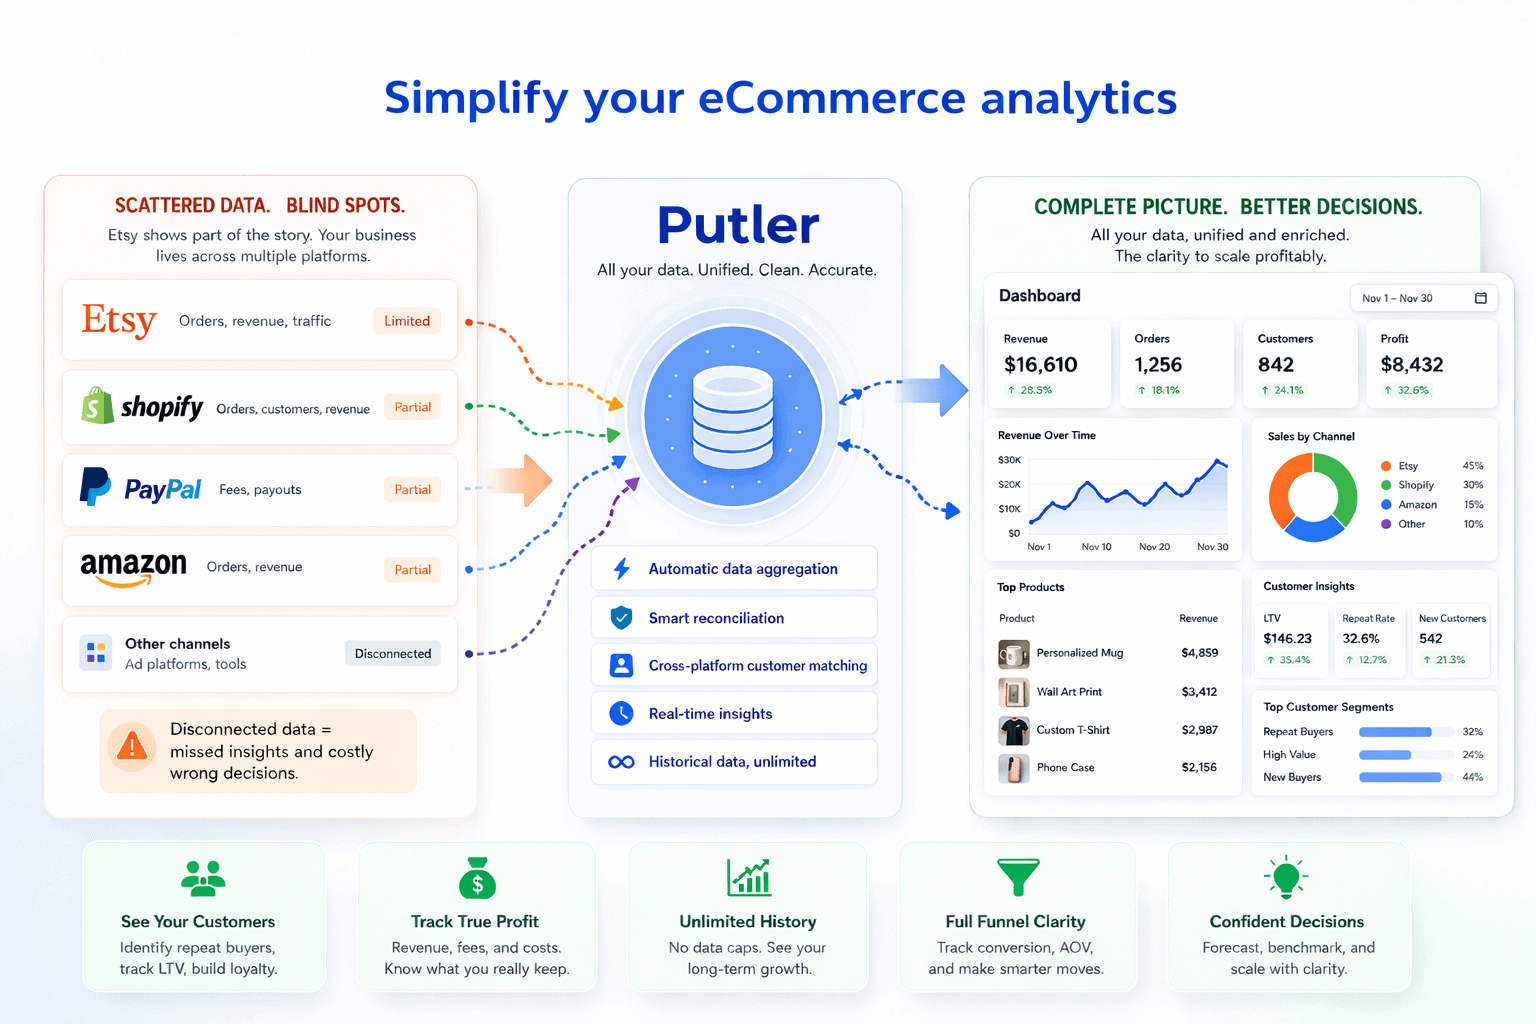
Putler connects directly to Etsy as a data source and pulls transaction data into a consolidated analytics layer that answers the questions Etsy’s dashboard cannot.
For sellers also operating a Shopify store, processing payments through PayPal or Stripe, or selling on Amazon, Putler consolidates all of it into one accurate view with automatic deduplication. One number. One dashboard. No manual reconciliation.
Here is what that unlocks:
eCommerce data consolidation: Putler connects to 17+ sources including Etsy, Shopify, WooCommerce, PayPal, Stripe, Amazon, and more. Every transaction from every source gets merged, deduplicated, and normalised into one revenue number. The multi-platform visibility gap disappears.
Customer profiles: Every buyer gets a unified profile showing their full purchase history, total spend, first purchase date, most recent order, and lifetime value. The customer data Etsy withholds becomes visible at the transaction level.
RFM segmentation: Putler automatically segments your customers into 11 groups based on recency, frequency, and monetary value. You can finally see who your best customers are, who is slipping away, and who needs a win-back offer.
Product analysis: See revenue, refund rates, and performance trends broken down by product across all connected sources. The listings genuinely driving your business become immediately clear, sorted by actual revenue rather than view count.
Sales heatmap: Visualises revenue by hour and day of the week across your full transaction history. Know exactly when your customers buy so you can time promotions, social posts, and sale windows around real purchase patterns.
Transaction management: Full transaction visibility with the ability to process refunds directly. No jumping between platforms to handle a return or investigate a disputed order.
eCommerce web analytics: Connects traffic data to actual revenue so you can see which channels are sending visitors who actually buy, not just visit.
Revenue forecasting: Putler projects revenue and customer growth forward based on historical patterns and churn rates. The backward-only view of Etsy’s dashboard becomes a forward-looking planning tool.
Putler starts at $20 per month for stores up to $10,000 in monthly revenue.
- 10 Best Etsy Analytics Tools That Give Accurate Etsy Reports
- The Ultimate Guide to Mastering Your Etsy Dashboard
- Managing Multiple Etsy Shops: Complete Guide and Expert Tips
- eCommerce Data Consolidation: How Putler Connects and Cleans Data from 17+ Sources
- Your eCommerce Dashboard: One Screen to Replace Five Tabs and Thirty Minutes