Here’s a business truth that changed everything for me, most companies are obsessed with making that first sale, but the real money is in the relationship that comes after.
I learned this lesson when I discovered that Starbucks doesn’t just sell a $5 cup of coffee, they’re actually acquiring a $1500 customer.
Think about it, if a typical customer visits twice a week, spending $5 each time, that’s $520 per year. Over three years, that customer has generated nearly $1500 in revenue.
This is the power of understanding customer lifetime value (CLTV or CLV), the total amount of money a customer will spend with your business throughout your entire relationship.
It’s not just about that first transaction; it’s about all the transactions that follow.
Now, let’s dig deeper into it.
So what exactly is CLV?
Customer lifetime value (CLTV or CLV) is the total revenue a customer will generate for your business throughout their entire relationship with you.
Think of it as the complete financial story of a customer, from their first purchase until their last.
Here’s a simple way to understand it: Imagine you run a coffee subscription service. James signs up and pays $25 per month.
If he stays subscribed for 18 months, his CLV is $25 × 18 = $450. But if you improve your service and keep him for 24 months, his CLV jumps to $600.
That extra $150 per customer can transform your entire business. Here’s why this matters now.
Why customer lifetime value matters in 2026
Here’s why CLTV or CLV has become the most important metric in business:
The CLTV measurement:
- Only 42% of companies can accurately measure CLTV, despite 89% agreeing it’s crucial for brand loyalty.
- 76% of companies think customer lifetime value is an important metric for customer retention.
- At MBNA, a 5% increase in retention grows the company’s profits by 60% by the fifth year.
- The probability of selling to an existing customer is 60-70%, compared to 5-20% for a new prospect.
In 2026, customer lifetime value isn’t just a nice-to-have metric, it’s the foundation of sustainable business growth. So how do you calculate it?
CLV calculation methods & formulas
Let’s break down these calculation methods in a way that actually makes sense for your business.
Historical CLV formula
What it is: Historical CLV looks backward at what customers have already spent.
Example: If customers typically spend $50 per order, buy 6 times per year, and stay for 2 years, CLV = $50 × 6 × 2 = $600.
The Profit-Focused Version
Here’s a slightly more sophisticated approach that factors in your actual profit margins:
CLV = (Average Purchase Value × Gross Margin %) × Purchase Frequency × Customer Lifespan
Using our coffee example with a 40% margin: CLV = ($25 × 0.40) × 12 × 2.5 = $300
Big difference, right? This is why knowing your real profit margins matters when making CLV-based decisions.
Advanced CLV calculation methods
1. RFM-based CLV formula
RFM stands for Recency, Frequency, and Monetary – and it’s like giving each customer a report card based on their shopping behavior.
What RFM measures:
- Recency (R): How recently did they last purchase? (Days since last order)
- Frequency (F): How often do they buy? (Number of purchases in time period)
- Monetary (M): How much do they spend? (Total or average purchase amount)
Example:
Let’s say you’re analyzing three customers:
Customer A:
- Last purchase: 5 days ago (R = 5)
- Purchases this year: 8 (F = 8)
- Average order value: $120 (M = 120)
- CLV = (120 × 8) ÷ 5 × 2 = $384
Customer B:
- Last purchase: 45 days ago (R = 45)
- Purchases this year: 3 (F = 3)
- Average order value: $200 (M = 200)
- CLV = (200 × 3) ÷ 45 × 2 = $26.67
Even though Customer B spends more per order, Customer A is way more valuable because they’re a recent, frequent buyer.
2. Cohort analysis method
Think of cohort analysis as your customer time machine. Instead of looking at all customers as one big group, you group them by when they started their journey with you.
What’s a Cohort? A cohort is simply a group of customers who started doing business with you during the same time period, like all the people who signed up in January 2024.
The Cohort CLV process:
Step 1: Define your cohorts
Group customers by their first purchase month:
- January 2024 cohort: 100 customers
- February 2024 cohort: 150 customers
- March 2024 cohort: 120 customers
Step 2: Track monthly revenue per cohort
Here’s what your January 2024 cohort might look like:
| Month | Active Customers | Revenue | ARPU |
|---|---|---|---|
| Jan | 100 | $5,000 | $50 |
| Feb | 85 | $4,250 | $50 |
| Mar | 72 | $3,600 | $50 |
| Apr | 65 | $3,250 | $50 |
Step 3: Calculate Cohort CLV
Sum up the total revenue per customer over their lifetime:
Cohort CLV = $50 + $50 + $50 + $50… = $X per customer
3. Predictive models
What it is: Predictive CLTV uses machine learning and statistical models to forecast future customer behavior.
What goes into predictive models:
- Purchase history and patterns
- Customer demographics and behavior
- Seasonality and market trends
- Product usage data
- Customer support interactions
- External economic factors
The advanced approach: Instead of simple multiplication, predictive models use algorithms like:
- Beta Geometric/Negative Binomial Distribution (BG/NBD)
- Markov Chain models
- Machine learning algorithms that adapt over time
Time to see this working.
Step-by-step CLV calculation with examples
I’ve done these calculations countless times for different types of businesses, and let me tell you – there’s nothing quite like that “aha!” moment when the numbers suddenly make perfect sense. So grab a coffee, open up a spreadsheet, and let’s dive in.
eCommerce business scenario
Meet “ThreadCraft” – our example business
Let’s say you run ThreadCraft, an online clothing boutique specializing in sustainable fashion. You’ve been in business for 2 years and want to calculate CLTV to make smarter marketing decisions.
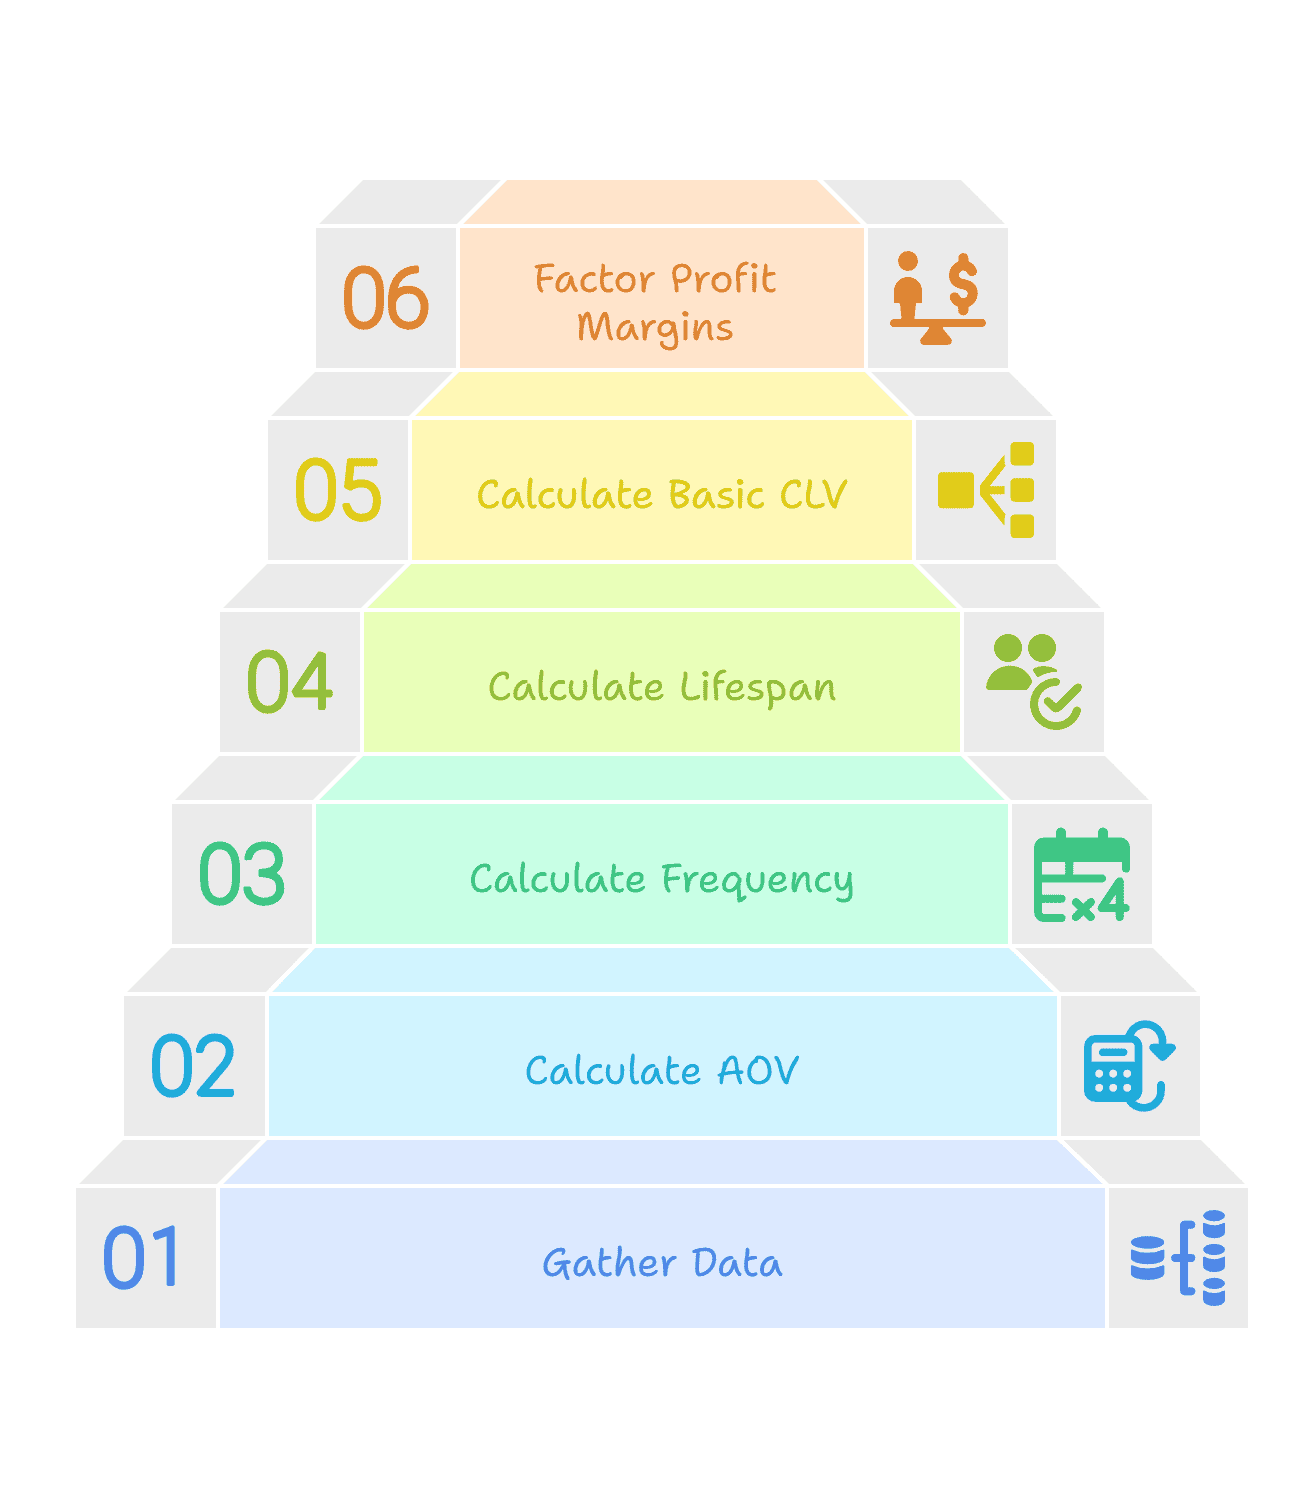
Step 1: Gather your data
First things first – you need to collect the raw numbers. Here’s what ThreadCraft’s data looks like from the past 12 months:
Business metrics:
- Total customers: 2,000
- Total orders: 4,800
- Total revenue: $240,000
- Active customer period: 18 months (average relationship length)
Step 2: Calculate average order value (AOV)
This one’s straightforward – how much does the average customer spend per order?
ThreadCraft’s calculation: AOV = $240,000 ÷ 4,800 orders = $50 per order
Step 3: Calculate purchase frequency
How often do customers come back to buy from you?
ThreadCraft’s calculation: Purchase Frequency = 4,800 orders ÷ 2,000 customers = 2.4 purchases per customer per year
This tells us that customers are buying from ThreadCraft about every 5 months, which is pretty typical for clothing.
Step 4: Calculate customer lifespan
How long do customers typically stick around? Since ThreadCraft’s been tracking customers for 18 months, we’ll use that as our customer lifespan.
Customer lifespan = 18 months = 1.5 years
Step 5: Calculate basic CLV
Now we bring it all together with the classic eCommerce formula:
ThreadCraft’s final calculation: CLV = $50 × 2.4 × 1.5 = $180 per customer
Step 6: Factor in profit margins (Advanced)
But wait – we should really look at profit, not just revenue. ThreadCraft has a 40% gross margin on their products.
Profit-adjusted CLV: $180 × 0.40 = $72 per customer
What this means for ThreadCraft
- They can spend up to $72 to acquire a customer and break even.
- If their current customer acquisition cost is $30, they’re making a $42 profit per customer.
- They should focus on increasing purchase frequency (maybe seasonal collections?) or extending customer lifespan (loyalty program?).
Application: ThreadCraft decides to launch a loyalty program that costs $15 per customer to run. Since it typically increases purchase frequency by 20%, their new CLV becomes: CLV = $50 × (2.4 × 1.20) × 1.5 × 0.40 = $86.40 per customer
The program pays for itself and adds $14.40 in profit per customer!
You don’t have to calculate CLV manually every time — there are plenty of tools that can do it for you.
But there’s an easier way.
What are the best tools and technologies for tracking CLV?
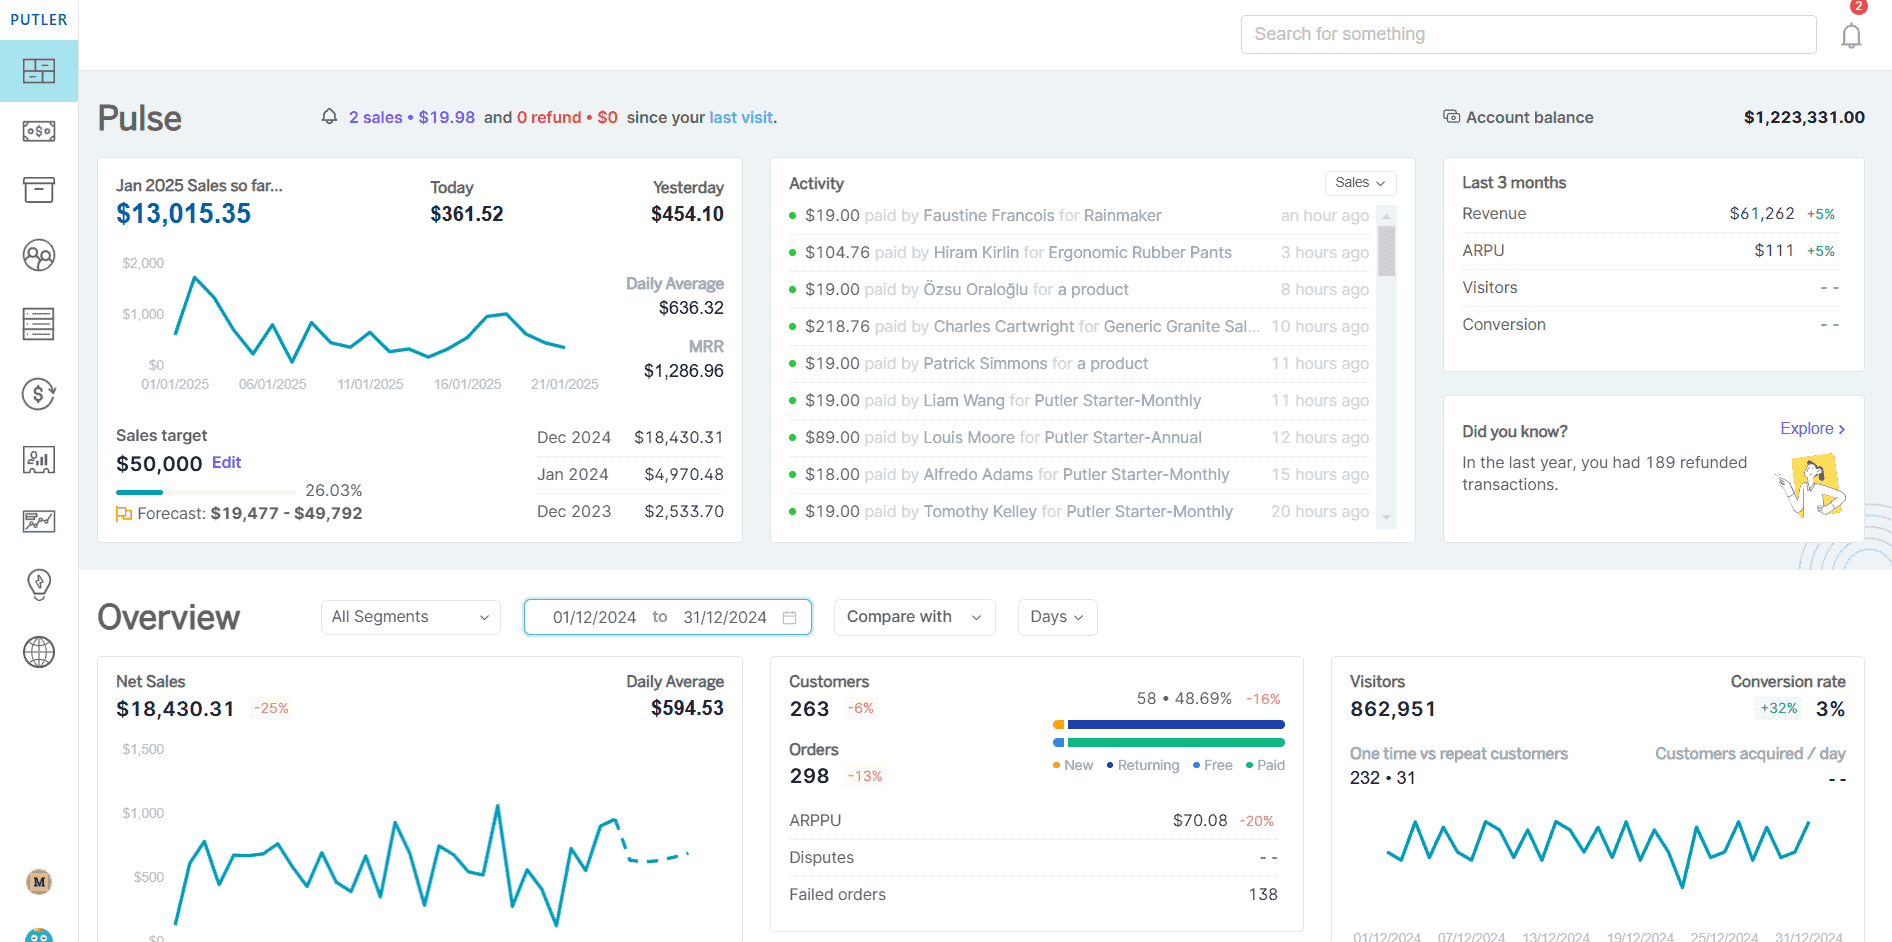
Putler is a multichannel eCommerce analytics platform.
Putler not only empowers you with eCommerce intelligence but also delivers SaaS, web analytics, forecasting capabilities, and much more to help you understand and grow your business.
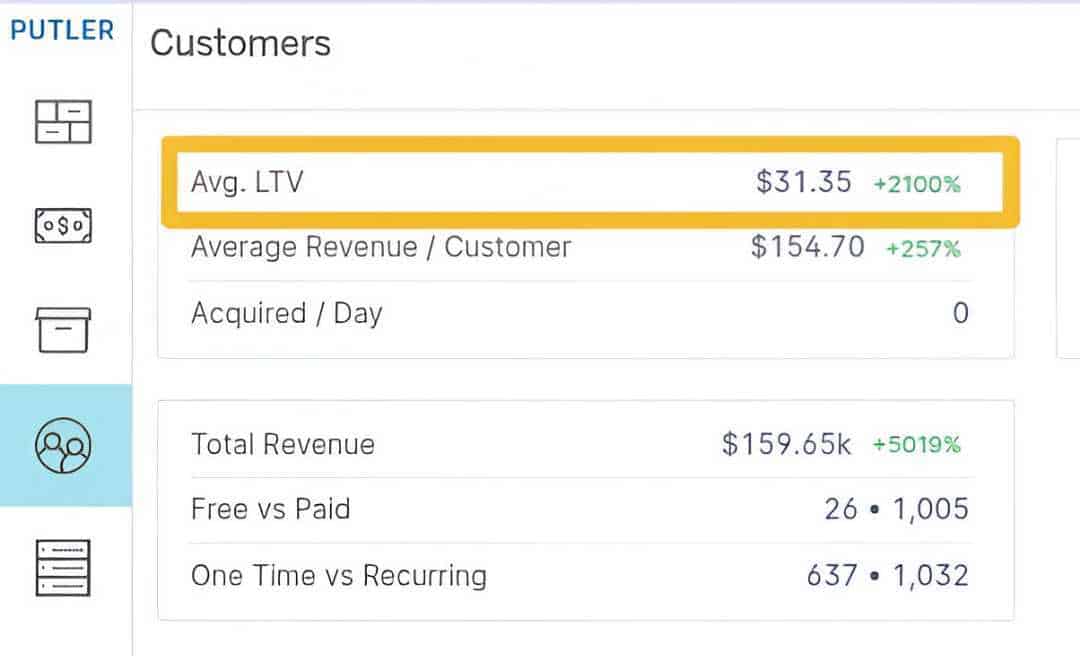
Here’s how you can track CLV using Putler.
You can see the average CLTV in your Putler Customer Dashboard.
How to find your potential high CLV customers using Putler.
- Go to the Customer Dashboard in Putler.
- Click the filter icon (top-left corner).
- Under Revenue Contribution, select the bottommost, i.e., highest value.
- Or under Total Orders, select the bottommost, i.e., highest value.
- Under Customer Since, select >= 2 years (or a timeframe that fits your business).
- Under Customer Type, select Returning Customers.
- Once you have selected these filters, Putler matches these rules, processes the data, and gives you the exact list of Customers in a list view. These are your High CLV Customers.
- You can then export this list and use the strategies mentioned below.
Next, once you have your High CLV Customer list, get into action:
- Make it personal. Send tailored offers based on previous purchases — personal touches lead to more sales.
- Roll out the VIP treatment. Reward your best customers with exclusive discounts or early access — VIPs tend to spend more.
- Suggest smart upgrades. Upsell and cross-sell complementary products to boost each order’s value.
- Keep your brand top of mind. Use retargeting ads aimed at high-CLV customers to encourage repeat purchases.
- Be there when they need you. Provide exceptional customer support — happy customers buy more and stay loyal longer.
Putler doesn’t stop at tracking your CLV; it gives you the tools to optimize it. Now let’s maximize that CLV.
How Putler helps improve customer lifetime value
Okay, so you’ve done the math and you know what your customers are worth.
But here’s where most businesses hit a wall, knowing your CLV is one thing, but actually doing something about it? That’s a whole different thing.
This is where Putler really shines. It’s not just sitting there showing you numbers on a dashboard, it’s actively helping you squeeze every drop of value out of those customer relationships.
The first step to CLV mastery? Getting to know your customers on a whole different level through smart segmentation.
Smart customer segmentation
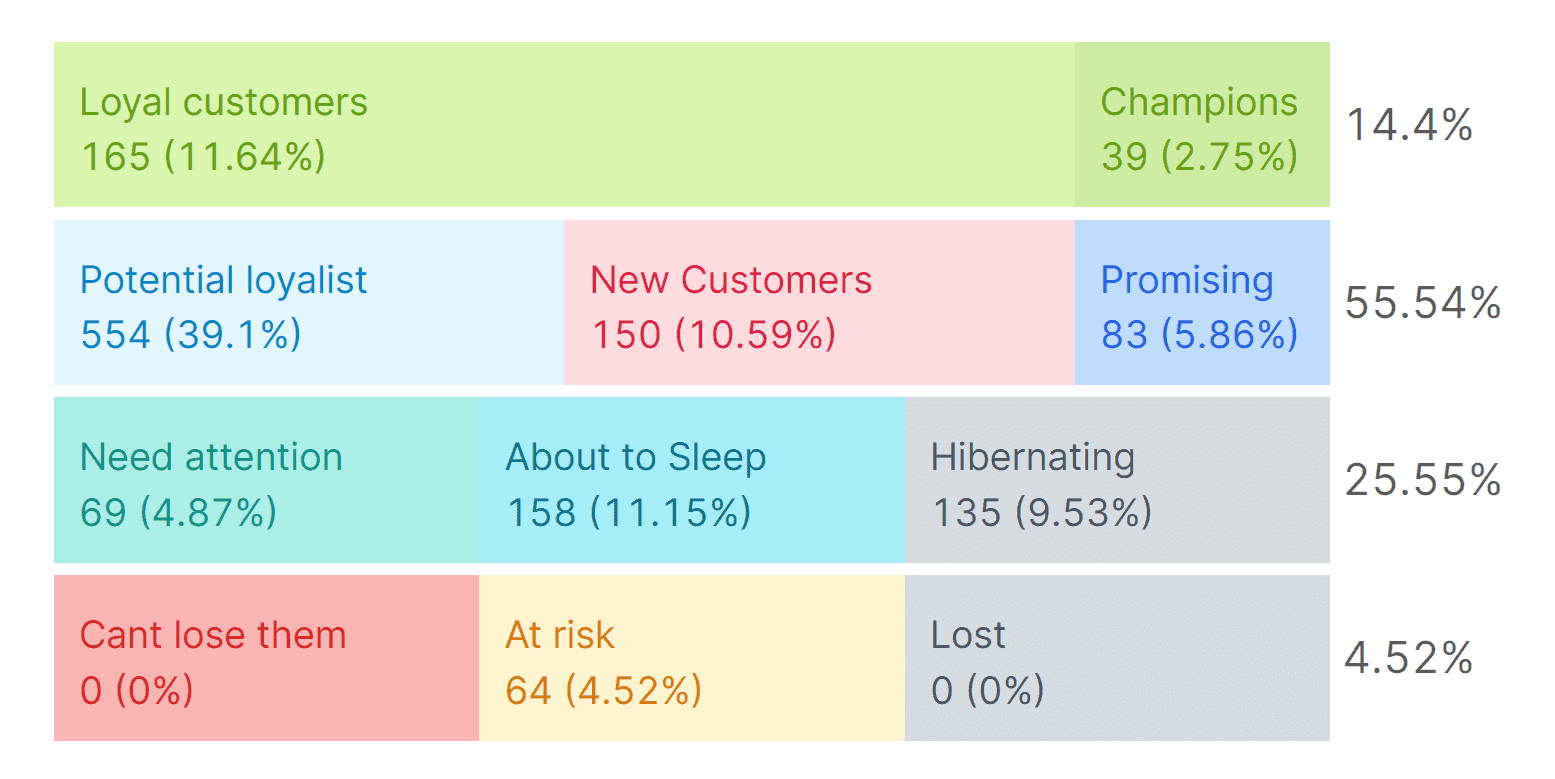
Putler’s RFM (Recency, Frequency, Monetary) analysis automatically organizes your customers into meaningful groups based on their buying behavior.
Instead of guessing who your best customers are, you get clear data showing which customers buy frequently, spend the most, and engage regularly.
Understanding your omnichannel presence
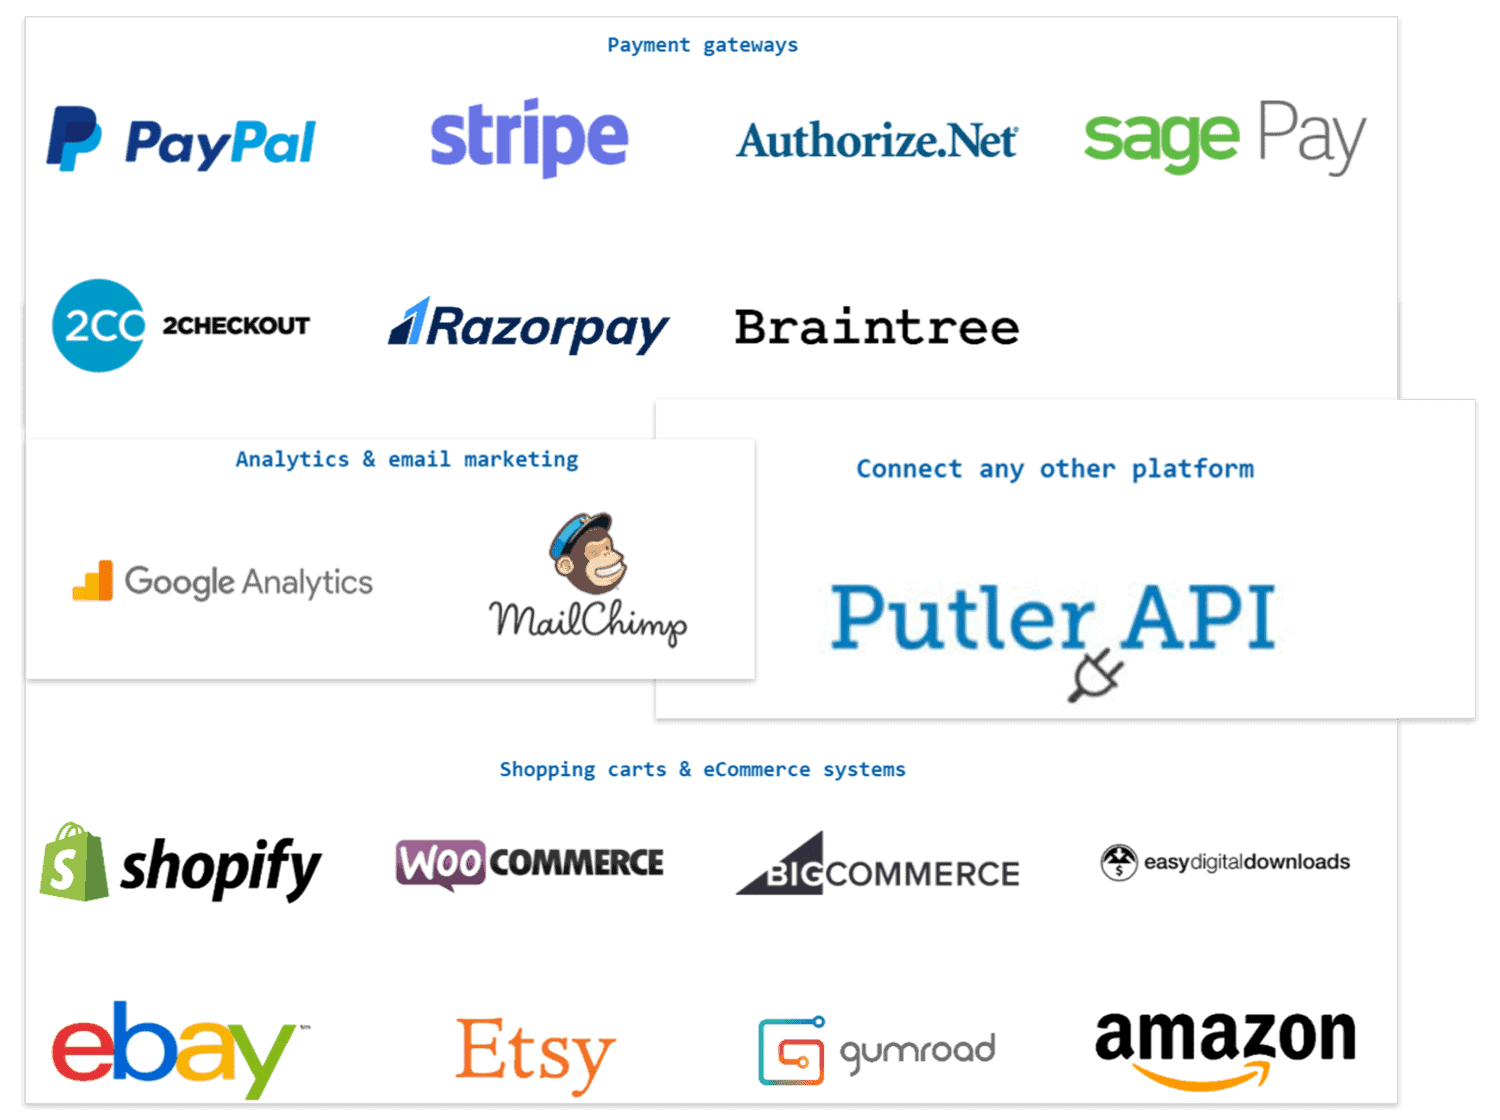
Putler integrates with 17+ platforms to give you a complete view of how customers interact with your brand across different channels.
This knowledge helps you invest your time and resources in the channels that actually matter to your customers, improving their overall experience.
Comprehensive analytics that actually make sense
With over 200+ metrics and reports, Putler provides the complete picture you need to make smart decisions about your customer lifetime value.
Instead of drowning in spreadsheets, you get clear, actionable data that shows what’s working, what’s not, and exactly where to focus your efforts for maximum impact.
Growth-focused features that drive results
Putler goes beyond tracking to actively help you improve CLV:
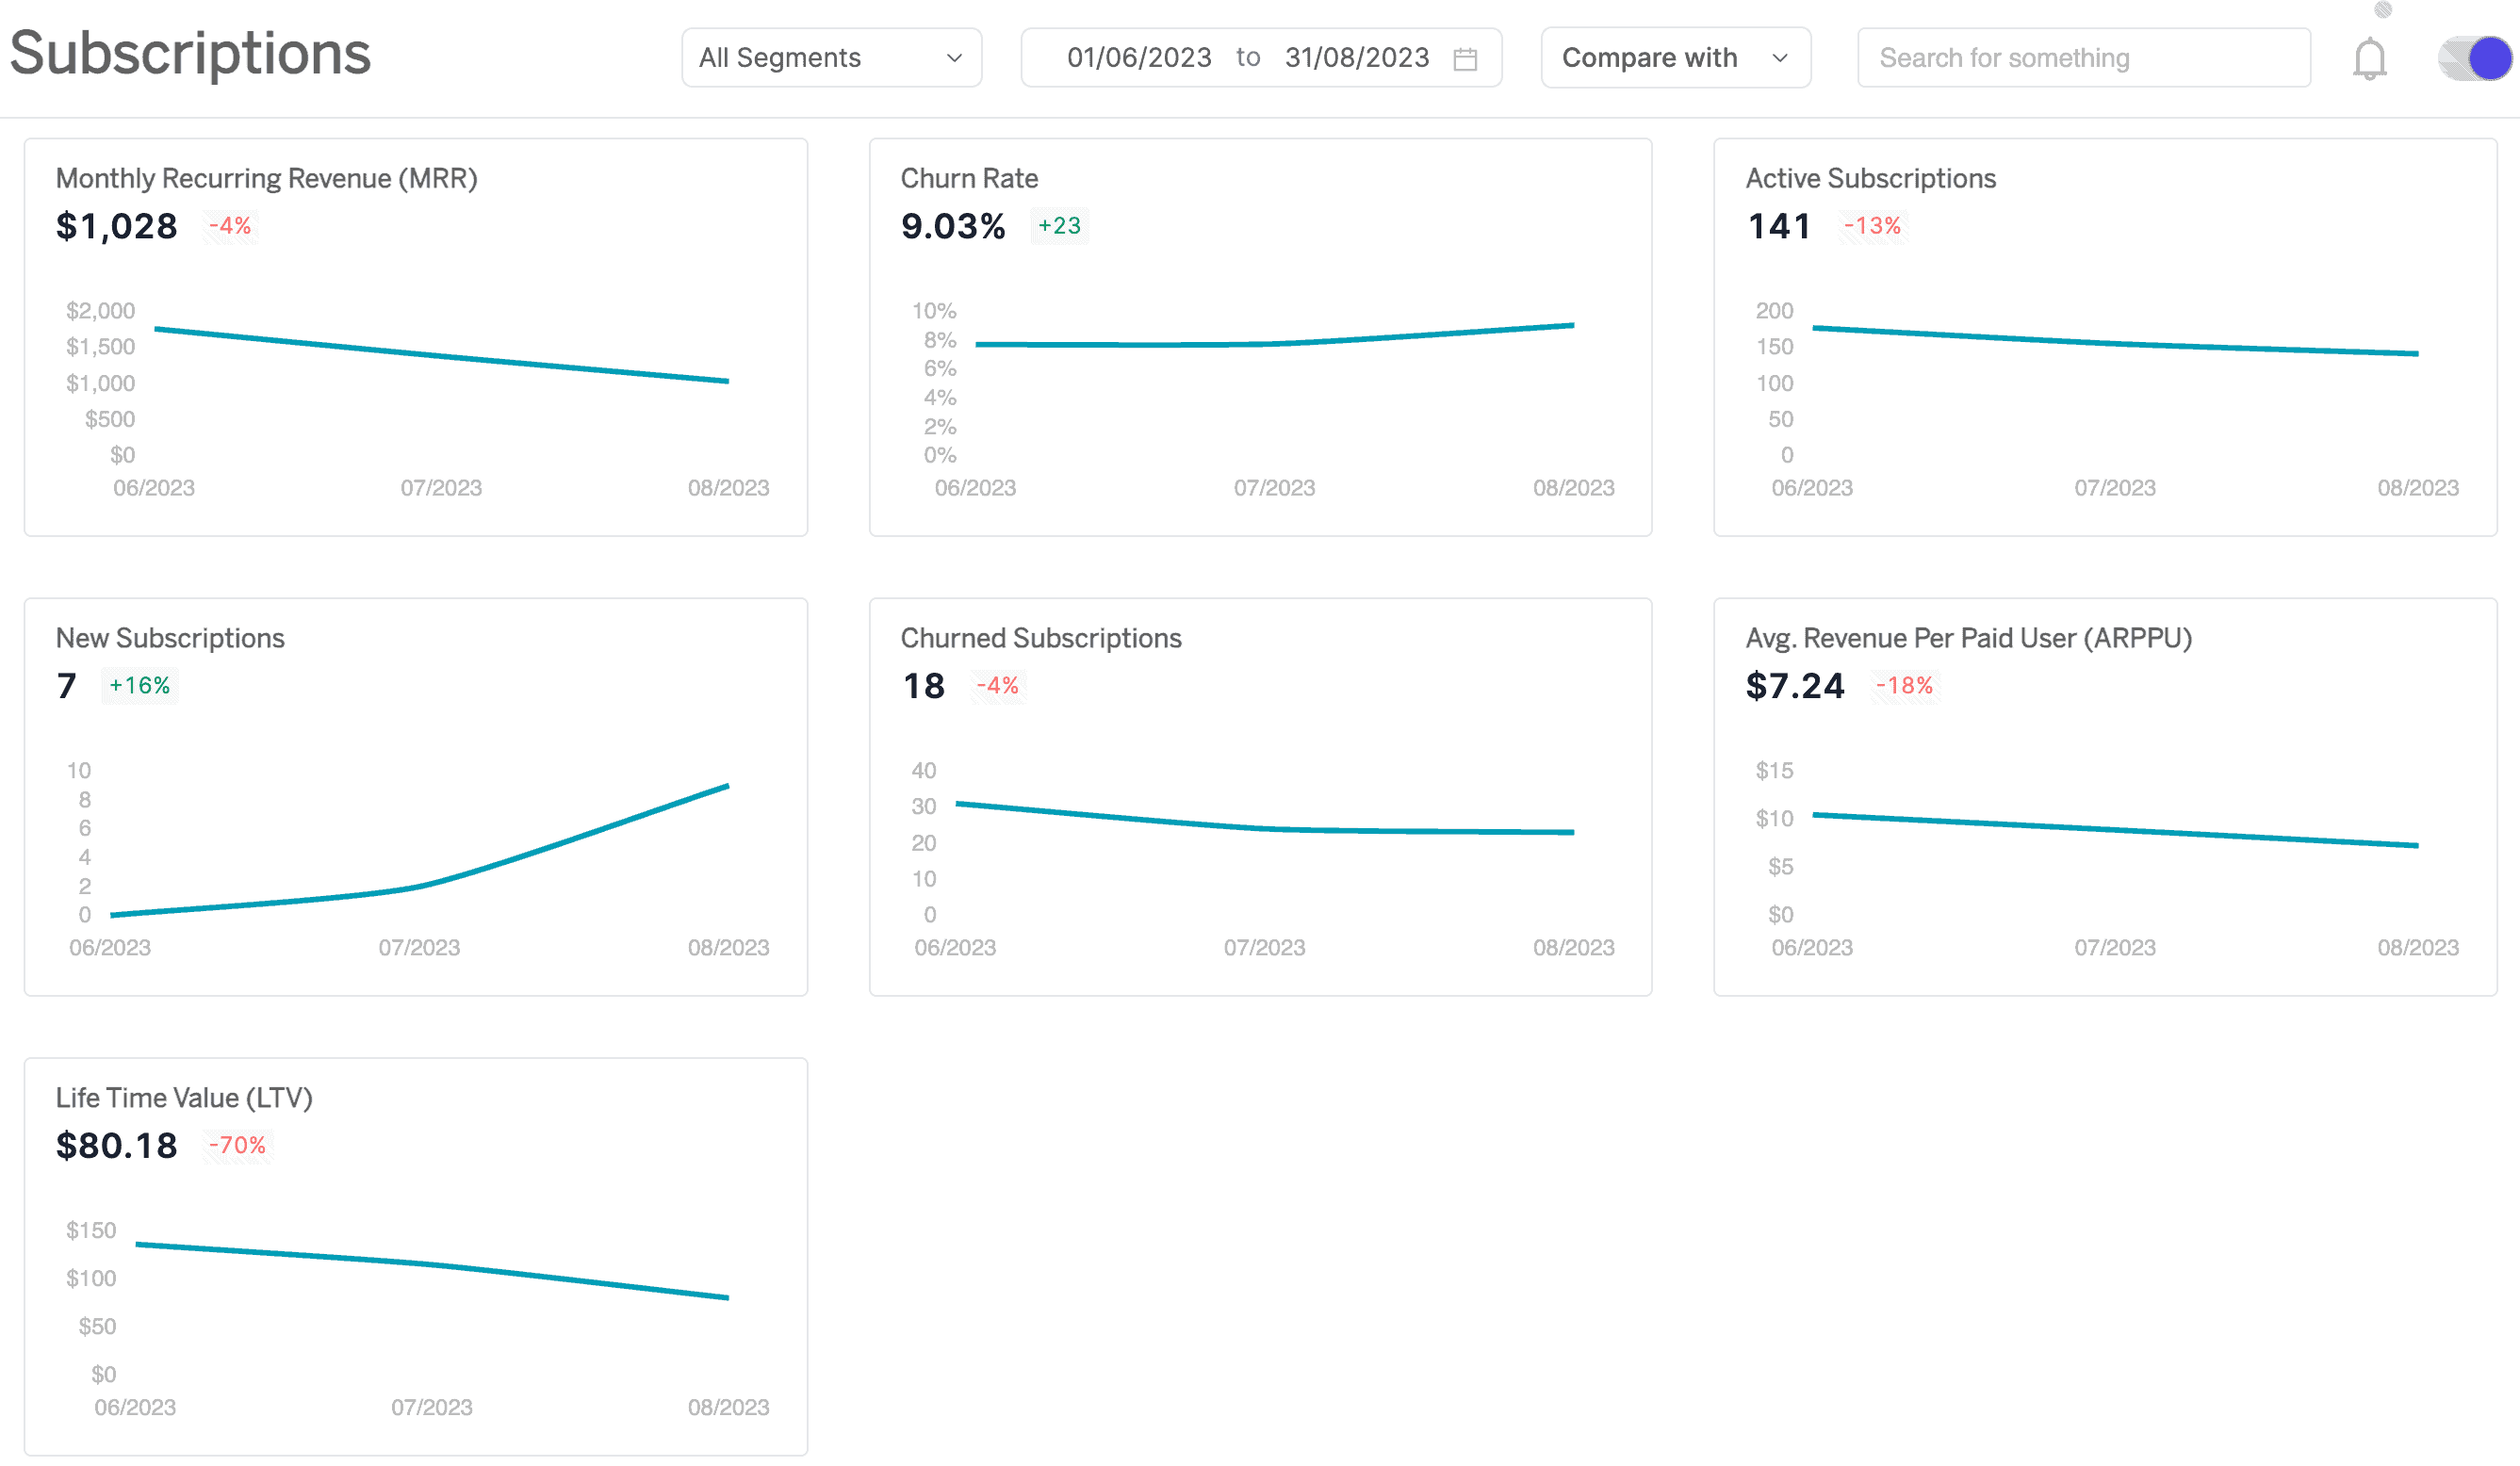
- A subscription dashboard that keeps CLV visible alongside other critical business metrics.
- Personalized growth recommendations based on actual customer behavior patterns.
- Visitor monitoring that reveals exactly how people move through your customer journey.
The real power of Putler isn’t just in measuring your customer lifetime value – it’s in turning that measurement into a strategic advantage.
You get the insights you need to keep customers engaged, increase their spending, and transform them into loyal advocates who stick around for the long haul.
Here’s how to execute this.
How to Improve Customer Lifetime Value
Understanding your customer lifetime value starts with recognizing that every customer goes through predictable stages.
The 5 customer lifecycle stages
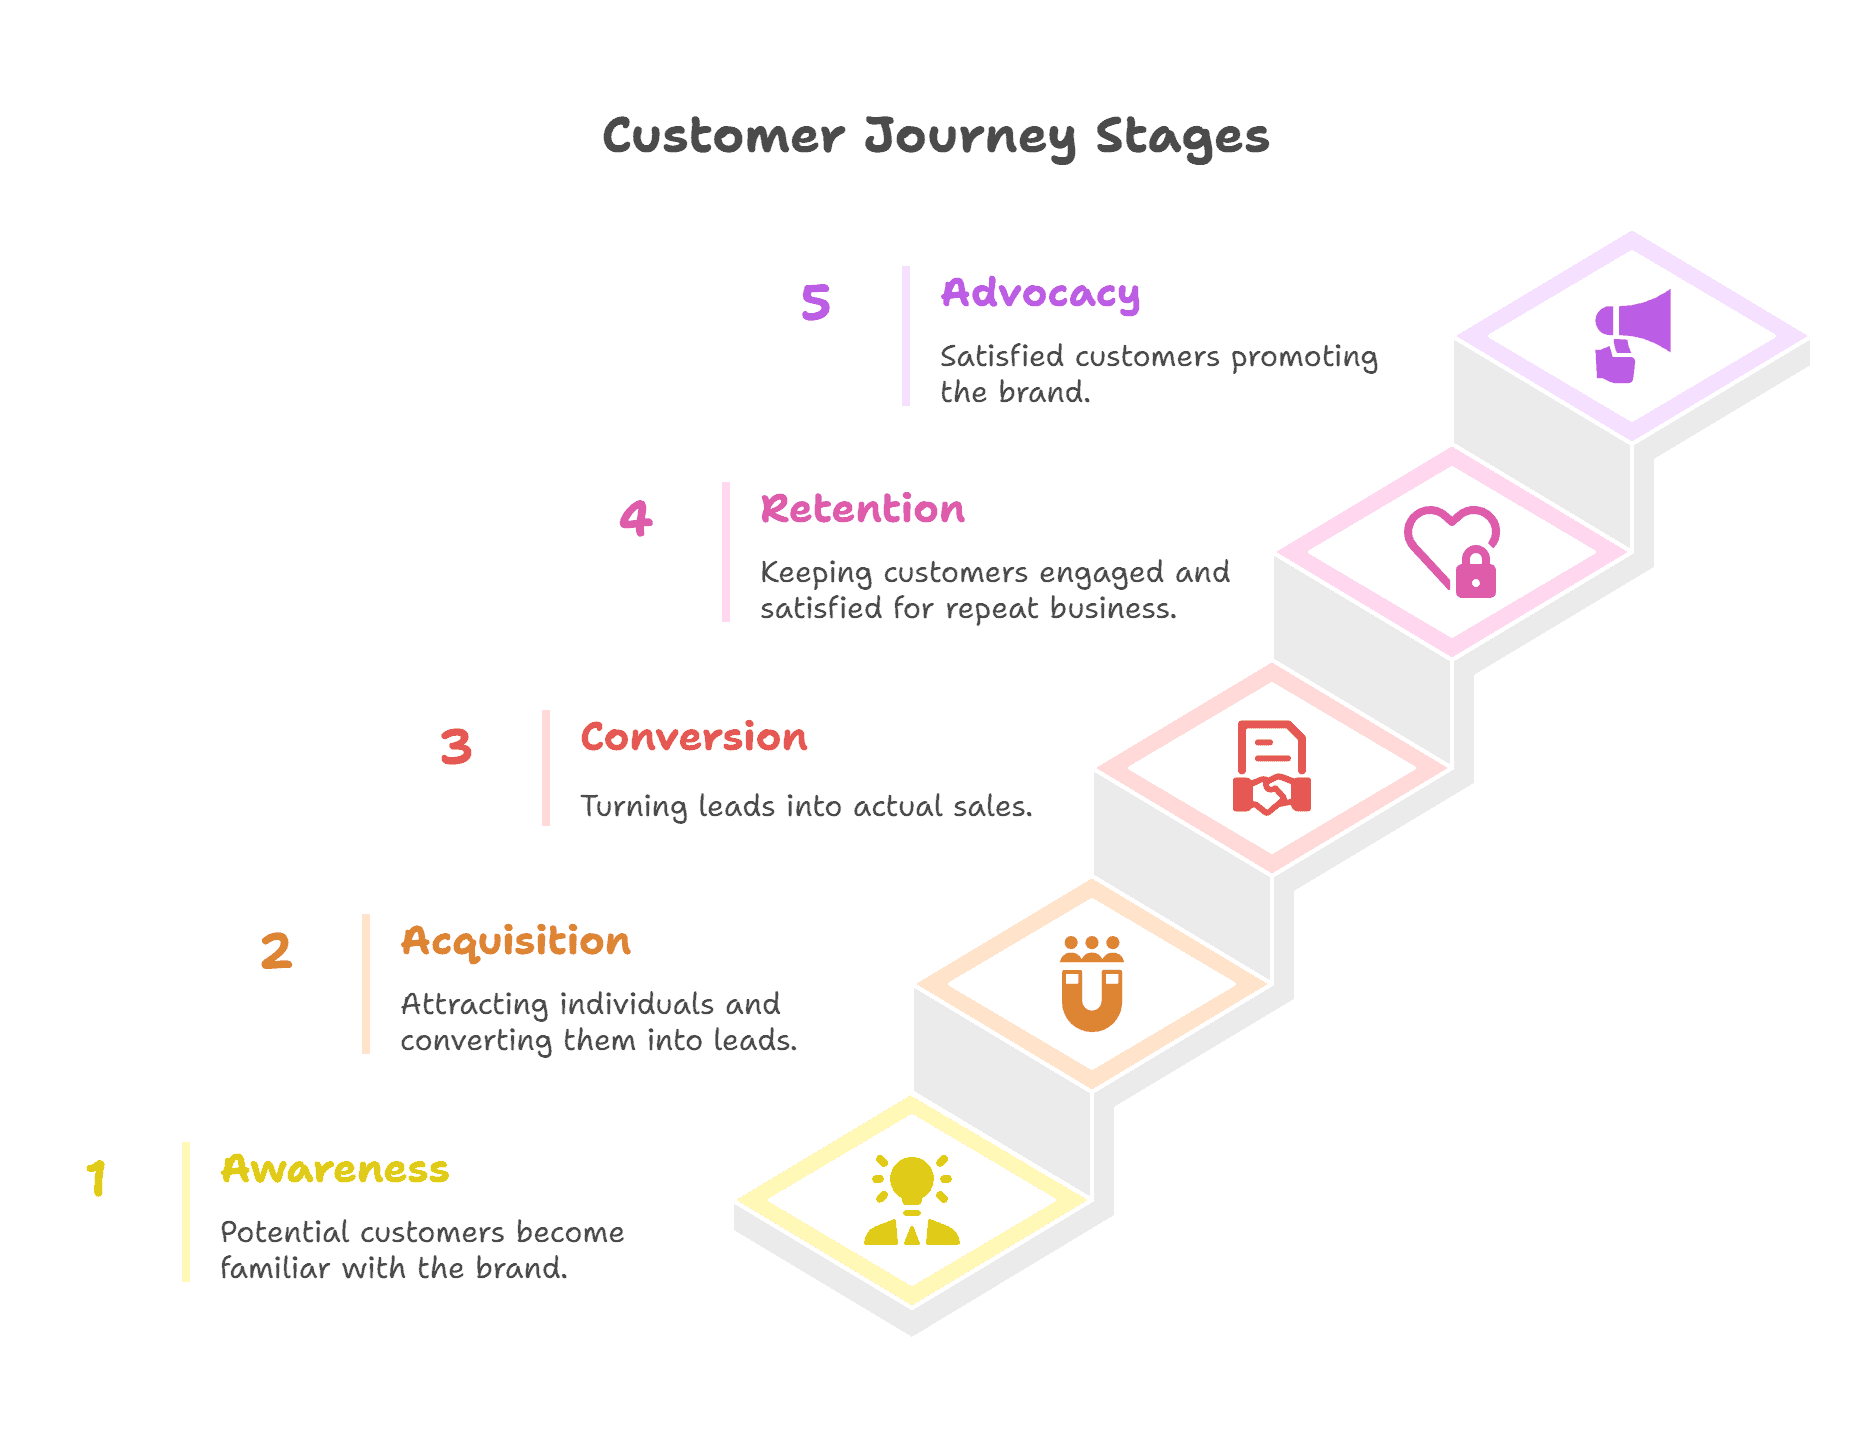
Awareness: Your potential customer first discovers your brand through marketing, word-of-mouth, or search. They know you exist but aren’t ready to buy yet.
Acquisition: They’re interested enough to engage – maybe they sign up for your newsletter, download a guide, or request more information about your product.
Conversion: This is the moment they actually become a paying customer by making their first purchase with you.
Retention: Now the real work begins – keeping them happy, engaged, and coming back for more purchases over time.
Advocacy: Your happiest customers become your biggest fans, referring others and essentially becoming your unpaid marketing team.
How to improve CLV at each stage
To improve CLV, it’s crucial to work on every stage of the customer journey.
Awareness stage improvements
Focus on attracting the right people, not just more people.
Create content that speaks to your ideal customers’ pain points and positions you as the helpful expert. The better quality leads you to attract here, the higher your eventual customer lifetime value will be.
Acquisition stage improvements
Make it ridiculously easy for interested prospects to take the next step. Offer genuine value in exchange for their contact info – think free tools, helpful guides, or trial periods.
The smoother this experience, the more positive their first impression becomes.
Conversion stage improvements
Remove every possible friction from your buying process.
Multiple payment options, clear pricing, strong social proof, and responsive customer support during the purchase decision all contribute to not just getting that first sale but setting the stage for a long-term relationship.
This is where the customer lifetime value magic really happens.
Deliver exceptional post-purchase experiences, implement proactive customer success programs, and create loyalty rewards that actually matter to your customers. Remember, retained customers spend 67% more over time than new ones.
Advocacy stage improvements
Turn your best customers into your growth engine.
Create referral programs that benefit everyone, ask for testimonials at the right moments, and build a genuine community around your brand. Advocates don’t just stick around longer – they bring in new customers at a fraction of your usual acquisition costs.
The key insight? Each stage builds on the previous one. Improve your foundation, and your customer lifetime value grows naturally as customers progress through their journey with you.
Conclusion
Customer lifetime value isn’t something that just happens to your business – it’s something you can actively improve.
The key is understanding that customers move through five distinct stages, and each stage offers specific opportunities to increase their long-term value.
Start by focusing on one stage at a time. Maybe improve your onboarding process or create a better referral program. Small improvements at each stage add up over time.
FAQs
Q1. Does Putler offer LTV insights?
Yes, Putler’s Customer dashboard offers in-depth LTV insights – information on customers, products purchased, RFM analysis, and more.
Q2. What are some common LTV mistakes to avoid?
Some mistakes you can avoid are – understanding LTV calculator, misaligning LTV with business goals, inaccurately segmenting customers, setting unrealistic CLTV numbers, and neglecting business scalability.
Q3. Will an Annual Billing Cycle improve LTV?
An annual billing cycle certainly helps. You can offer better value and service to customers who stay invested for a longer time. This also ensures predictable revenue.
Q4. What is a good CLV to CAC ratio?
A healthy CLV to CAC ratio is at least 3:1, meaning the lifetime value of a customer should be three times the cost of acquiring them. Falling below this ratio puts long-term sustainability at risk, while ratios above 5:1 may indicate underinvestment in growth.
Q5. How does customer experience impact CLV?
Customer experience has a direct impact on lifetime value. Customers who rate an experience 5 out of 5 stars are more than twice as likely to buy again, and 80% of satisfied consumers will spend more. Improving CX can significantly boost CLV, and tools like Putler help you track how customer behavior impacts lifetime value over time.
Q6. What is the average CLV for ecommerce businesses?
Most ecommerce businesses see customer lifetime values between $100 and $300, though this varies significantly by category. Businesses that invest in strong retention and personalization strategies often achieve 2–3x higher CLV. With tools like Putler, you can track these improvements and identify what drives higher lifetime value.
- Customer Retention: The Ultimate Guidebook to Reduce Customer Churn
- Customer Retention Strategies: Proven Tactics to Keep Customers Coming Back
- Different Types of Churn Rate & How to Calculate It
- Best eCommerce Analytics Software for Business Success in 2025
- Top 45+ eCommerce Metrics & KPI to Measure Health of Business
- MRR vs ARR – Which is the right metric for your SaaS business?