
Google Analytics tells you 50,000 people visited your site last month. Shopify tells you revenue was $38,000. But try connecting those two numbers and you hit a wall.
Which traffic source actually drove purchases? Which pages bring visitors who buy versus visitors who bounce? Which keywords generate revenue, not just clicks? GA can’t tell you, because it doesn’t know your transaction data. And your eCommerce platform can’t tell you, because it doesn’t know your traffic data.
So you end up optimizing for the wrong things. You celebrate a blog post getting 10,000 visits without realizing it generated zero sales. You ignore a product page with 500 visits that converts at 6%. You pour ad budget into the channel with the most clicks instead of the one with the most revenue per visitor.
The traffic-to-revenue gap is one of the most expensive blind spots in eCommerce. This is exactly the problem that proper eCommerce web analytics is supposed to solve.
Putler closes it from two angles: a built-in web analytics tool that works without Google Analytics, and an Audience layer that connects your GA and Search Console data to actual transaction data.
Here’s how both work.
Angle one: eCommerce web analytics without the Google dependency
Not everyone wants to run Google Analytics. Maybe you’re concerned about privacy regulations. Maybe you’re tired of the complexity of GA4. Maybe you just don’t want third-party cookies on your site and consent banners cluttering the experience.
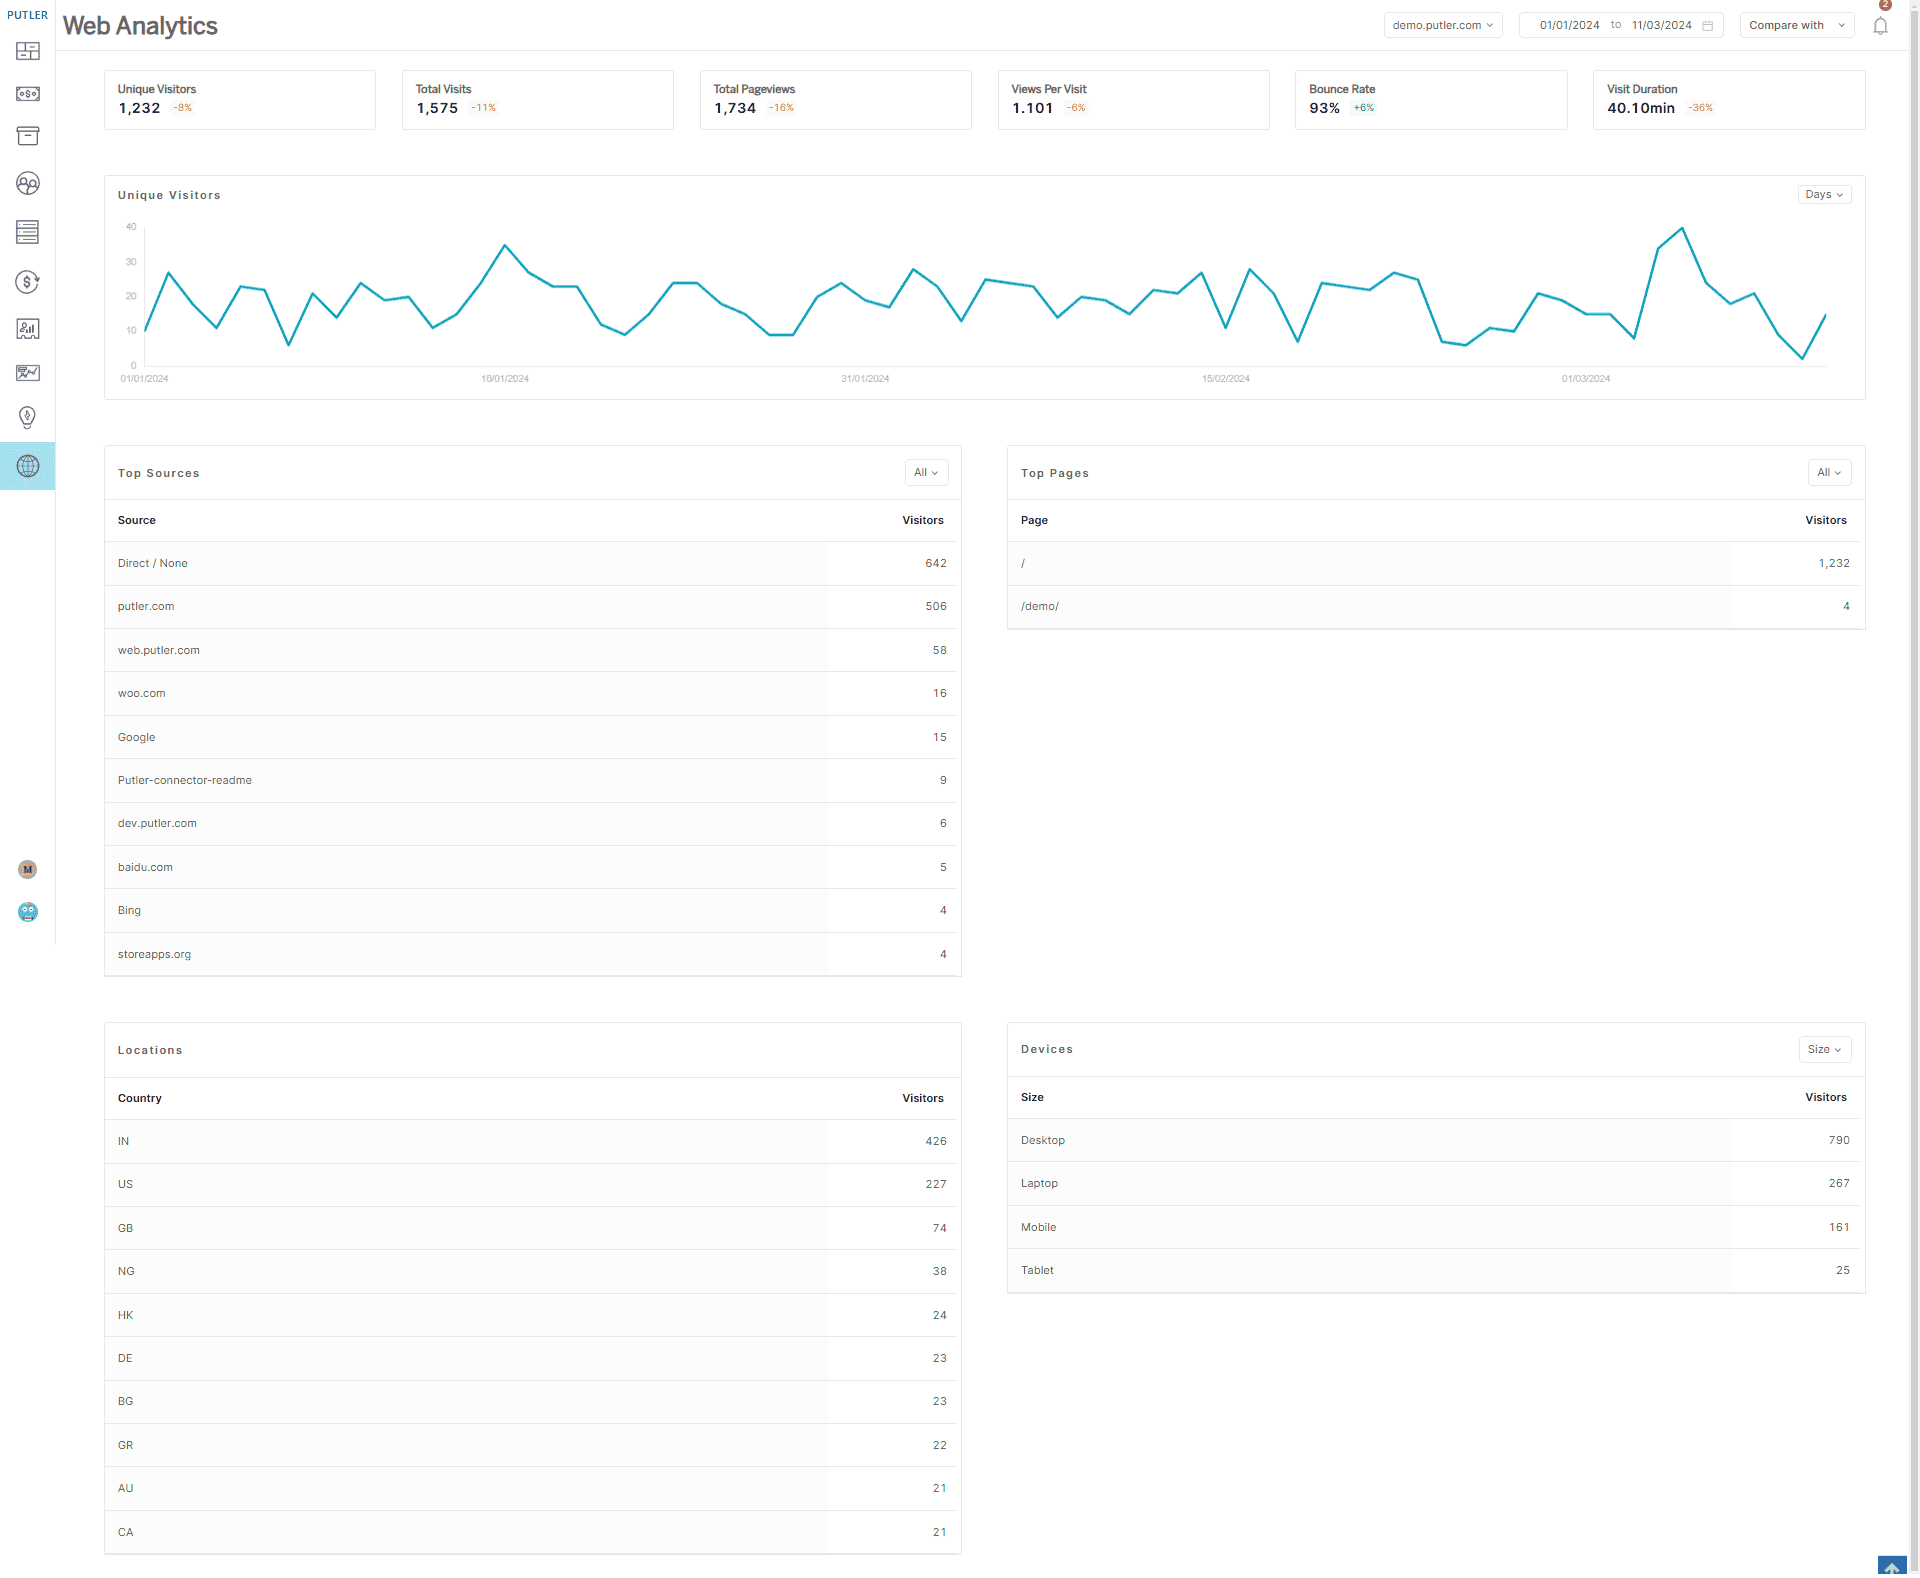
Putler’s built-in Web Analytics dashboard is a standalone alternative. Add your domain, set your timezone, and you’re tracking. About 30 seconds of setup.
What you get:
Unique visitors and total pageviews: The basics, but accurate. No sampling, no cookie-dependent counting. You see exactly how many people visited and how many pages they viewed for any date range.
Bounce rate and visit duration: How engaged are visitors once they land? A high bounce rate on your product pages tells a different story than a high bounce rate on your blog. This metric helps you figure out which pages are working and which ones are losing people.
Traffic sources: Where visitors are coming from. Organic search, social, direct, referrals, campaigns. When you know that Twitter drives visits but no sales, while email drives fewer visits but higher conversion, your budget allocation changes.
Top pages, countries, channels, and devices: Slice your traffic by what matters. If 60% of your visitors are on mobile but your checkout is optimized for desktop, you’ve found the leak. If most of your traffic comes from Germany but your site is only in English, there’s an opportunity.
UTM tracking: Tag your campaigns and see exactly which ones drive traffic. Not just “social media” as a bucket, but “the specific Instagram story link from Tuesday’s promotion.”
Real-time activity: Current users on your site and what pages they’re viewing, live. Useful during a product launch or flash sale when you want to see the impact as it happens.
Custom reports: Filter by pages, countries, or devices and export to CSV.
All of this runs privacy-first. No third-party cookies. No personal data collection. No consent banner required. And because the tracking script is lightweight, it doesn’t slow down your site.
For store owners who want clean eCommerce web analytics without the GA overhead, this dashboard handles it.
Angle two: connecting GA and Search Console to your actual revenue
If you do use Google Analytics, Putler doesn’t replace it. It makes it useful.
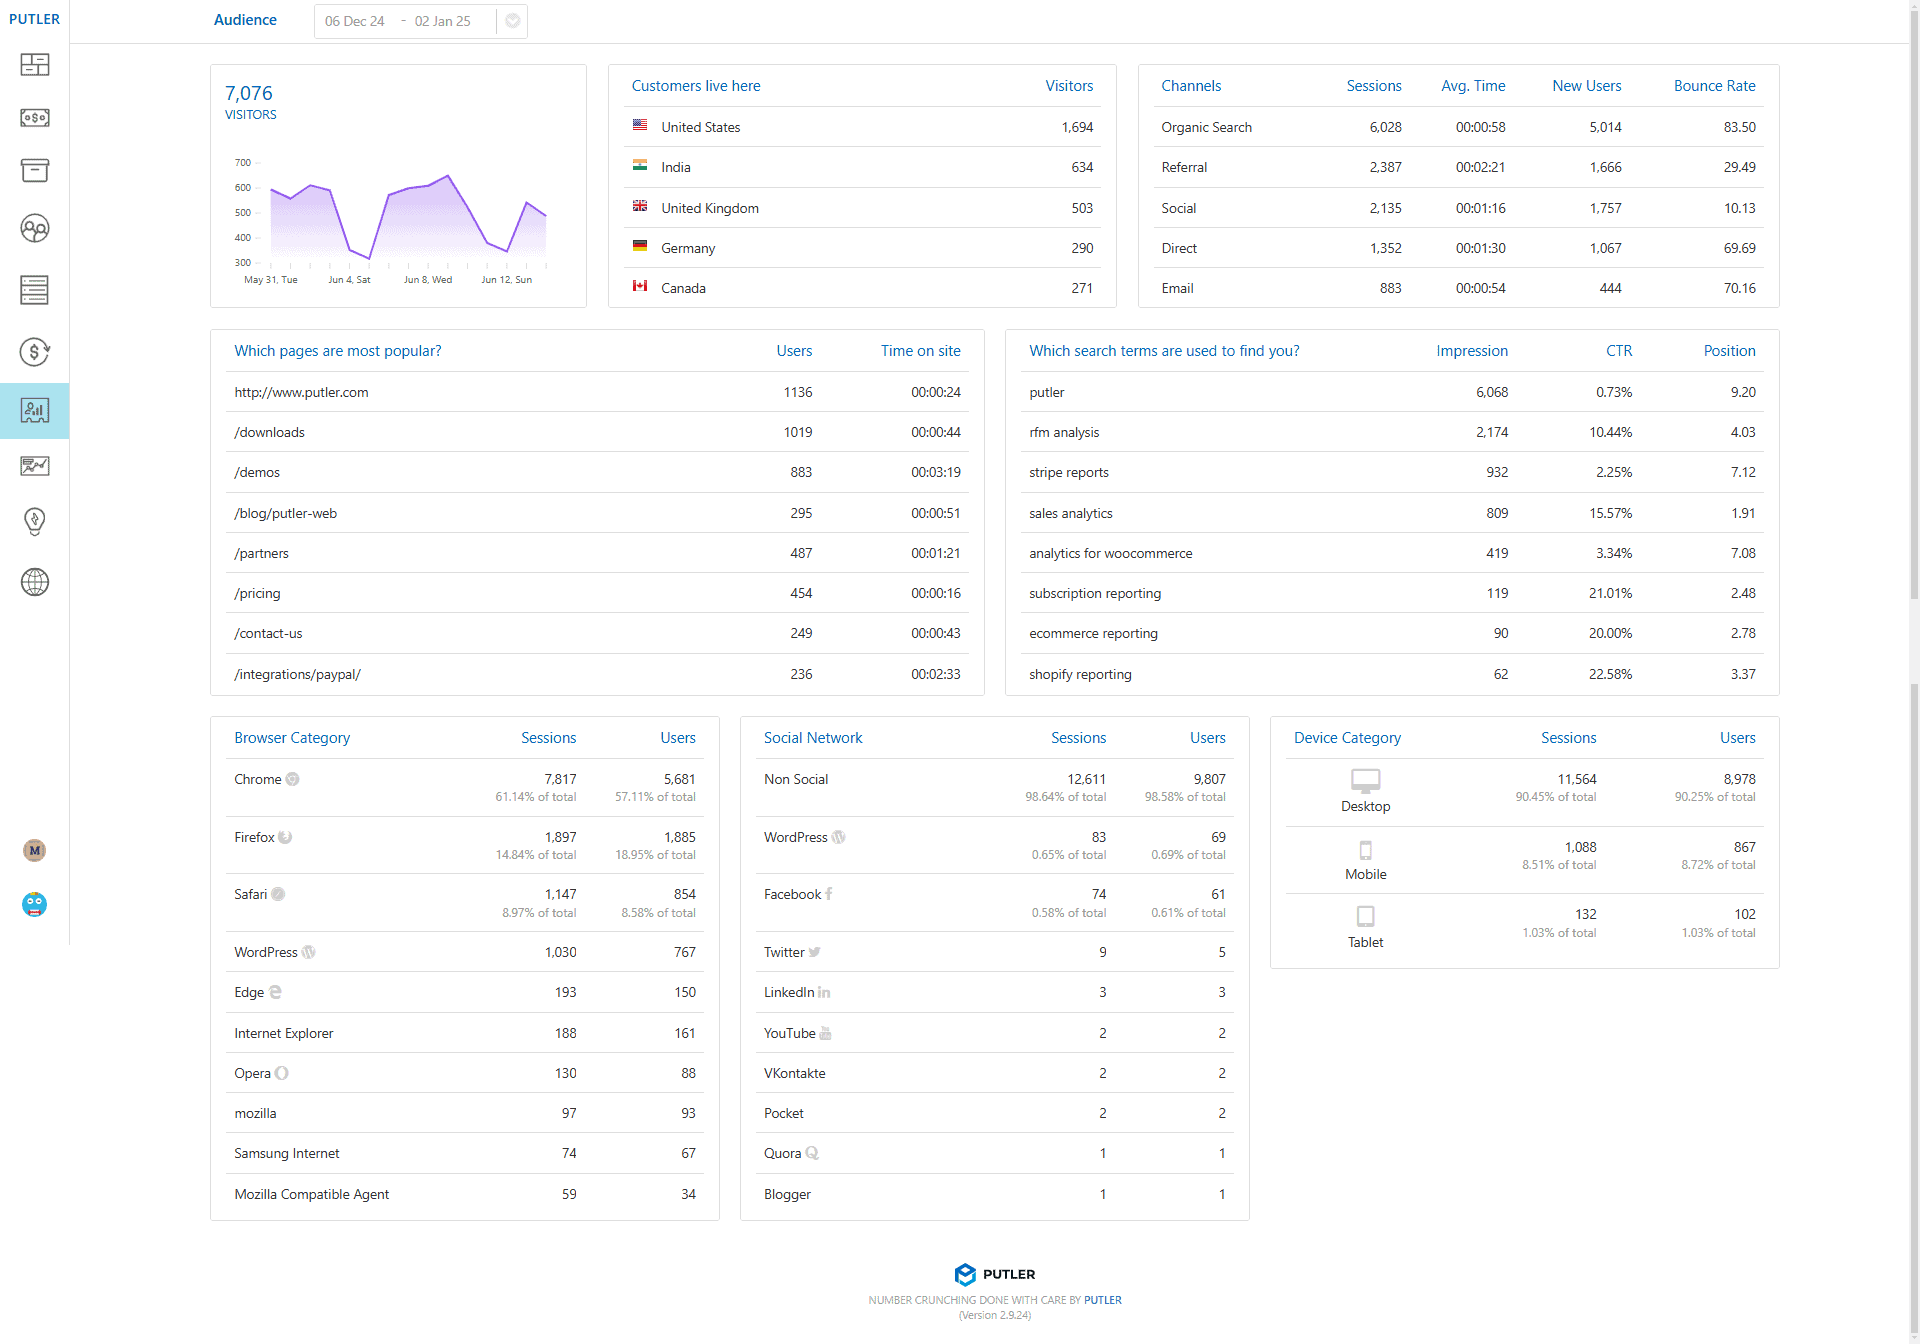
The Audience Dashboard pulls in your GA and Search Console data and correlates it with your actual transaction data from Putler. This is the connection that GA alone can’t make — and the one that separates basic traffic reporting from real eCommerce web analytics.
Here’s what that looks like in practice:
Total visitors alongside actual revenue: Not just “50,000 visits” but “50,000 visits that generated $38,000 in revenue.” The two numbers sit next to each other for the first time.
Sales per visitor: Total sales for the date range divided by total visitors. If your ratio is $0.76 per visitor, you have a concrete number to optimize against. Run a new campaign? Check if the sales-per-visitor ratio went up or down. That’s a more honest metric than traffic volume alone.
Conversion percentage: Customers divided by visitors. Your site had a 3% conversion rate last month, meaning 3 out of every 100 visitors actually bought something. This is the number that ties your marketing spend to actual outcomes.
Top pages by traffic: Which pages get the most visits. But here’s where it gets interesting: when you can see traffic alongside revenue data, the page with 10,000 visits and zero sales stops looking like your best content. The page with 500 visits and a 6% conversion rate starts looking like the one worth promoting.
Keywords from Search Console: Which search terms are bringing people to your site, with impressions, clicks, CTR, and average position. On its own, this is standard SEO data. But inside Putler, you can correlate it with revenue. The keyword bringing 500 visitors who convert is more valuable than the keyword bringing 5,000 visitors who bounce. You’d never see that distinction in GA or Search Console alone.
You don’t need to be a GA expert to use this. Putler pulls the data in and presents it alongside your business metrics. No custom reports to build. No segments to configure. The connection is built in.
What this changes about how you spend money
Without this data, marketing decisions are based on traffic volume. More visits = good. More clicks = good. The channel with the most impressions gets the most budget. This feels logical until you realize that traffic without conversion is just a cost.
That’s the core promise of eCommerce web analytics done right: every traffic number tied to a revenue outcome. Here’s what changes when you have that:
Your ad budget shifts: You discover that Google Ads drives 30% of your traffic but only 10% of your revenue, while email drives 8% of traffic but 25% of revenue. The obvious move is to shift budget from the expensive, low-converting channel to the cheap, high-converting one. Without revenue-per-visitor data, you’d never make that call.
Your content strategy changes: You stop chasing pageviews and start optimizing for pages that convert. The blog post with 10,000 visits gets evaluated differently when you realize none of those visitors bought anything. The product comparison page with 800 visits gets promoted when you see it converts at 5%.
Your SEO priorities sharpen: You stop trying to rank for every high-volume keyword and start focusing on the keywords that actually lead to purchases. Search Console data inside Putler shows you which terms drive revenue, not just traffic. That changes your content calendar.
Your campaign tracking gets honest: UTM-tagged campaigns show real revenue attribution, not just click counts. When your boss asks “did the Black Friday email work?” you can say “$12,000 in revenue from 3,200 visitors” instead of “we got a lot of clicks.”
Your reporting gets simpler: Instead of pulling traffic data from GA, revenue data from Stripe, and trying to match them in a spreadsheet, you open one dashboard. Visitors, revenue, conversion rate, top pages, top keywords — all correlated and all for the same date range. The monthly marketing report that used to take an afternoon takes ten minutes.
The bottom line
Google Analytics tells you who visited. Your payment gateway tells you who bought. But nobody tells you which visitors became buyers and why — until you connect the two.
That connection is what eCommerce web analytics should have been doing all along. Putler does it in two ways. The built-in Web Analytics dashboard gives you clean, privacy-first traffic data without any GA dependency.
The Audience Dashboard takes your existing GA and Search Console data and ties it to real revenue, so you can finally see which traffic actually makes money.