
I’ve spent time digging through dozens of Shopify analytics tools so you don’t have to. Here’s what I found, most store owners are flying blind on the metrics that actually matter.
Revenue is easy to see. But true profit after ad spend, shipping, and fees? Customer lifetime value by segment? How your numbers look across three stores at once? That data is buried or simply not there inside Shopify’s native dashboard.
That’s where third-party Shopify analytics tools come in. They connect to your store, pull in the data you need, and turn it into reports you can actually act on.
This list covers the best options available in 2026, from profit trackers to full customer intelligence platforms. So you can find the right fit for where your store is right now.
What to look for in a Shopify analytics app
Not every Shopify analytics app is built for the same job. Before picking one, it helps to get clear on what you actually need.
- Multi-source data consolidation: This matters if your revenue does not all flow through one place. If you run more than one Shopify store, take payments through Stripe or PayPal, or sell on other platforms alongside Shopify, you need a tool that pulls everything into a single view. One that only reads your Shopify admin will leave big gaps.
- Real-time vs historical reporting: Some tools show you what is happening right now like live orders, live profit. Others are built for trend analysis, cohort behaviour, and month-over-month patterns. The best tools do both. But if you are operationally focused, real-time data matters more. If retention and LTV are your priority, depth of historical data wins.
- Customer segmentation: This turns a revenue number into something actionable. A good Shopify analytics tool should be able to split your customer base by purchase frequency, lifetime value, recency, and channel. That way you know exactly who to target in your next campaign and who is at risk of never coming back.
- Ease of setup: This should not be underestimated. Advanced analytics should not require a developer to configure. The best Shopify reporting tools connect in minutes and start showing useful data without custom work on your end.
- Pricing model transparency: Worth checking early. Some tools charge a flat monthly fee. Others price by order volume or GMV. If your store grows fast, a GMV-based model can get expensive quickly. Factor that into your comparison before you fall in love with a tool.
Here are the best Shopify analytics tools worth your time in 2026.
Putler
Putler is built for store owners who need more than one platform’s worth of data in a single place. It connects to Shopify, Stripe, PayPal, WooCommerce, eBay, Etsy, Google Analytics, and 17+ other sources, then consolidates everything into one dashboard automatically. No manual exports. No spreadsheet reconciliation.
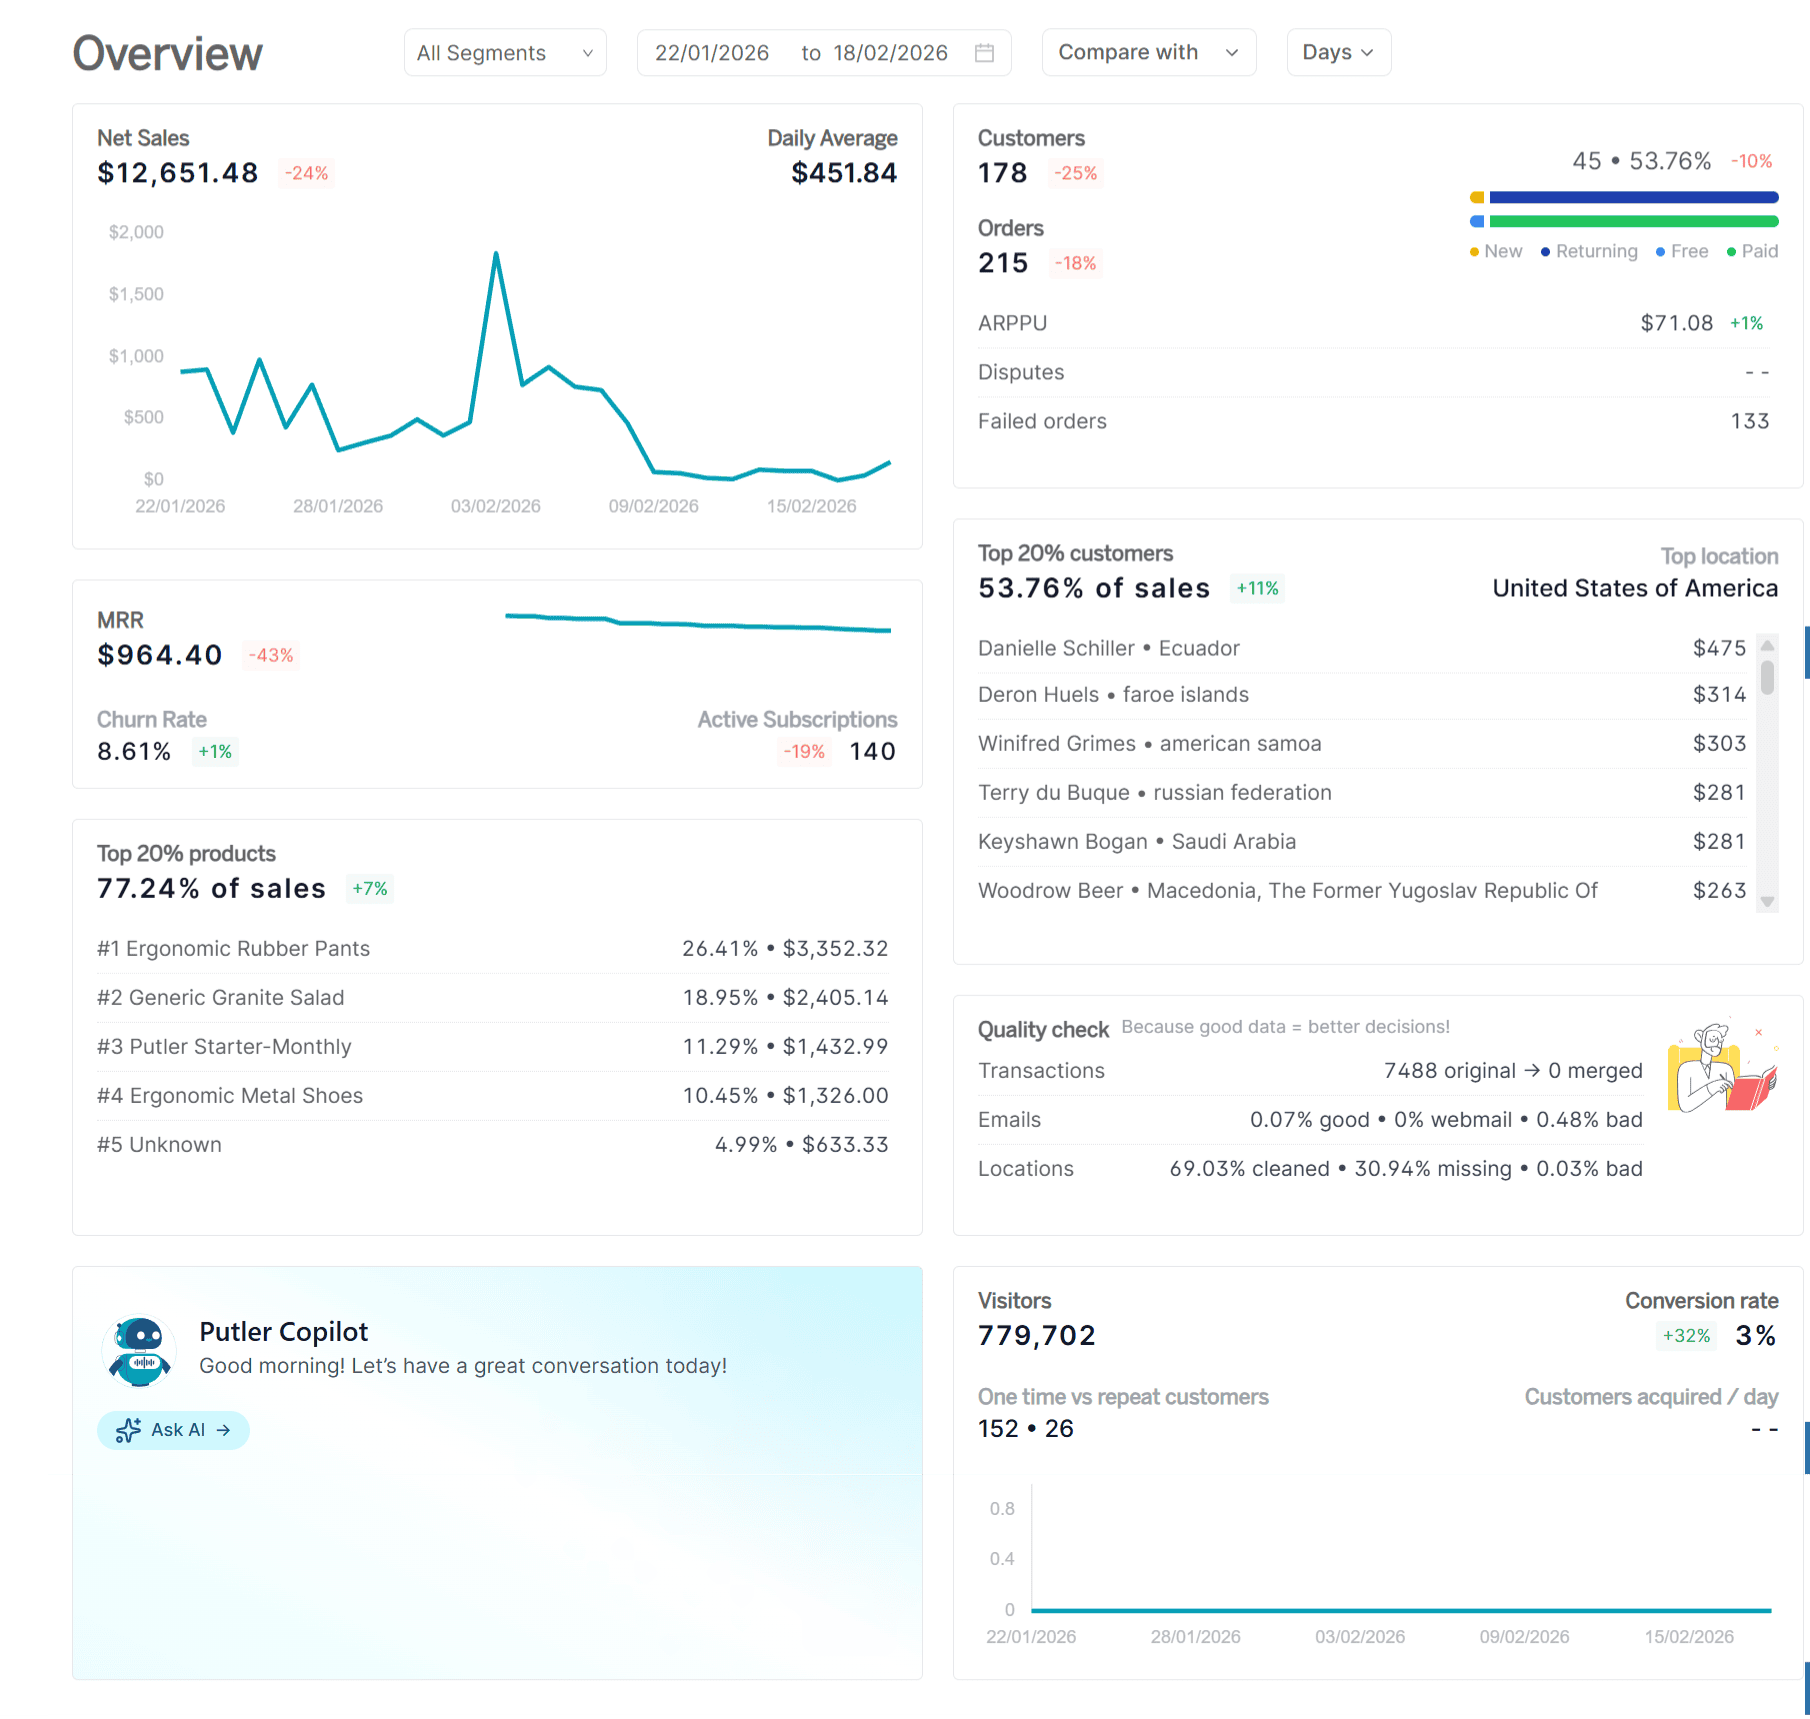
If you run multiple Shopify stores, Putler handles consolidation automatically. Revenue from each store gets pulled in, deduplicated, cleaned, and shown in combined or separate views depending on what you need.
The reporting goes deep. Putler surfaces 200+ KPIs across products, customers, sales, and transactions. The part that really stands out is the customer intelligence layer. RFM segmentation automatically groups your buyers by recency, frequency, and spend value. You get a clear picture of your top customers, the ones slipping away, and the ones who have gone quiet. From there you can push those segments straight into targeted email campaigns.
Putler also covers sales forecasting, goal setting, and growth recommendations. It is not just a reporting tool. It gives you a direction to move in.
Price
- Starter plan — $20/mo
- Growth plan — starts at $50/mo
Features include
- Connects to Shopify stores, major payment gateways, and 17+ additional data sources and pulls everything into one place
- Automatically deduplicates, cleans, and normalises data across all connected sources
- Detailed reporting across products, sales, orders, transactions, and customers
- Over 200 KPIs and reports covering everything from churn rate to average revenue per user
- Manage refunds and subscriptions without leaving the dashboard
- RFM-based customer segmentation that automatically groups buyers by recency, frequency, and spend value
- Built-in sales forecasting, goal setting, and personalised growth recommendations
- Inbound and outbound API for custom integrations
Pros
- One of the few tools that handles both eCommerce and SaaS businesses from a single dashboard
- Multi-store and multi-gateway consolidation works straight out of the box
- Significantly more affordable than enterprise-tier alternatives with comparable depth
- Goes beyond reporting with segmentation, forecasting, and actionable growth insights
Cons
- No inventory management functionality
- Cohort analysis is not currently available
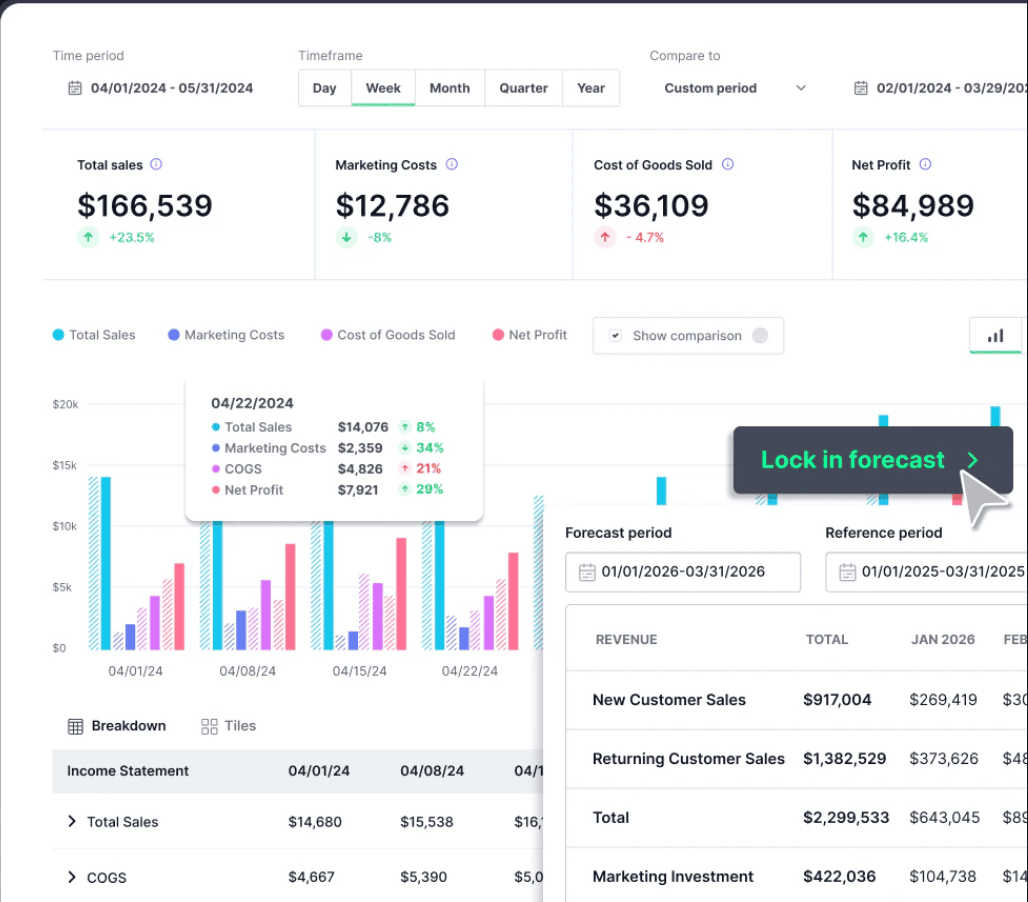
TrueProfit
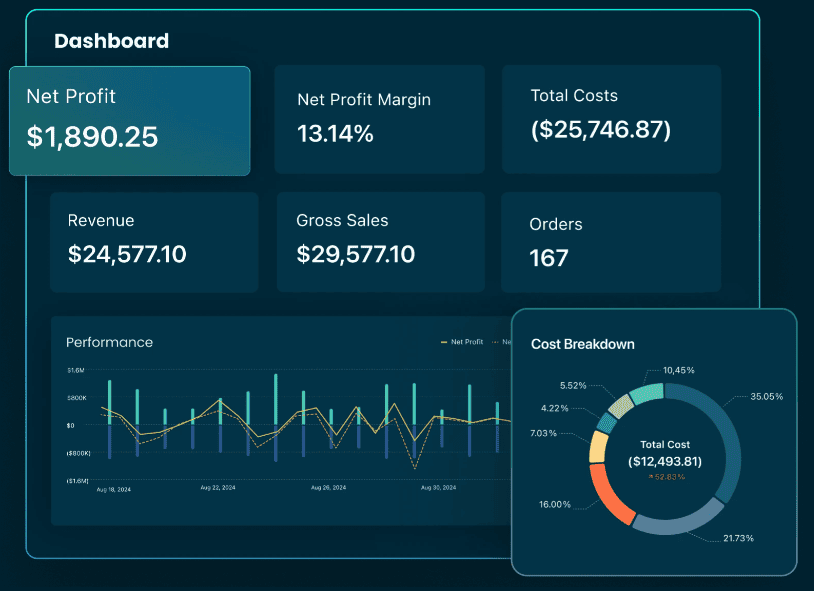
TrueProfit calculates your real net profit by pulling in every cost automatically.
Once you connect it, TrueProfit syncs ad spend in real time from Facebook, Google, TikTok, Bing, Snapchat, and Amazon.
It adds that to your COGS, shipping costs, transaction fees, taxes, and any custom expenses you define.
The result is a live profit dashboard that updates every 15 minutes, showing true net profit per store, per product, and per order.
Price: From $35/month. 14-day free trial available.
Features include
- Live net profit dashboard that factors in every cost automatically once set up
- Pulls ad spend directly from Facebook, Google, TikTok, Bing, Snapchat, and Amazon as it happens
- Breaks down profit at the product level and individual order level
- Tracks customer lifetime value alongside profit metrics in one view
- Full profit and loss reporting with scheduled email delivery
- Single dashboard combining data from multiple Shopify stores
- Mobile app for iOS and Android
Pros
- Eliminates manual profit spreadsheets entirely, setup takes under 10 minutes
- Ad platform connections give you ROAS based on actual margin not just revenue
- One of the highest-rated analytics apps on the Shopify App Store with 700+ reviews
- Clean interface suited to merchants who are not data analysts
Cons
- Plan pricing scales with monthly order volume, costs rise as your store grows
- Primarily a profit tracking tool, not a full business intelligence platform
- Cohort analysis and deep customer behaviour reporting are limited
Sensai Metrics
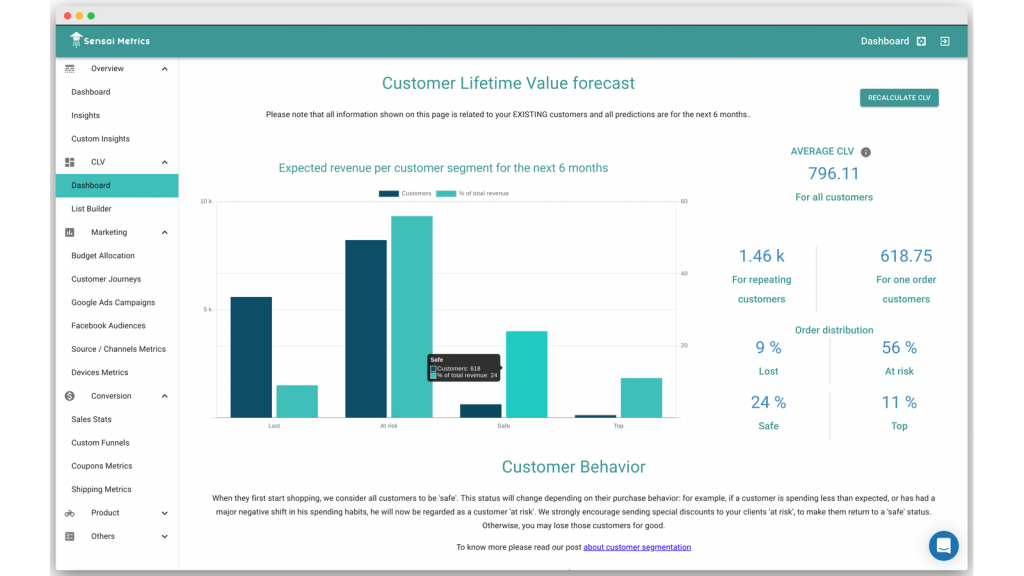
Sensai Metrics takes eCommerce data from your sales platform, Google Analytics, and marketing channels, then runs it through AI models to give you something more useful than raw numbers.
The goal is to tell you why things are happening, not just that they happened. Which campaigns drove conversions. Which customer segments are converting well. Where your ad budget is going to waste.
It positions itself as a data science team for store owners who do not have one.
The centralised dashboard brings everything together and the AI layer does the interpretation work for you.
Price: A free plan is available on the Shopify App Store. Paid tiers are contact-based, verify current pricing at sensaimetrics.io before committing.
Features include
- AI-powered budget allocation modelling that weighs campaign results against how customers move toward conversion
- Individual customer journey tracking connected to Facebook audience data
- Both pre-built and custom insight dashboards
- Sales statistics and overall eCommerce performance in a single centralised view
Pros
- Traffic and conversion data shown together in real time
- AI-driven analysis reduces the need to manually interpret raw data
- Free entry point on the Shopify App Store makes it low-risk to evaluate
Cons
- Customisation options are limited on lower tiers
- No content analysis or SEO-related reporting
- Smaller ecosystem compared to more established platforms in this category
Polar Analytics
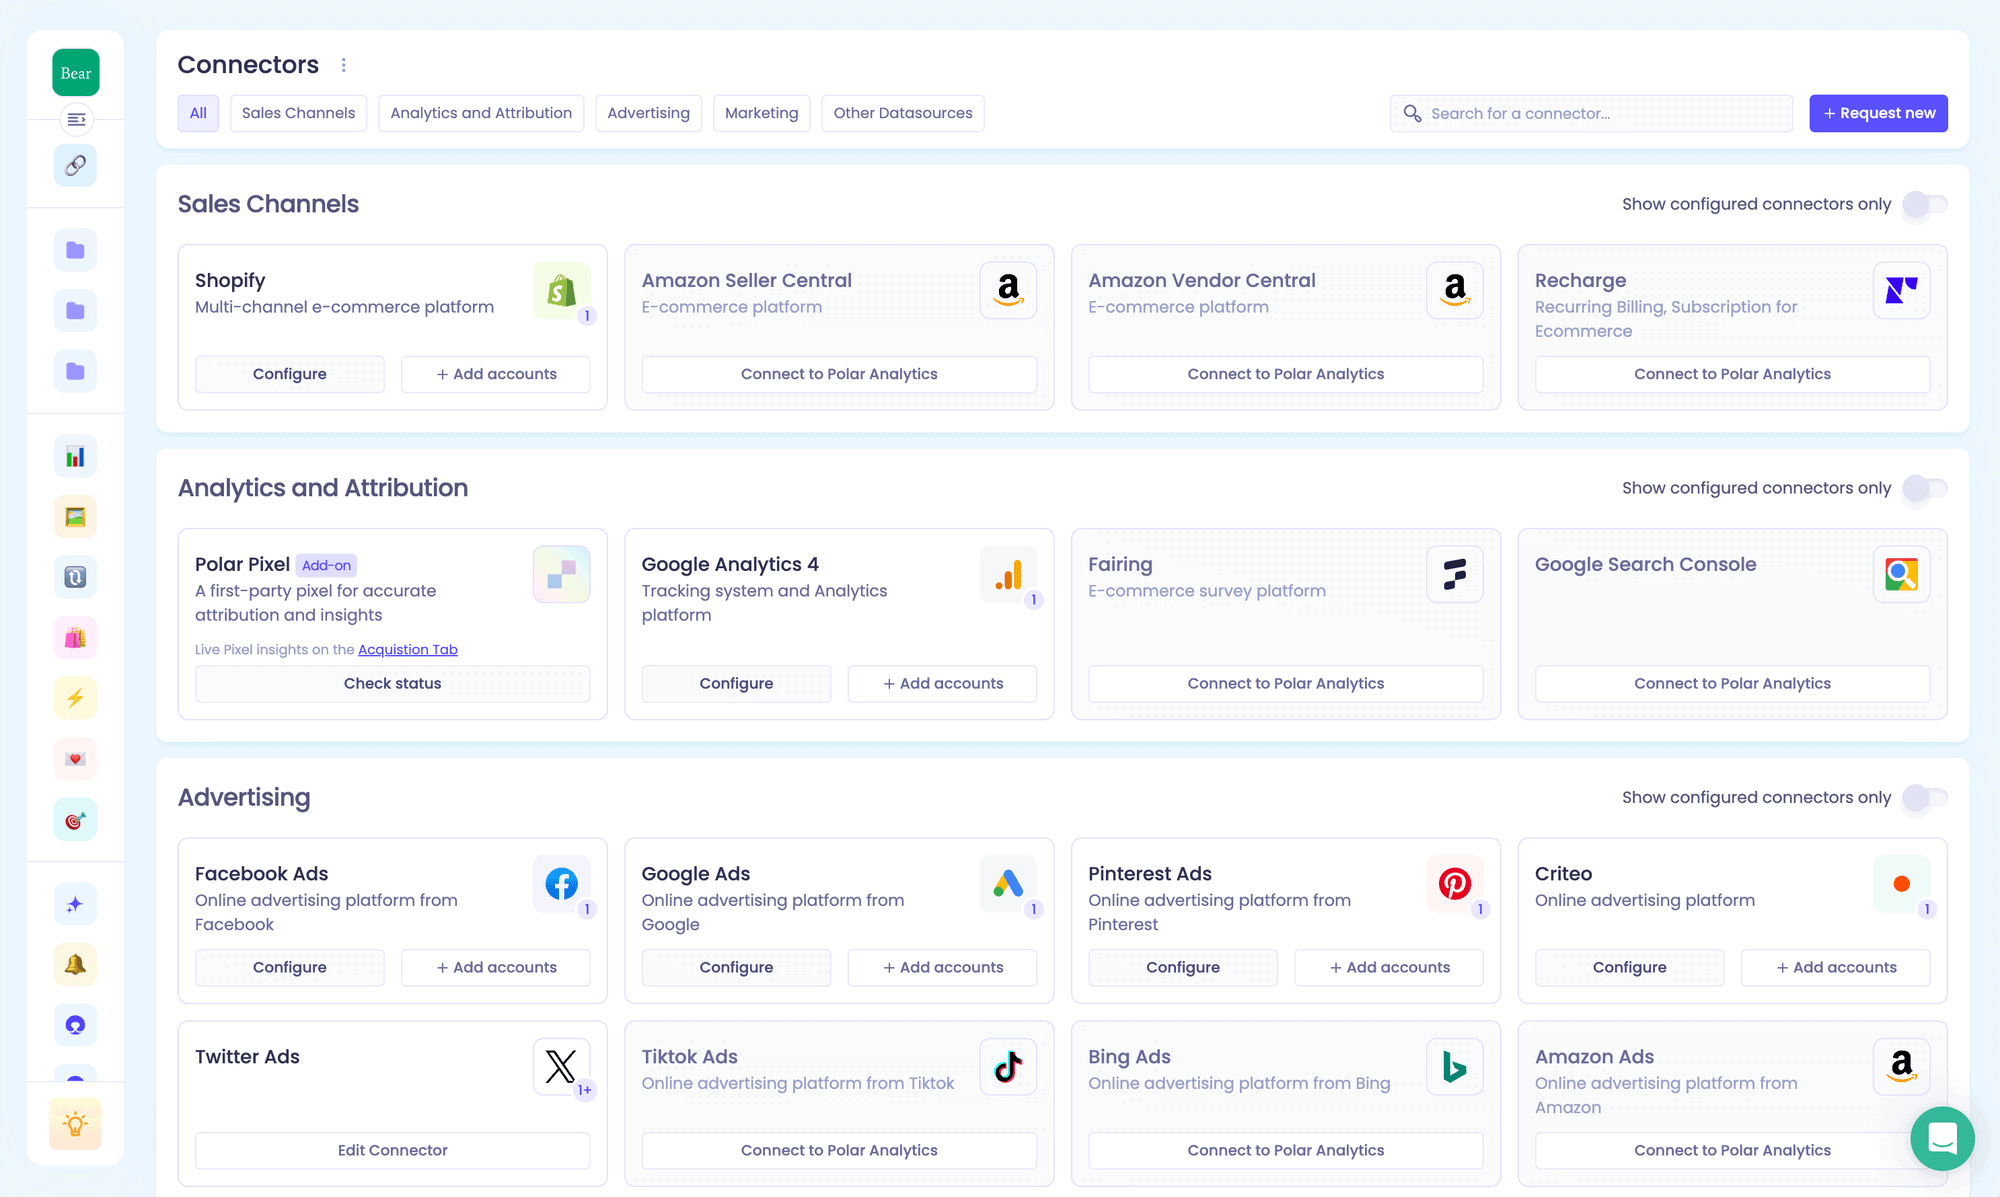
Polar Analytics is what you reach for when your data is scattered across too many platforms and you need everything in one place.
It connects to 45+ sources including Shopify, Klaviyo, Google Ads, Meta, TikTok, and Amazon and organises all of it into a single dashboard with pre-built and fully customisable reporting.
The reporting covers four areas — acquisition, retention, merchandising, and profit and loss. You can work from the ready-made dashboards or build your own metrics from scratch.
The Klaviyo integration goes further than most. Polar enriches your Klaviyo customer profiles with real purchase data so your segments are built on what people actually bought.
On the ad side it pushes profit data back to Meta and Google so your campaigns optimise on real margin not just revenue.
Price: GMV-based pricing, billed on monthly tracked orders. Entry plans start around $300 to $500 per month and scale up steeply with store revenue, with larger brands reporting $700+ per month. Annual discounts available. Confirm current tiers at polaranalytics.com.
Features include
- Connects to 45+ data sources covering eCommerce, advertising, email, and logistics platforms
- Ready-to-use dashboards for acquisition, retention, merchandising, and P&L with no setup required to get started
- Full custom metric and report builder with a drag-and-drop interface
- Natural language AI query tool that turns plain English questions into visualised answers
- Aggregated view across multiple Shopify stores and international markets
- Enriches Klaviyo profiles with purchase data and pushes profit signals into Meta and Google
- KPI alerts delivered via email or Slack when metrics move outside expected ranges
- Scheduled snapshot reports sent to your team on a recurring basis
Pros
- One of the most comprehensive multi-channel analytics platforms available for Shopify brands
- Fully customisable without needing any engineering involvement
- Customer support is consistently rated as a standout strength on both Shopify App Store and G2
- Rated 4.8 on the Shopify App Store with 110 plus reviews
Cons
- GMV-based pricing gets expensive as your store scales, not suited to small or early-stage stores
- SKU-level profitability and inventory management are not available out of the box
- Some users report lag when switching between complex dashboard views
Lifetimely
Lifetimely, now part of the AMP suite, is built around one question most Shopify stores struggle to answer clearly, which customers are actually worth the most over time, and which channels are bringing them in.
It answers that with a combination of real-time profit tracking and some of the deepest LTV and cohort analysis available in the Shopify ecosystem.
The LTV layer is where Lifetimely earns its name. You can segment customers by their first purchase date, the first product they bought, or the channel they came from.
A predictive AI model trained on data from billions of customers globally forecasts what any segment is likely to spend going forward. That is directly useful for setting acquisition budgets based on expected return rather than guesswork.
Price: Free to install for stores under 50 orders per month. Paid plans run $149/month (up to 3,000 orders), $299/month (up to 7,000 orders), and $499/month (up to 15,000 orders), with a 14-day free trial. An Amazon add-on is available for an extra fee.
Features include
- Real-time profit and loss dashboard combining Shopify and Amazon revenue with ad spend, shipping, and custom costs
- Customer lifetime value broken down by segment, acquisition channel, and first product purchased
- Cohort reports showing CAC payback periods, revenue trends, and retention rates over time
- AI-powered LTV forecasting that predicts future spend for any customer segment
- Product journey analytics covering repurchase rates, purchase sequences, and average time between orders
- Integrates with Klaviyo, Meta, Google Ads, TikTok, Snapchat, and ShipStation
- Customisable dashboards with scheduled email report delivery
- Industry benchmark data for comparing performance against similar brands
Pros
- Best-in-class cohort analysis and LTV modelling for Shopify brands at this price point
- Free plan available for stores under 50 orders per month — no commitment needed to start
- Deep Klaviyo integration lets you activate LTV segments directly in email and SMS campaigns
- Rated 4.7 on the Shopify App Store with 420 plus reviews
Cons
- Can feel complex to configure for stores new to cohort-based analysis
- Plan costs increase with order volume — worth calculating projected orders before committing
- Real-time profit granularity is not as deep as dedicated profit tools like TrueProfit
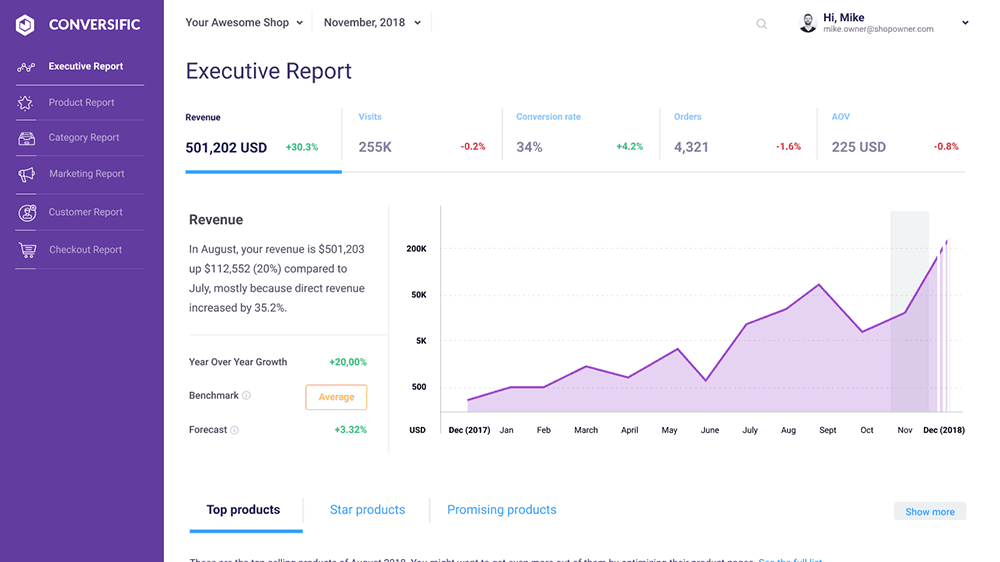
Conversific
Conversific is an eCommerce analytics tool built specifically for Shopify. What makes it different from most Shopify analytics apps is that it does not just show you your numbers, it shows you how those numbers compare against similar stores in your category.
That competitive context is hard to find elsewhere. If your conversion rate sits at 1.8%, Conversific can tell you whether that is above or below average for your product category.
Beyond benchmarking it covers eCommerce performance metrics including product analytics, customer analytics, and revenue breakdowns.
It pulls in Google Analytics data for traffic source reporting, so the depth of traffic insights you get depends on having GA properly configured on your store.
Price: Plans start at $29 per month. Confirm current tiers at conversific.com before purchasing.
Features include
- Store performance monitoring covering revenue, conversion rates, and traffic quality in one view
- Competitive benchmarking putting your metrics alongside anonymised data from similar Shopify stores
- Personalised recommendations and suggested action items generated from your actual store data
- Product and customer analytics with segmentation options
- Google Analytics integration bringing traffic source data into the reporting view
Pros
- Industry benchmarking adds competitive context that most analytics tools skip entirely
- Personalised recommendations make it easier to act on data without deep analytics experience
- Good fit for store owners who want guided insights rather than raw dashboards to configure
Cons
- Traffic reporting depth depends entirely on Google Analytics being properly set up on your store
- No content analysis or SEO-related features
- Less suitable for experienced analysts who need full control over custom metric definitions
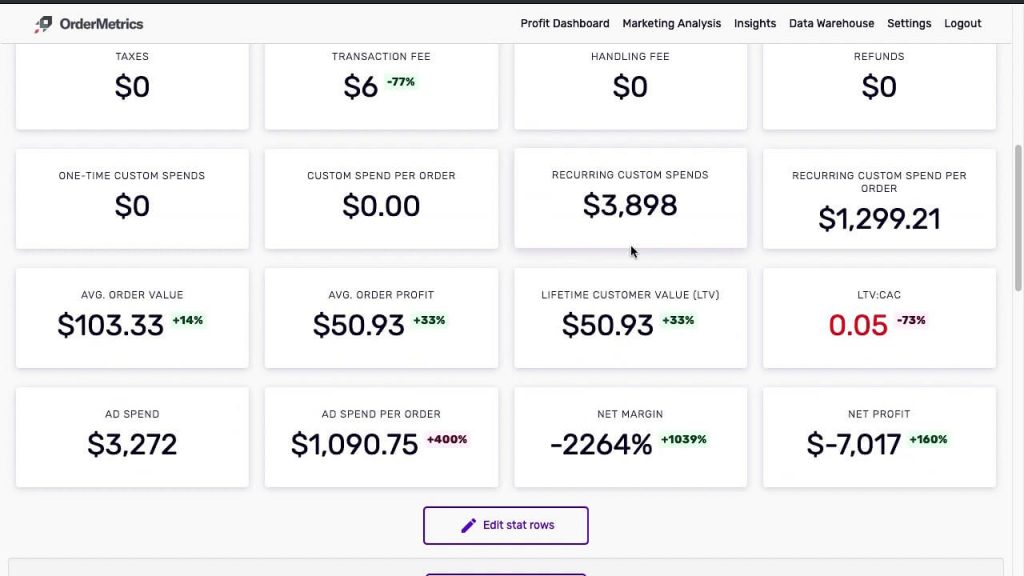
OrderMetrics
OrderMetrics connects your Shopify order data to your advertising costs, shipping expenses, transaction fees, and operating costs and shows you real net profit in a single financial dashboard.
The idea is to replace the manual work of pulling figures from different platforms and reconciling them in a spreadsheet with something that does it automatically.
It pulls data from Shopify, Facebook Ads, Google Ads, TikTok, Snapchat, Pinterest, and ShipStation and displays everything updated in real time.
One important note for new users: OrderMetrics’ availability on the Shopify App Store has been inconsistent, with the original profit-tracker listing showing as unavailable at times and the developer having pivoted toward a Google Sheets reporting product. The product website remains active.
If you are evaluating it as a new user, verify current availability and onboarding directly at ordermetrics.com before going further.
Price: From $59 per month. Confirm current plan availability at ordermetrics.com.
Features include
- Profit dashboard that factors in COGS, shipping, transaction fees, refunds, discounts, and custom costs alongside Shopify revenue
- Ad spend pulled automatically from Facebook, Google, TikTok, Snapchat, and Pinterest
- Order-level profitability breakdown sortable by gross margin
- Daily automated report summarising key financial metrics and flagging anomalies
- Customer behaviour tracking including bounce rate, abandoned cart rate, and time on site
- Campaign-level performance reporting across connected channels
Pros
- Straightforward profit dashboard easier to read than raw Shopify reports
- Order-level margin sorting is practically useful for stores with variable cost structures
- Daily automated reports reduce the need to manually log in and check figures each morning
Cons
- App Store availability has been inconsistent — new users should verify onboarding directly with the team
- Pricing is higher than newer profit tracking alternatives offering similar core features
- Facebook integration has caused account restriction issues for some users based on recent reviews
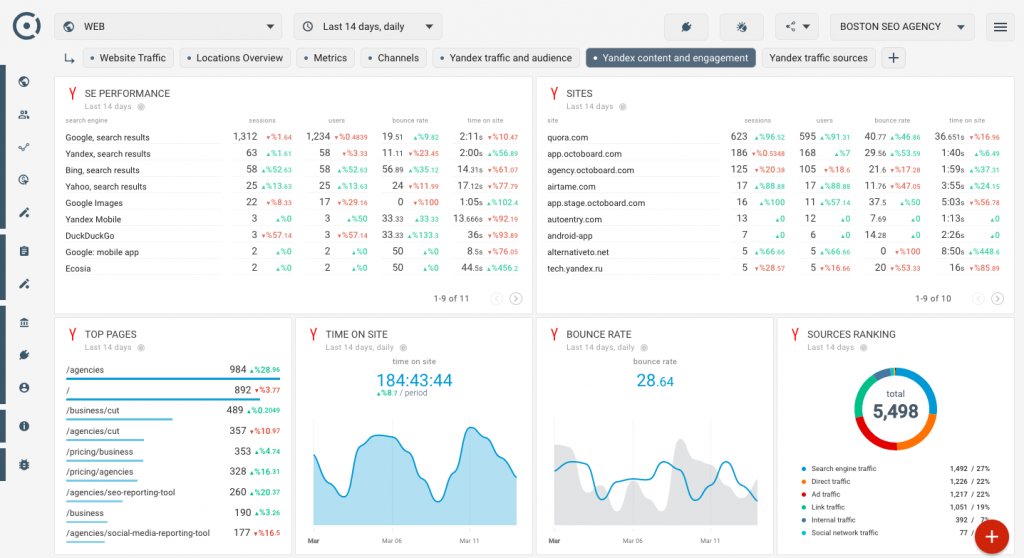
Yandex Metrica
Yandex Metrica is a free web analytics platform developed by Yandex. It sits in a different category from the profit-focused tools on this list.
Its strength is in understanding how visitors actually behave on your Shopify store before they convert or leave.
What makes it stand out is the combination of features it offers at zero cost.
Session replay records actual visitor journeys that includes every click, scroll, and movement, so you can watch how people interact with your pages without needing a separate tool.
Heatmaps show which parts of each page get the most attention and where visitors stop scrolling.
Data is updated in real time and stored without sampling so you see 100% of actual traffic, not an estimate based on a subset.
Price: Completely free. No traffic limits, no paid tiers, no upgrade prompts.
Features include
- Session replay recording every visitor interaction in video format including clicks, scrolls, and mouse movements
- Heatmaps showing where on each page visitors focus, click, and stop scrolling
- Form analytics identifying which fields cause users to abandon forms before completing them
- Real-time traffic data for desktop and mobile visitors with zero data sampling
- Audience breakdown by location, device, browser, and ad blocker usage
- Traffic source reporting with ROI tracking from connected advertising channels
- Up to 100 configurable goals per site with eCommerce data integration
- Custom user segmentation and attribution model switching within existing reports
Pros
- Completely free with no data caps or forced upgrades
- Session replay, heatmaps, and form analytics in one platform removes the need for a separate tool
- Unsampled real-time data means reports reflect actual traffic not approximations
- Integrates directly with Shopify for eCommerce goal tracking
Cons
- Interface can feel non-adaptive on smaller screens
- Fewer third-party integrations compared to Google Analytics
- Data sovereignty considerations for merchants in markets sensitive to Russian-hosted platforms
- Customer support availability is limited in certain regions
Web-stat
Web-stat does one thing and it does it well, it shows you exactly who is on your Shopify store right now, where they came from, how they are moving through your pages, and where they leave.
It is not a profit tracker or a customer intelligence platform. It is a real-time visitor tracking tool built to help you understand traffic behaviour at the individual level.
Each visitor is logged individually. You can see their location, device, referrer, every page they visited, and how long they spent on each one.
Setup is a single click from the Shopify App Store. No coding. Visitor data appears immediately.
The reporting is deliberately clean and straightforward graphs and visit logs rather than dense analytical dashboards.
Price: Free plan available up to 5,000 page views per month. Paid plans from $12 per month.
Features include
- Live visitor monitoring showing each visitor’s journey through your store as it happens
- Full visit paths from entry to exit including referrer source, location, device type, and time spent per page
- Referrer tracking with a week-by-week view of which traffic sources are sending visitors to your store
- Conversion tracking that shows which referrers are actually generating sales not just visits
- Named visitor tracking for stores with login functionality — recognises returning signed-in customers
- Event tracking for clicks, file opens, and outbound links that would not otherwise register as page views
- Automated email reports, alerts for new visitors or conversions, and embeddable site widgets
Pros
- One-click Shopify installation with no coding required
- Individual visitor-level detail gives context that aggregate dashboards miss
- Free plan available with no trial expiry for smaller stores
- Responsive support team frequently praised in Shopify App Store reviews
Cons
- Focused on traffic behaviour — not designed for revenue, profit, or customer analytics
- Some users have reported intermittent loading issues on the Shopify admin integration
- Free plan caps at 5,000 page views per month — higher-traffic stores will need a paid tier quickly
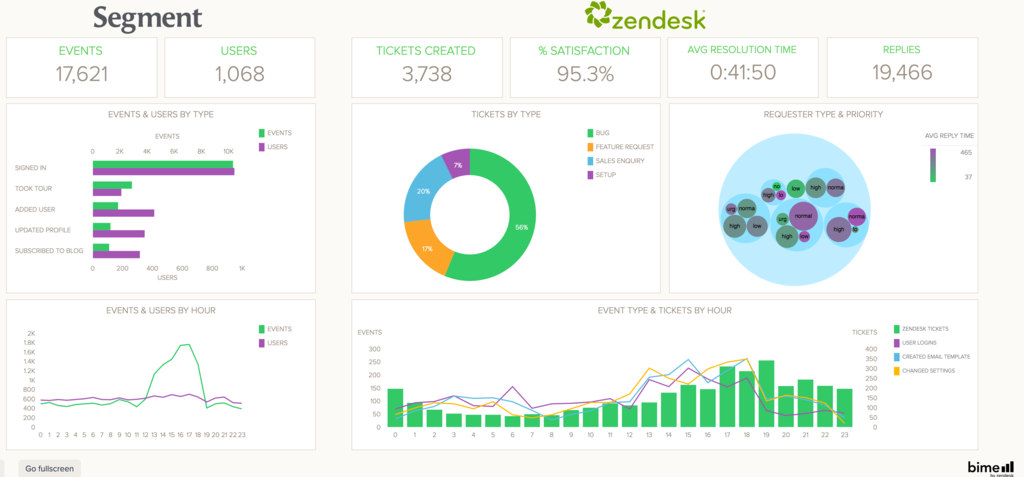
Segment Analytics
Segment is a customer data platform. That puts it in a different category from the analytics dashboards elsewhere on this list.
Segment collects customer data from every touchpoint across your Shopify store, cleans it up, and routes it into whichever analytics, marketing, and advertising tools you already use.
For store owners running multiple tools, email platforms, ad networks, CRMs, and data warehouses — Segment solves the fragmentation problem.
Instead of each tool building its own incomplete version of your customer data, Segment acts as the single collection point. Data flows in once, gets unified into individual customer profiles, and then gets sent out to 700+ downstream destinations automatically.
Price: Free plan available up to 1,000 monthly tracked visitors. Team plan from $120 per month for up to 10,000 monthly tracked visitors. Enterprise pricing on request.
Features include
- Single data collection layer capturing events from Shopify, web, mobile, and server sources using one API
- Unified customer profiles built by stitching together data from every touchpoint
- Routes clean standardised customer data to 700+ destinations including analytics tools, ad platforms, email platforms, and data warehouses
- Prebuilt audience segmentation with cohort building for targeted campaigns
- Customer lifetime value tracking and email ROI measurement across connected platforms
- Real-time data activation where events captured in Segment trigger workflows in connected tools instantly
Pros
- Eliminates data fragmentation across tools — one collection point feeds everything else cleanly
- 700+ integrations make it compatible with virtually any marketing or analytics stack
- Free plan available for stores with modest monthly traffic volume
- Strong compliance posture including SOC 2, ISO 27001, GDPR, and HIPAA eligibility
Cons
- Implementation requires developer involvement — not a plug-and-play tool for non-technical users
- Pricing scales with monthly tracked users and gets expensive at higher traffic volumes
- Segment itself does not display analytics — it feeds other tools that do, adding to overall stack cost
- Over-engineered for stores that do not yet run multiple tools needing a shared data layer
Find the right Shopify analytics tools and let your data do the work
The right Shopify analytics tools do not just show you what happened last month. They show you which customers to retain, which products are quietly costing you margin, and where your marketing spend is actually paying off.
That shift from reporting to decision-making is what separates stores that grow with intention from stores that grow by guessing. Every tool on this list serves a specific need.
Frequently asked questions about Shopify analytics tools
What are Shopify analytics tools?
Shopify analytics tools are third-party apps that connect to your store and provide reporting beyond what Shopify’s built-in dashboard offers. They help you track net profit, customer lifetime value, marketing attribution, and product performance that is either unavailable or hard to surface natively inside Shopify.
Does Shopify have built-in analytics?
Yes. Shopify includes native analytics on all paid plans covering sales, sessions, conversion rates, and top products. For metrics like true net profit, customer segmentation, cohort analysis, or multi-store consolidation you will need a third-party Shopify analytics app.
What is the best Shopify analytics tool for tracking profit?
TrueProfit and Lifetimely are the strongest options in 2026. TrueProfit focuses on real-time net profit pulling in COGS, ad spend, shipping, and fees automatically. Lifetimely goes deeper into LTV and cohort analysis. For multi-platform stores, Putler consolidates everything at a much more affordable price point.
Can I track multiple Shopify stores in one dashboard?
Yes. Putler is built specifically for this and pulls data from multiple Shopify stores, payment gateways, and other platforms into one combined view. Polar Analytics supports multi-store and multi-market aggregation with country and brand-level filtering. TrueProfit also offers a combined multi-store dashboard focused on profit.
What is the difference between Shopify analytics and Google Analytics?
Shopify analytics covers your store’s sales, orders, customers, and product performance. Google Analytics covers how visitors behave on your website including traffic sources and conversion funnels. Most store owners benefit from using both. For profit, RFM segmentation, or customer LTV a dedicated Shopify reporting tool like Putler or Lifetimely adds what neither platform provides on its own.
Is there a free Shopify analytics app?
Yes. Yandex Metrica is completely free with no traffic limits. Web-stat has a free plan up to 5,000 page views per month. Segment offers a free tier up to 1,000 monthly tracked visitors. Lifetimely has a free plan for stores under 50 orders per month. Putler’s Starter plan at $20 per month is one of the most affordable paid options for profit tracking and customer analytics.
What Shopify metrics should I be tracking?
The most important ones are net profit, customer lifetime value, repeat purchase rate, customer acquisition cost, average order value, and conversion rate. Beyond those, RFM segmentation groups customers by recency, frequency, and monetary value and tells you exactly who to prioritise in retention campaigns and who is at risk of churning.
How do I choose the right Shopify analytics app for my store?
Start with the specific gap in your current reporting. No visibility on true net profit, start with TrueProfit or Lifetimely. Selling across multiple stores or platforms, Putler is built for that. Want to understand visitor behaviour before purchase, Yandex Metrica or Web-stat cover that for free. Running a large marketing stack across multiple tools, Polar Analytics or Segment will centralise your data. Match the tool to the question you are actually trying to answer.
- Best Shopify reporting tool
- Must-have Shopify apps to increase sales
- Top Shopify analytics tools
- Expert Tips to Optimize Shopify Store