

If you’ve ever compared Shopify revenue with GA4, Meta Ads, or Google Ads reports, you’ve probably noticed the numbers rarely match perfectly.
One platform reports higher conversions, another shows lower revenue, while your actual store orders tell a slightly different story altogether.
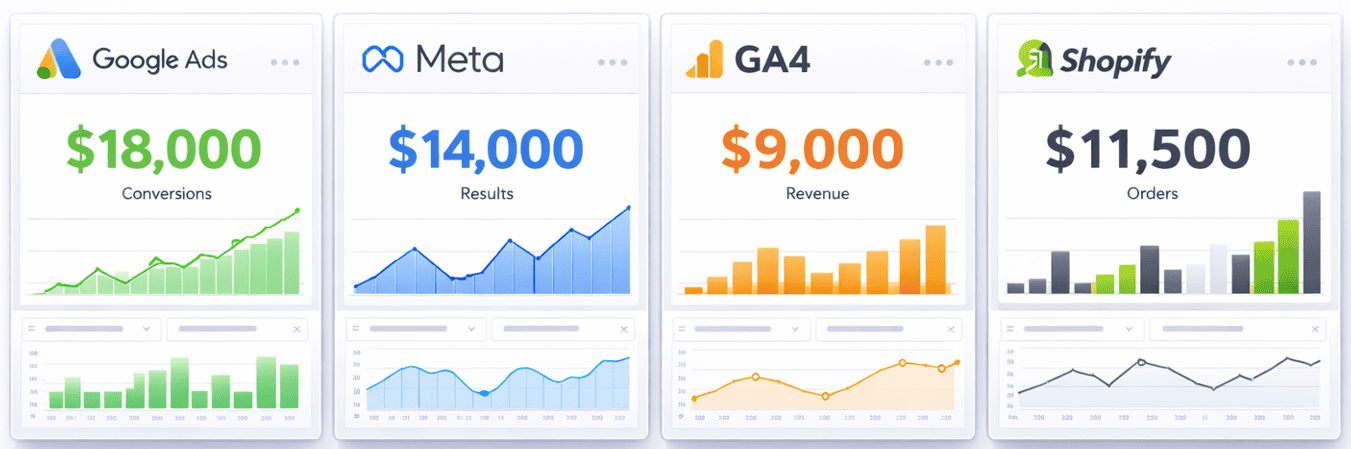
This happens because every platform tracks attribution differently. Each uses its own attribution window, conversion logic, tracking method, and reporting model to assign credit for sales.
As customer journeys become more fragmented across ads, email, organic search, marketplaces, and multiple devices, attribution gaps become harder to avoid.
For example, a customer may discover a product through Instagram on mobile, revisit through Google Search on desktop, and finally purchase after clicking an email campaign days later.
The result is that many eCommerce businesses end up making marketing and budget decisions using incomplete or conflicting data.
In this guide, we’ll break down why eCommerce revenue attribution becomes unreliable, what causes reporting mismatches across platforms, and how to build a clearer view of actual business performance.
What eCommerce revenue attribution actually means
eCommerce revenue attribution is the process of identifying which marketing channels and customer touchpoints contributed to a sale.
For example, a customer might discover a product through a Facebook ad, return later through a blog post, click an email campaign a few days later, and finally purchase after clicking a Google Shopping ad.
Attribution determines how much credit each of those interactions receives for the final conversion.
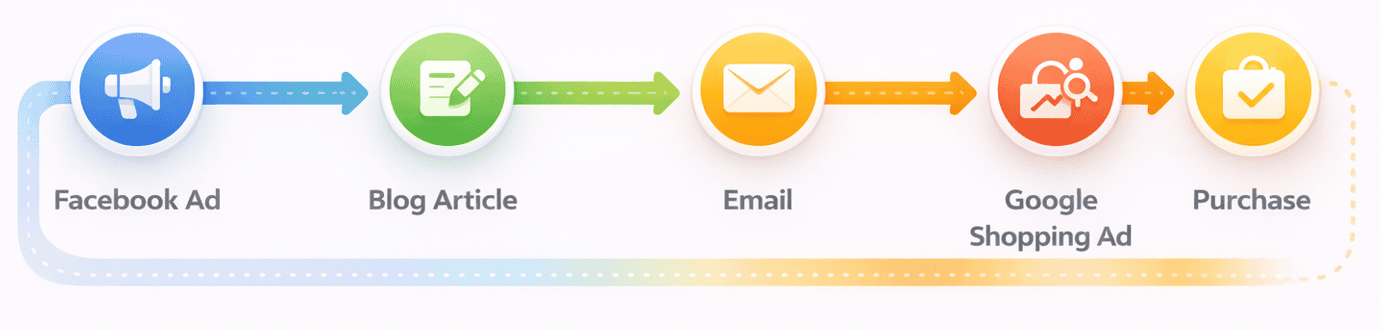
Those attribution decisions directly influence marketing budgets. Channels receiving more reported conversions often get additional spend, while channels that appear to underperform may receive reduced investment.
When attribution data is reasonably accurate, it helps businesses understand which channels are contributing to growth. When the data is incomplete or misleading, marketing decisions become much harder to evaluate confidently.
The challenge is that modern customer journeys are no longer linear. Customers move between devices, platforms, ads, emails, marketplaces, and payment systems before completing a purchase.
As a result, different analytics and advertising platforms often report different versions of the same conversion journey.
- 73% of shoppers interact with multiple channels before making a purchase
- Only 31% of marketers say they are confident in their attribution models, despite most considering attribution critical for decision-making
- Businesses improving attribution visibility often report better budget allocation and campaign efficiency
- Multi-channel brands frequently struggle to reconcile revenue data across advertising, analytics, and payment platforms
This gap between reported performance and actual customer behavior is one of the main reasons attribution remains difficult for growing eCommerce businesses.
Why does attribution matter in eCommerce?
Attribution helps businesses understand which marketing efforts influence conversions and revenue.
Without reliable attribution data, it becomes difficult to evaluate campaign performance, allocate budgets effectively, or identify which channels are genuinely driving growth.
The eCommerce attribution models every store owner should know
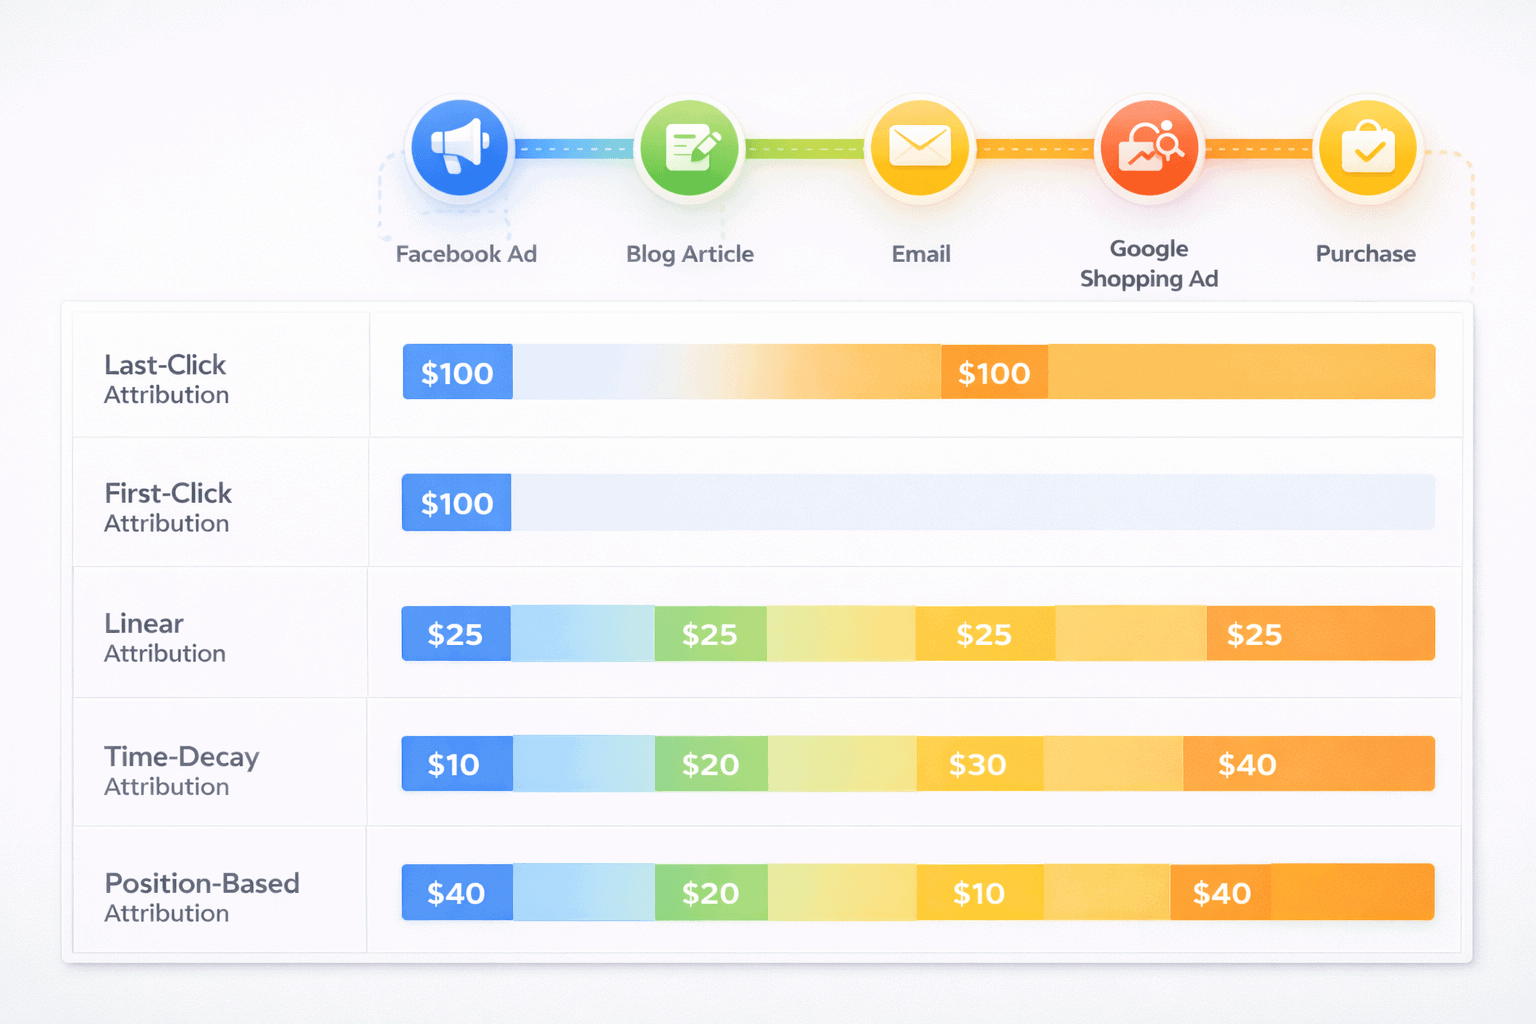
To understand why attribution reports often look inconsistent, it helps to see how different attribution models evaluate the same customer journey.
Let’s take a simple example:
| Day | Customer interaction |
|---|---|
| Day 1 | Clicks a Facebook ad and discovers the brand |
| Day 5 | Finds a blog post through organic search |
| Day 8 | Opens and clicks a promotional email |
| Day 12 | Clicks a Google Shopping ad and completes the purchase |
The final order value is $100. The attribution model determines how that $100 gets distributed across the journey.
Last-click attribution: the most commonly used model
In this model, Google Shopping receives full credit for the sale, while earlier touchpoints receive no attribution credit.
This is the default in most eCommerce platforms and the model most stores have never changed.
Last-click attribution highlights the final conversion source but provides limited visibility into the earlier interactions that influenced the purchase decision.
First-click attribution: focused on discovery
Here, Facebook receives full conversion credit because it introduced the customer to the brand first.
This model is useful for measuring awareness and customer acquisition, but it overlooks the interactions that helped move the customer toward conversion. Removed from GA4 in 2023.
Linear attribution: equal credit across touchpoints
Each touchpoint gets $25.
Every interaction is weighted equally, regardless of whether it introduced the customer or directly influenced the purchase. No channel looks dominant but no channel looks especially important either.
Time-decay attribution: prioritises recent interactions
Google Shopping gets roughly $40, email gets $30, organic gets $20, Facebook gets $10.
This approach works well for shorter buying cycles but may reduce the perceived impact of early awareness campaigns.
Position-based attribution: balancing discovery and conversion
Facebook and Google Shopping each get $40. Organic and email split the remaining $20.
This model became popular because it balanced both the first interaction and the final conversion touchpoint.
Data-driven attribution: machine learning-based attribution
This model uses machine learning to analyse customer journeys and assign conversion credit based on how different touchpoints contribute to purchases.
Unlike rule-based models, data-driven attribution adapts based on actual user behavior and conversion patterns across channels.
However, it works best when enough conversion data is available across multiple traffic sources. Smaller eCommerce stores may not always generate sufficient data volume for the model to provide reliable attribution insights consistently.
Which attribution model is best for eCommerce?
There is no single “best” attribution model for every eCommerce business. The right approach depends on the buying cycle, marketing channels, and reporting goals.
Many stores compare multiple models to better understand how different touchpoints contribute to conversions.
Since every attribution model distributes conversion credit differently, the same customer journey can produce very different reporting outcomes across platforms.
Here’s a simplified comparison of how the major attribution models are typically used in eCommerce reporting.
| Attribution model | Best for | Main limitation |
|---|---|---|
| Last click | Measuring final conversion source | Ignores earlier touchpoints |
| First click | Tracking awareness campaigns | Ignores conversion journey |
| Linear | Balanced reporting | All touchpoints weighted equally |
| Time decay | Short buying cycles | Reduces early-stage influence |
| Position-based | Balancing discovery and conversion | Mid-funnel interactions receive less weight |
| Data-driven | Large datasets and advanced analysis | Requires significant conversion volume |
In reality, most eCommerce businesses use attribution models as directional reporting tools rather than perfectly accurate measurement systems.
Comparing multiple models often provides a more balanced understanding of how different channels contribute throughout the customer journey.
Why eCommerce revenue attribution breaks down in practice
While attribution models look straightforward in theory, real-world eCommerce tracking becomes much more complicated once multiple platforms, devices, browsers, and payment systems are involved.
Here are some of the most common reasons attribution data becomes inconsistent across channels.
Many stores still rely heavily on last-click attribution
Fewer than 3% of Google Ads conversion actions ever used any model other than last-click before Google removed the alternatives.
Last-click attribution tends to give most conversion credit to bottom-funnel channels such as branded search, remarketing, and direct visits, while earlier awareness interactions receive little visibility.
As a result, some businesses end up over-investing in retargeting campaigns because those campaigns appear to generate the highest return inside last-click reporting models.
This is especially common for brands with longer buying cycles where customers interact with multiple channels before purchasing.
Modern customer journeys involve multiple touchpoints

Customers rarely purchase after a single interaction anymore. Many buyers move between ads, search results, emails, social media, marketplaces, and direct visits before converting.
B2C consumers now engage with brands 6 to 20 times before purchase. For some products, especially higher-ticket purchases, the customer journey can stretch across days or even weeks.
The average eCommerce customer touches a brand 9.5 times before converting. This makes it difficult for single-touch attribution models to reflect the full customer journey accurately.
Cross-device journeys make attribution harder to measure
Between 30 and 50% of eCommerce transactions involve multiple devices. Facebook reports that 65% or more of its conversions start on one device and finish on another.

A customer may browse products on mobile, revisit later on desktop, and finally complete the purchase on another device entirely.
Because tracking systems often rely on browser cookies or device-specific identifiers, connecting those sessions accurately becomes difficult. Neither crosses device boundaries.
Without cross-device tracking, mobile campaigns appear to dramatically underperform while desktop gets over-credited for conversions it only partially drove.
This is common in categories like fashion, electronics, and B2B purchases where customers research before buying.
Ad blockers and browser privacy settings reduce tracking accuracy

Browser privacy updates and ad blockers have made attribution tracking less reliable over the past few years.
Platforms such as Safari and Firefox now restrict many third-party tracking methods by default, which can interrupt attribution tracking for returning visitors.
As a result, analytics tools may underreport conversions when users reject cookies or block tracking scripts.
Every ad platform claims full credit for the same sale
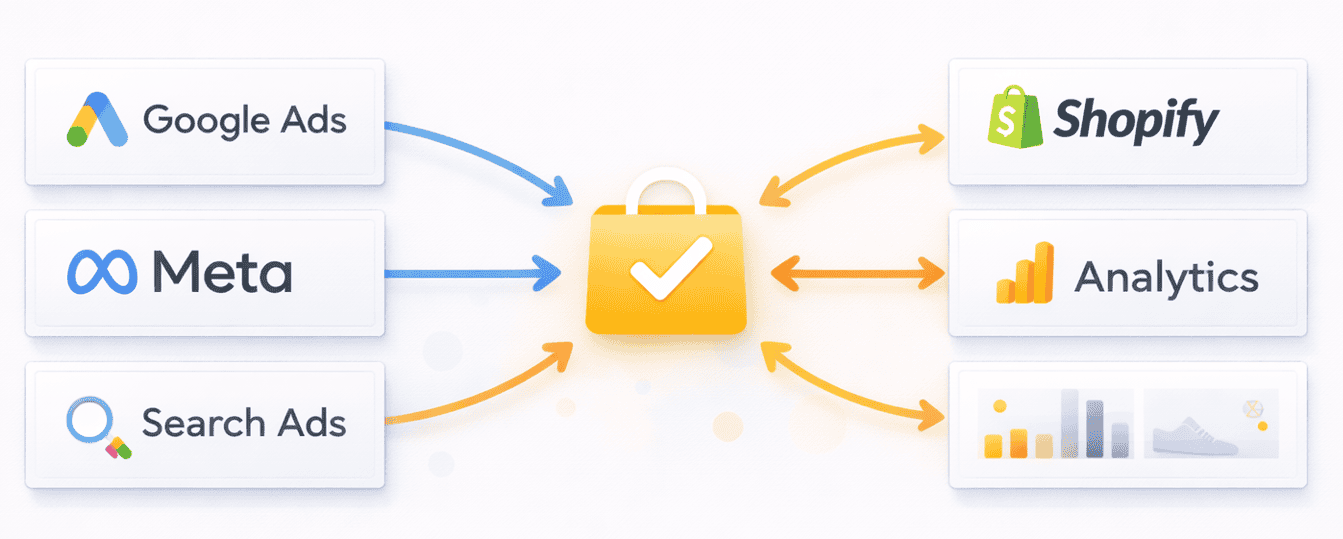
Each platform’s pixel fires independently and attributes the conversion to itself if the customer was within its attribution window.
A customer who clicks a LinkedIn ad on Day 1, a Facebook ad on Day 3, and a Google Shopping ad on Day 12 before converting gets counted by all three platforms.
Summing all platform-reported conversions routinely produces 150 to 250% of actual customers. Because each advertising platform measures conversions independently, the same purchase may appear in multiple reporting dashboards at the same time.
This is one of the main reasons Meta Ads, Google Ads, and GA4 often report different conversion totals for the same campaign period.
Payment gateway redirects can interrupt attribution tracking
When customers leave a store to complete payment through PayPal, Klarna, Afterpay, or bank authentication flows, attribution tracking can sometimes become fragmented if referral exclusions and session settings are not configured correctly.
For example, some Shopify stores see completed purchases attributed to paypal.com referrals inside GA4 instead of the original traffic source.
GA4 simplified its attribution model options
Between May and November 2023, Google removed linear, time-decay, first-click, and position-based attribution models from GA4. Only data-driven and last-click remain.
As attribution reporting evolves inside GA4, many businesses now rely primarily on last-click or data-driven reporting models for analysis.
iOS privacy changes reduced attribution visibility for Meta campaigns
As opt-out rates increased, advertisers began seeing delayed reporting, shorter attribution windows, and lower visible conversion counts inside Meta Ads reporting.
View-through attribution can affect reported ROAS
View-through attribution gives credit to ads a user saw but did not click, if they later convert within a set attribution window. Meta’s default reporting includes a 1-day view-through window.
Since display and video campaigns often receive low click-through rates, a significant portion of reported conversions may come from view-through attribution instead of direct clicks.
Some brands have reduced retargeting spend after discovering that a portion of reported conversions may have occurred even without additional ad exposure.
Why attribution reporting becomes inconsistent
Attribution reporting becomes difficult when multiple devices, browsers, platforms, cookies, payment gateways, and ad networks all measure customer behavior differently.
As customer journeys become more fragmented, reporting discrepancies across tools become increasingly common.
What broken eCommerce revenue attribution actually costs you
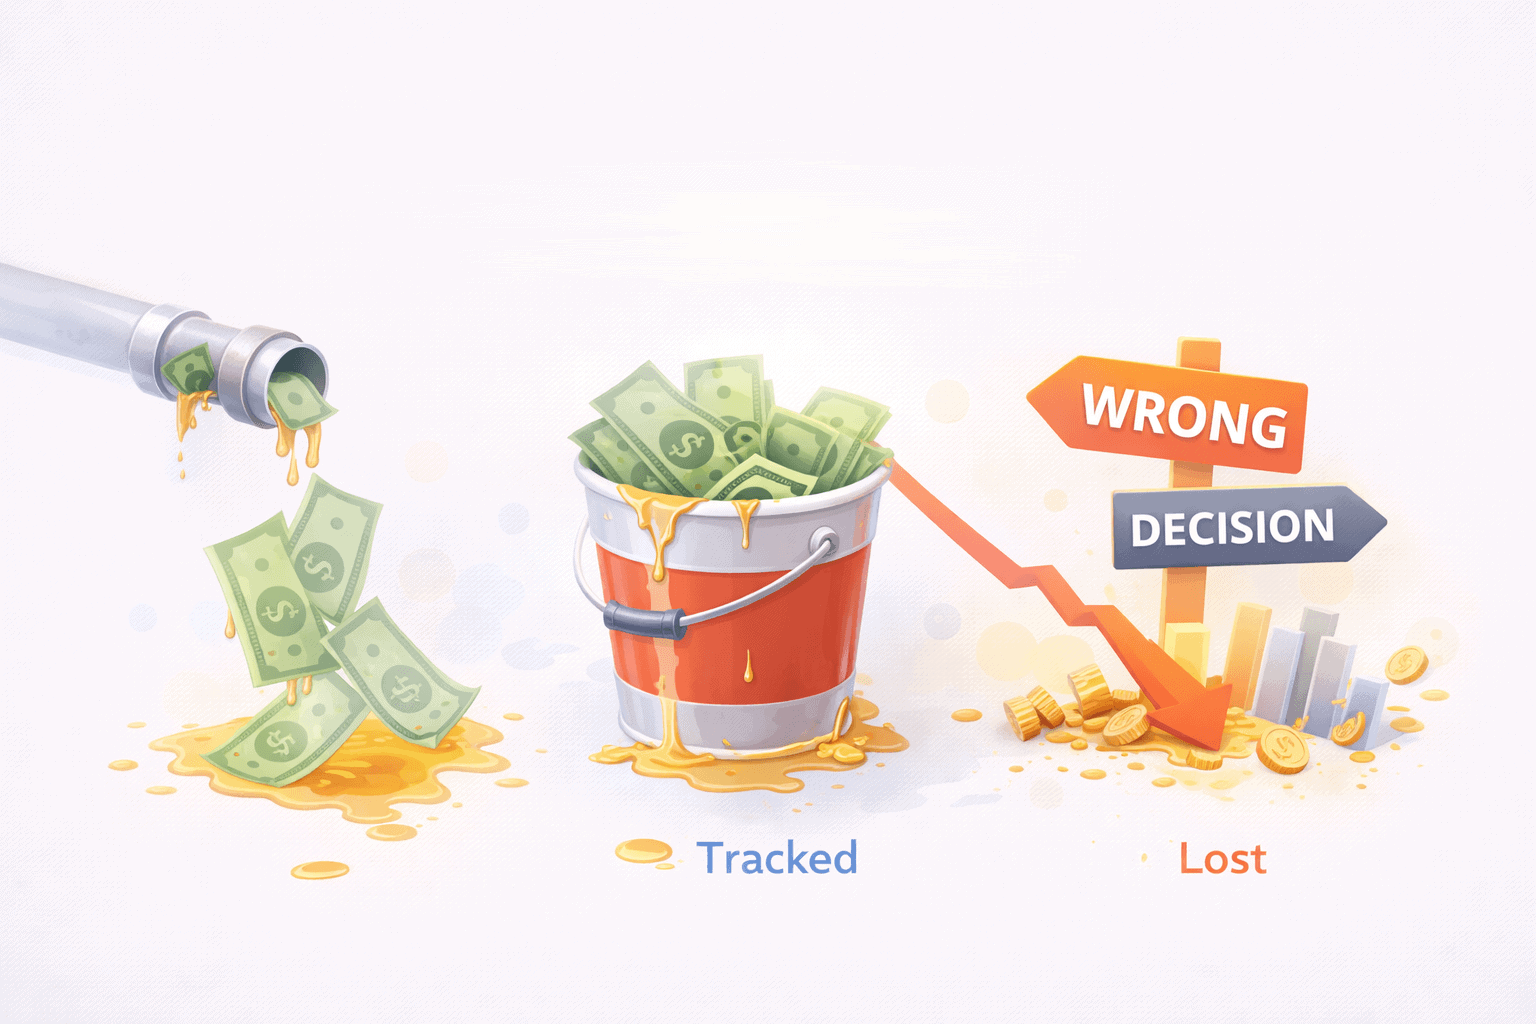
Attribution reporting affects much more than analytics dashboards. It directly influences how marketing budgets are allocated across channels and campaigns.
A common challenge for many eCommerce businesses is that different platforms often report different revenue numbers for the exact same sales period.
| Platform | Reported revenue |
|---|---|
| Meta Ads | $14,000 |
| Google Ads | $18,000 |
| GA4 | $9,000 |
| Shopify | $11,500 |
Same store. Same week. Different attribution logic.
As budgets gradually shift away from awareness campaigns, the business may continue seeing stable results temporarily because earlier demand-generation efforts are still influencing conversions.
Over time, however, customer acquisition can become more expensive as top-of-funnel demand weakens.
Attribution challenges also create reporting and decision-making difficulties for marketing teams:
- Teams often rely on spreadsheets and manual reporting to compare revenue numbers from multiple platforms
- Differences in attribution models can make campaign performance difficult to evaluate consistently
- Marketing and analytics teams may see conflicting conversion data across ad platforms and analytics tools
- As reporting complexity increases, confidence in attribution data often decreases
While no attribution model is perfectly accurate, improving attribution visibility can help businesses make more informed budget decisions, evaluate channels more fairly, and better understand how different touchpoints contribute throughout the customer journey.
Why multi-channel sellers have the worst eCommerce revenue attribution problem
Attribution reporting becomes even more complicated for businesses selling across multiple platforms, marketplaces, payment gateways, and traffic channels.
Instead of relying on one source of truth, multi-channel sellers often have to compare revenue and customer data across several disconnected systems.
Each platform tracks a different part of the customer journey, which is why revenue and attribution reporting often look inconsistent across tools.
Here’s a simplified view of what most platforms can and cannot see:
| Platform | What it tracks well | Main limitation |
|---|---|---|
| Shopify | Orders, revenue, customer records | Limited visibility into pre-purchase marketing journeys |
| GA4 | Website behavior and traffic attribution | May underreport conversions due to cookie restrictions and cross-device tracking |
| Meta Ads Manager | Meta campaign conversions and engagement | Limited visibility into non-Meta touchpoints |
| Google Ads | Search and Shopping ad conversions | Does not fully capture social or marketplace influence |
| Amazon | Marketplace sales and Amazon ad performance | Sales data remains inside Amazon’s ecosystem |
| Stripe and PayPal | Transaction and payment data | Limited marketing and attribution insights |
For businesses selling through platforms such as Shopify, Amazon, Etsy, Stripe, and PayPal simultaneously, building a unified view of revenue and customer activity often requires combining data from multiple systems.
Many teams eventually end up exporting reports into spreadsheets just to compare platform-level revenue numbers side-by-side.
Managing reporting across multiple channels often involves manual reconciliation work such as aligning currencies, adjusting time zones, removing duplicate transactions, and comparing attribution reports across dashboards.
As more sales channels and marketing platforms are added, maintaining a reliable view of overall business performance becomes increasingly difficult without centralized reporting.
This is one of the main reasons many growing eCommerce brands invest in consolidated analytics and reporting systems rather than relying on individual platform dashboards alone.
What better eCommerce revenue attribution actually looks like
Perfect attribution is difficult because modern customer journeys span multiple devices, channels, platforms, and sessions.
For most eCommerce businesses, the goal is not perfect tracking accuracy but building a reporting system that is reliable enough to support better marketing and budgeting decisions.
Understand that different platforms measure attribution differently
It is common for Meta Ads, Google Ads, GA4, and Shopify to report different conversion totals for the same reporting period because each platform uses its own attribution model and conversion window.
Platform-level reporting is still useful for optimizing campaigns within each channel, but comparing performance across platforms usually requires additional context and consolidated reporting.
Use multiple data sources as lenses, not verdicts
The most practical attribution framework combines your eCommerce platform for actual revenue, GA4 for behavioural and funnel data, post-purchase surveys asking customers directly how they found you, and UTM parameters for campaign-level tracking.
Together these provide a more complete view of customer behavior and revenue attribution than any single tool alone.
Build server-side tracking as part of your attribution setup
Server-side tracking sends conversion events directly from your server to analytics and advertising platforms instead of relying entirely on browser-based scripts.
This approach can improve data reliability by reducing the impact of ad blockers, browser privacy restrictions, and cookie limitations.
Collect first-party customer data wherever possible
Email addresses, customer accounts, CRM records, and post-purchase surveys provide attribution insights that are less dependent on third-party cookies and browser tracking rules.
As privacy regulations and browser restrictions continue evolving, first-party data becomes increasingly important for long-term attribution reporting.
Use incrementality testing to measure campaign impact
Attribution reports show which channels were involved in a conversion, but incrementality testing helps estimate whether those conversions would have happened without the campaign exposure.
Tools such as Meta Conversion Lift and Google Conversion Lift can help businesses measure the broader impact of advertising campaigns beyond standard attribution reports.
For businesses managing multiple stores, platforms, and payment systems, consolidated reporting often becomes just as important as attribution modelling itself.
How Putler approaches eCommerce revenue attribution differently
Many attribution tools focus primarily on improving conversion modelling and campaign reporting.
For many eCommerce businesses, however, the larger challenge is consolidating reliable revenue and customer data across multiple platforms in the first place. This is where Putler focuses differently.
Most eCommerce revenue attribution problems do not start with a modelling question. They start with a data quality problem.
Many attribution inconsistencies begin with fragmented reporting across stores, payment gateways, analytics platforms, and marketplaces. Before comparing channel performance, businesses first need a reliable view of orders, revenue, refunds, and customer activity across all connected systems.
Consolidated revenue reporting across platforms: Putler connects to 17+ data sources including Shopify, WooCommerce, PayPal, Stripe, Amazon, Etsy, eBay, Google Analytics, and Google Search Console as completely separate integrations.
Every transaction runs through an automatic eCommerce data consolidation engine. The same sale appearing in both WooCommerce and Stripe gets merged into one record. Currencies convert using actual daily exchange rates across 36 supported currencies. Timezones align automatically.
Connecting traffic and transaction data: Putler’s Audience Dashboard connects GA traffic data to actual transaction data. It shows not just how many visitors each channel sent but how much revenue those visitors generated: sales per visitor by channel, conversion rate by traffic source, and search keywords tied to actual purchases rather than just traffic volume.
Unified reporting for multi-channel businesses: For stores selling on Shopify, Amazon, and Etsy with PayPal and Stripe handling payments, the eCommerce dashboard shows total revenue, top products, and top customers across every source in one place. The 10 to 15 hours spent weekly on manual reconciliation disappears.
Additional customer and product insights: Beyond revenue accuracy, Putler adds customer lifetime value calculated automatically across all connected platforms, RFM segmentation scoring every customer into 11 behavioural groups, unified customer profiles combining purchase history across every connected channel, a sales heatmap showing peak revenue hours and days, and product analysis identifying top products across all platforms combined.
Putler is not designed as a standalone multi-touch attribution modelling platform. Instead, it helps businesses consolidate revenue, customer, and transaction data from multiple sources into a more unified reporting view.
For many growing eCommerce brands, having cleaner and more centralized business data becomes an important foundation for making better attribution and marketing decisions.
- eCommerce Data Consolidation: How Putler Connects and Cleans Data from 17+ Sources
- eCommerce Analytics 101: A Complete Beginner’s Guide
- eCommerce Metrics: The Complete Guide to Measuring Your Store’s Performance
- Analytics Dashboard: How to Build One That Actually Drives Decisions
- Marketing Analytics: How to Measure What Actually Drives Growth