In this digital world, interacting with customers is no longer confined to physical stores. Digital channels like email, social media, online ads, and search engines have transformed businesses
Research shows that brands are taking notice.
- 40% of brands planned to increase their data-driven marketing budget.
- Businesses using analytics make 5-8 times more ROI compared to those who don’t.
- 64% of marketers agreed that data-driven strategies were crucial.
A detailed marketing assessment can help you establish a strong foothold in the competitive landscape within your industry.
In this guide, I will tell you everything there is to know about marketing analytics and how to deploy it for your business.
Let’s get started.
What is marketing analytics?
Marketing analytics involves tracking, managing, and analyzing data of marketing campaigns to understand their Return on Investment (ROI) and take corrective action for success.
It helps you in effectively introduce your brand and products to the target audience.
Understanding the definition is one thing, but knowing why it matters is where the real impact begins.
Why is marketing data analytics important?
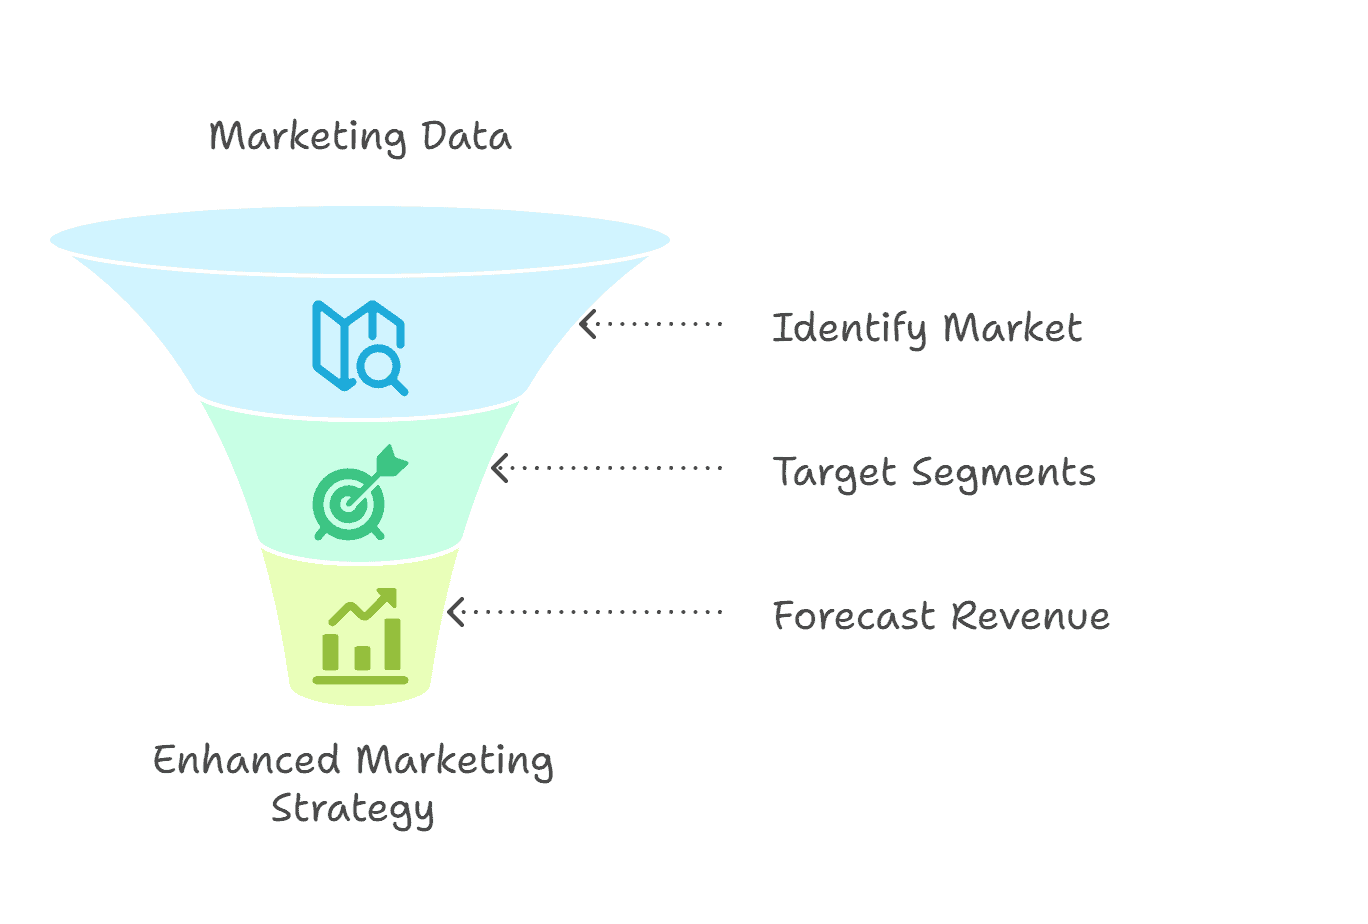
In recent years, marketing data has become very important. You can easily identify the market, target potential customer segments, and forecast revenue.
Here’s how analytics can transform your marketing efforts:
Calculate ROI on marketing
Knowing your ROI is essential for attributing marketing efforts to revenue. ROI can be calculated as
ROI = (Net Profit/ Cost of Investment) * 100
Analytics provides this alongside details specific to each campaign.
Back claims & decisions with data
Without concrete information, decisions related to marketing campaigns and budgets could go wrong.
For instance, you may want to increase spending in Asia but don’t know how much. Also, you won’t be able to justify the failure and this can set you back for a long time.
You can avoid this by leveraging analytics, which can provide relevant data points to support your decisions.
Process actionable insights
Consider this. One of your previous campaigns was a hit with a handsome ROI. Now, you want to replicate it.
But was last year’s campaign a result of industry-wide growth? Did a certain audience favor your product or service more than others?
You can answer these questions, gather insights, and action them in future plans through analytics.
Keep focus on goals
Before executing any marketing campaign, businesses set goals or outcomes. Using a mind map can be a great way to organize these goals and break them down into actionable steps.
Analyzing marketing data helps measure performance and check if you’re keeping up with it.
Benefit business
Ultimately, analytics can benefit your bottom line. You can speed up processes, making yourself agile in challenging situations. Insights from consumers can shape marketing strategies.
Businesses can make qualitative as well as quantitative changes in marketing plans.
Beyond the benefits, analytics also solves real-world challenges businesses face every day.
Marketing analytics can solve problems
Market analytics can also solve some real business challenges, too.
Problem 1 – I find it challenging to interpret data
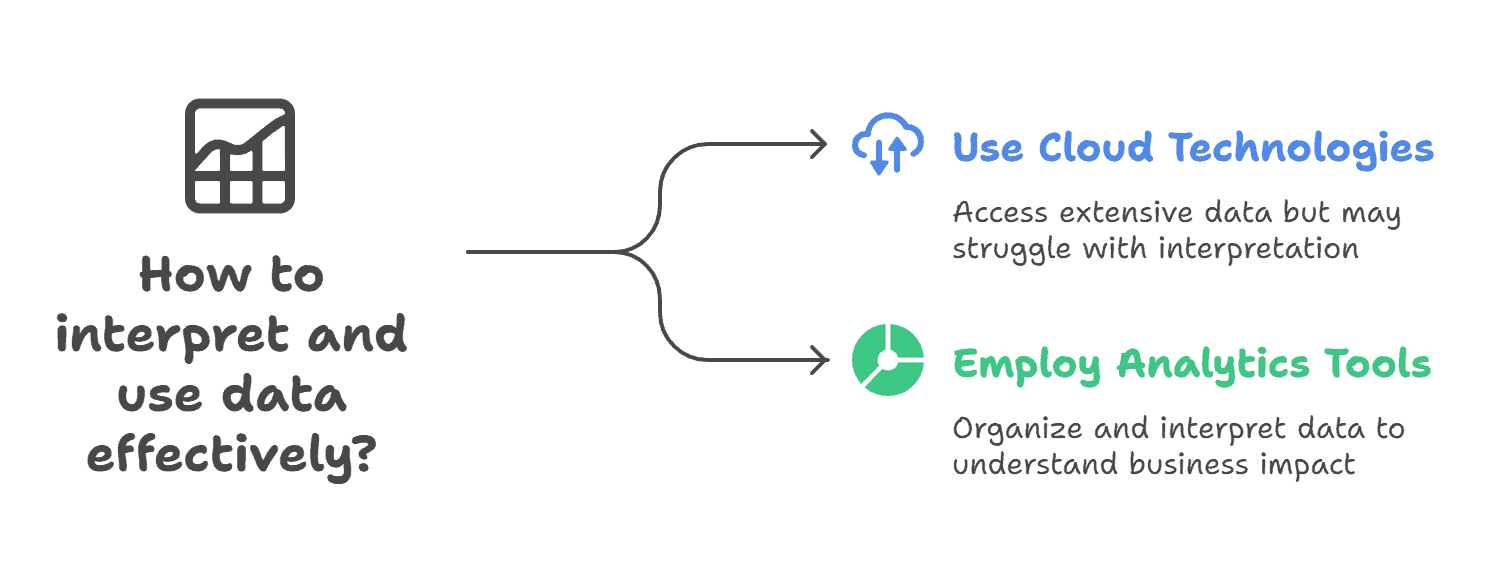
With cloud technologies, most businesses can access extensive information. However, there’s a general problem in finding the correct data or interpreting it.
As an entrepreneur, you may know the email open rate or the number of clicks on a particular social post.
However, you can’t assign importance to these metrics or determine their impact on business.
Analytics can sift through chunks of data, organize the right metrics, and show how you can interpret them.
Problem 2 – I don’t know which metrics are tied to success
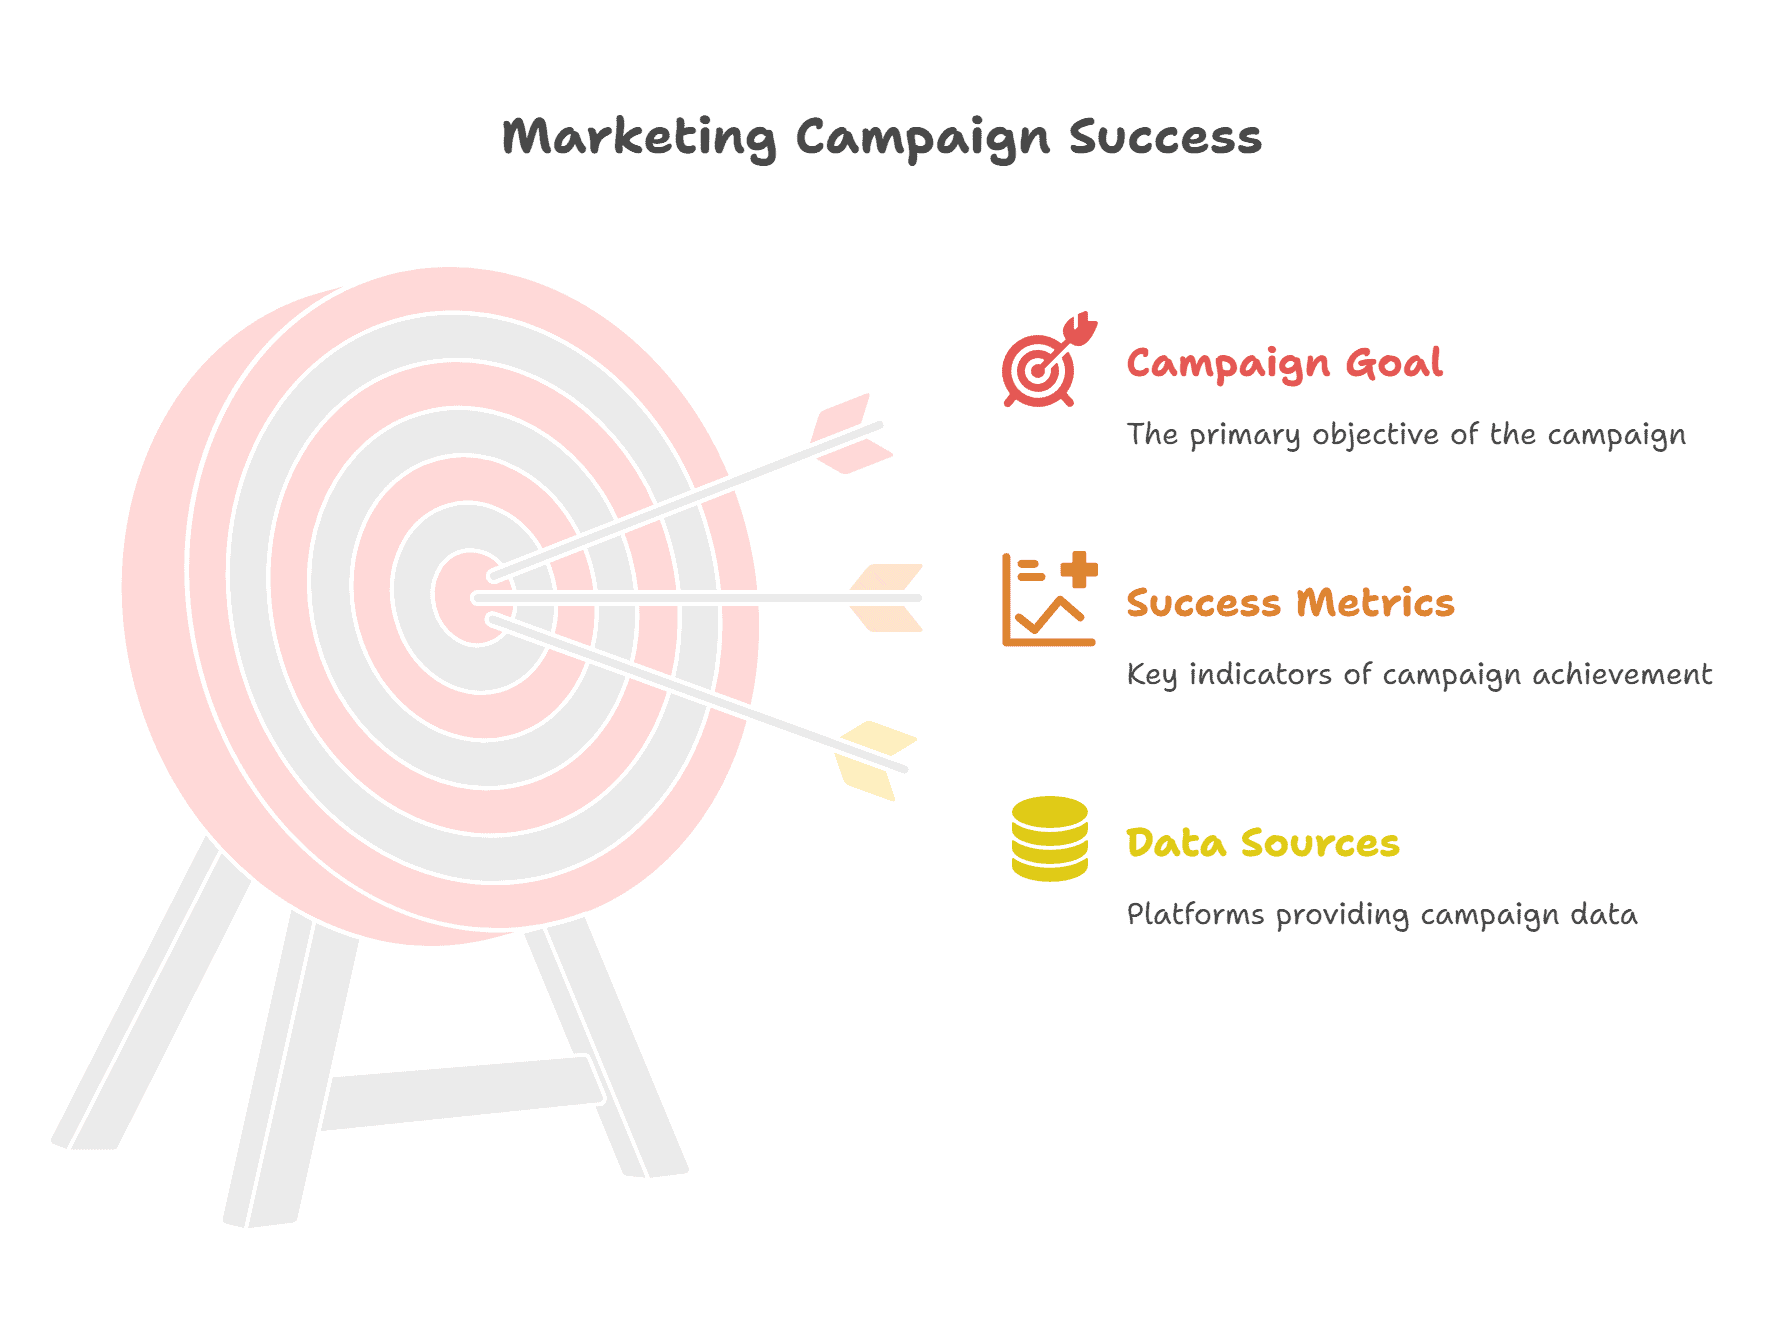
Marketing campaigns are often grouped with one primary goal or objective. As a result, you need to look at multiple metrics from different channels. For instance, you may have data from Google Analytics (GA), social media, and more.
Marketing data analysis can unify data from multiple sources, showing you the metrics that helped achieve success.
Problem 3 – I don’t know how my data impacts revenue
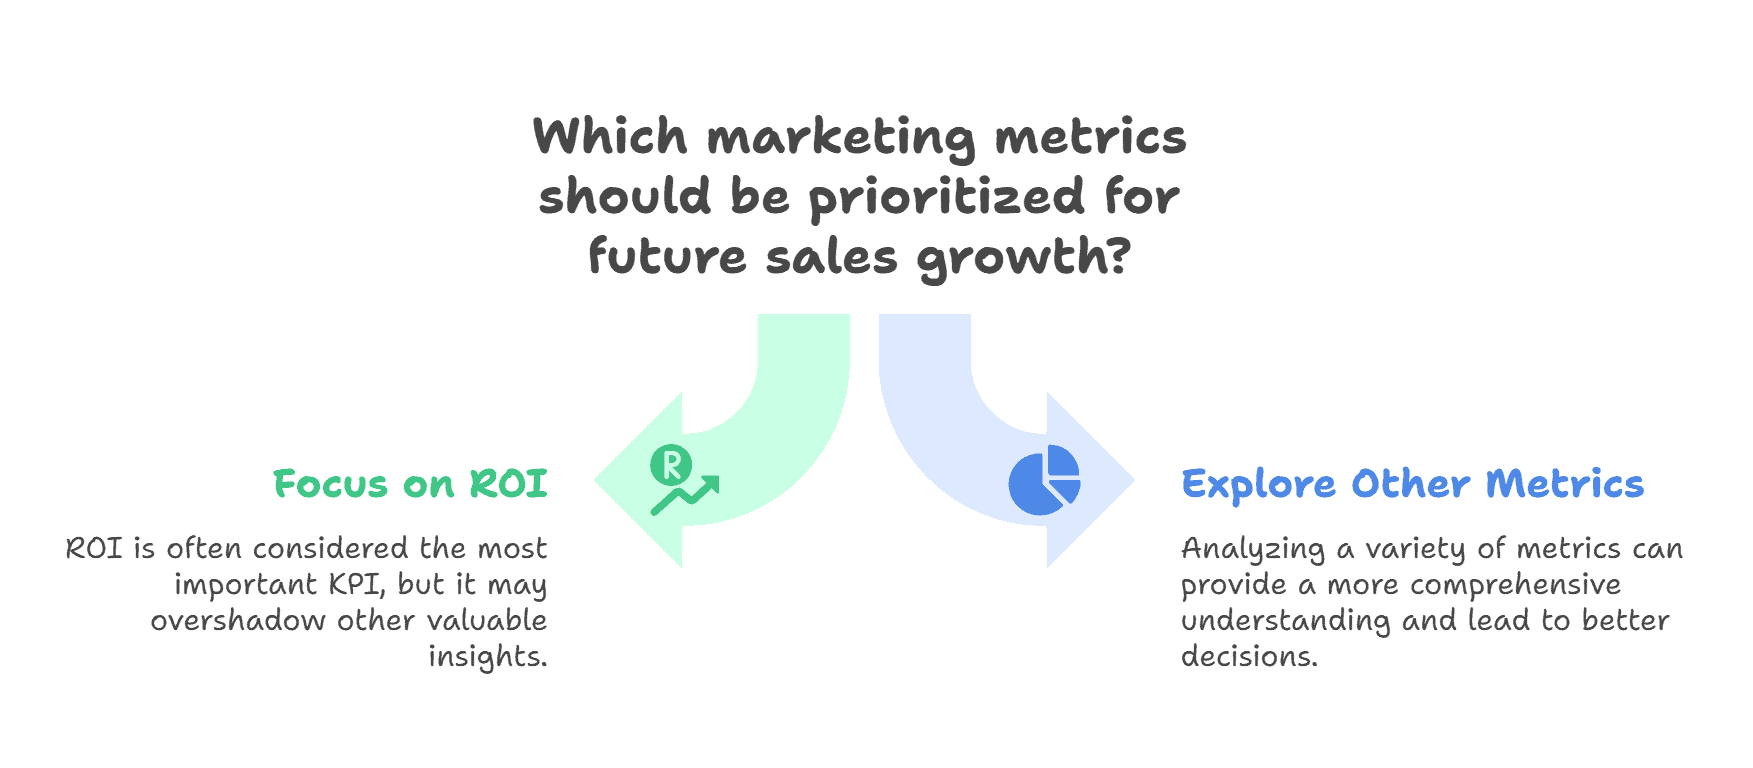
Most of the time, ROI is considered the most important KPI. As such, other insights may be ignored.
However, each report comes with a wealth of analyses for making decisions to boost sales in the future. Marketing data analysis provides all this information.
Problem 4 – I struggle with predicting upcoming trends
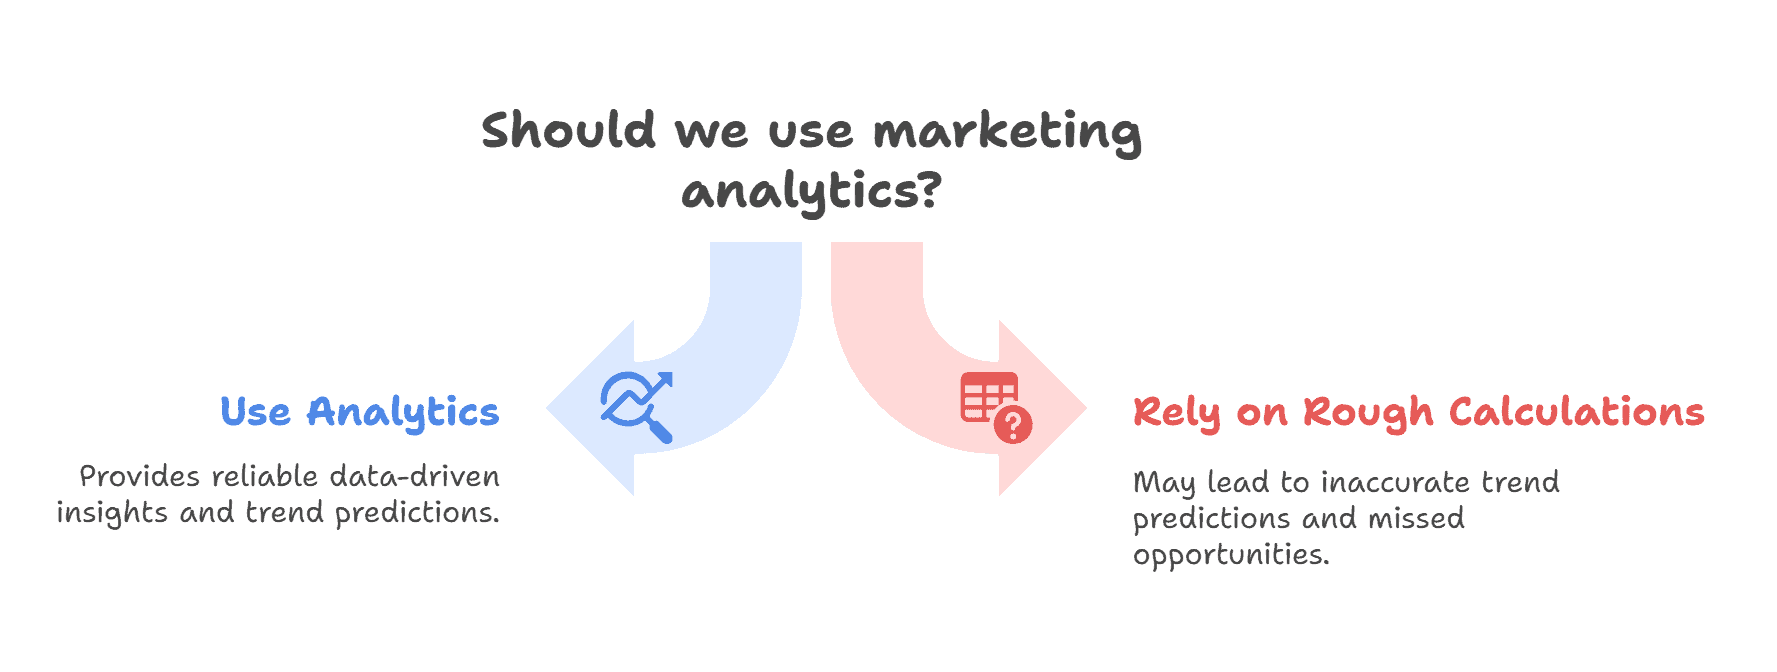
Without analytics, companies often rely on rough calculations to foresee trends. These models aren’t reliable because various factors could affect your business.
What if December seemingly brings in the highest revenue but isn’t your best-performing month? How would you find out which month is the best, what the previous year’s revenue was, and compare it?
Marketing analysis uses sophisticated software to help you with this information in a matter of minutes.
Once you know the problems it tackles, the next step is learning how to put analytics into action.
The marketing analytics process
Want to deploy marketing data analytics for your business?
Here are the steps to carry out marketing analytics:
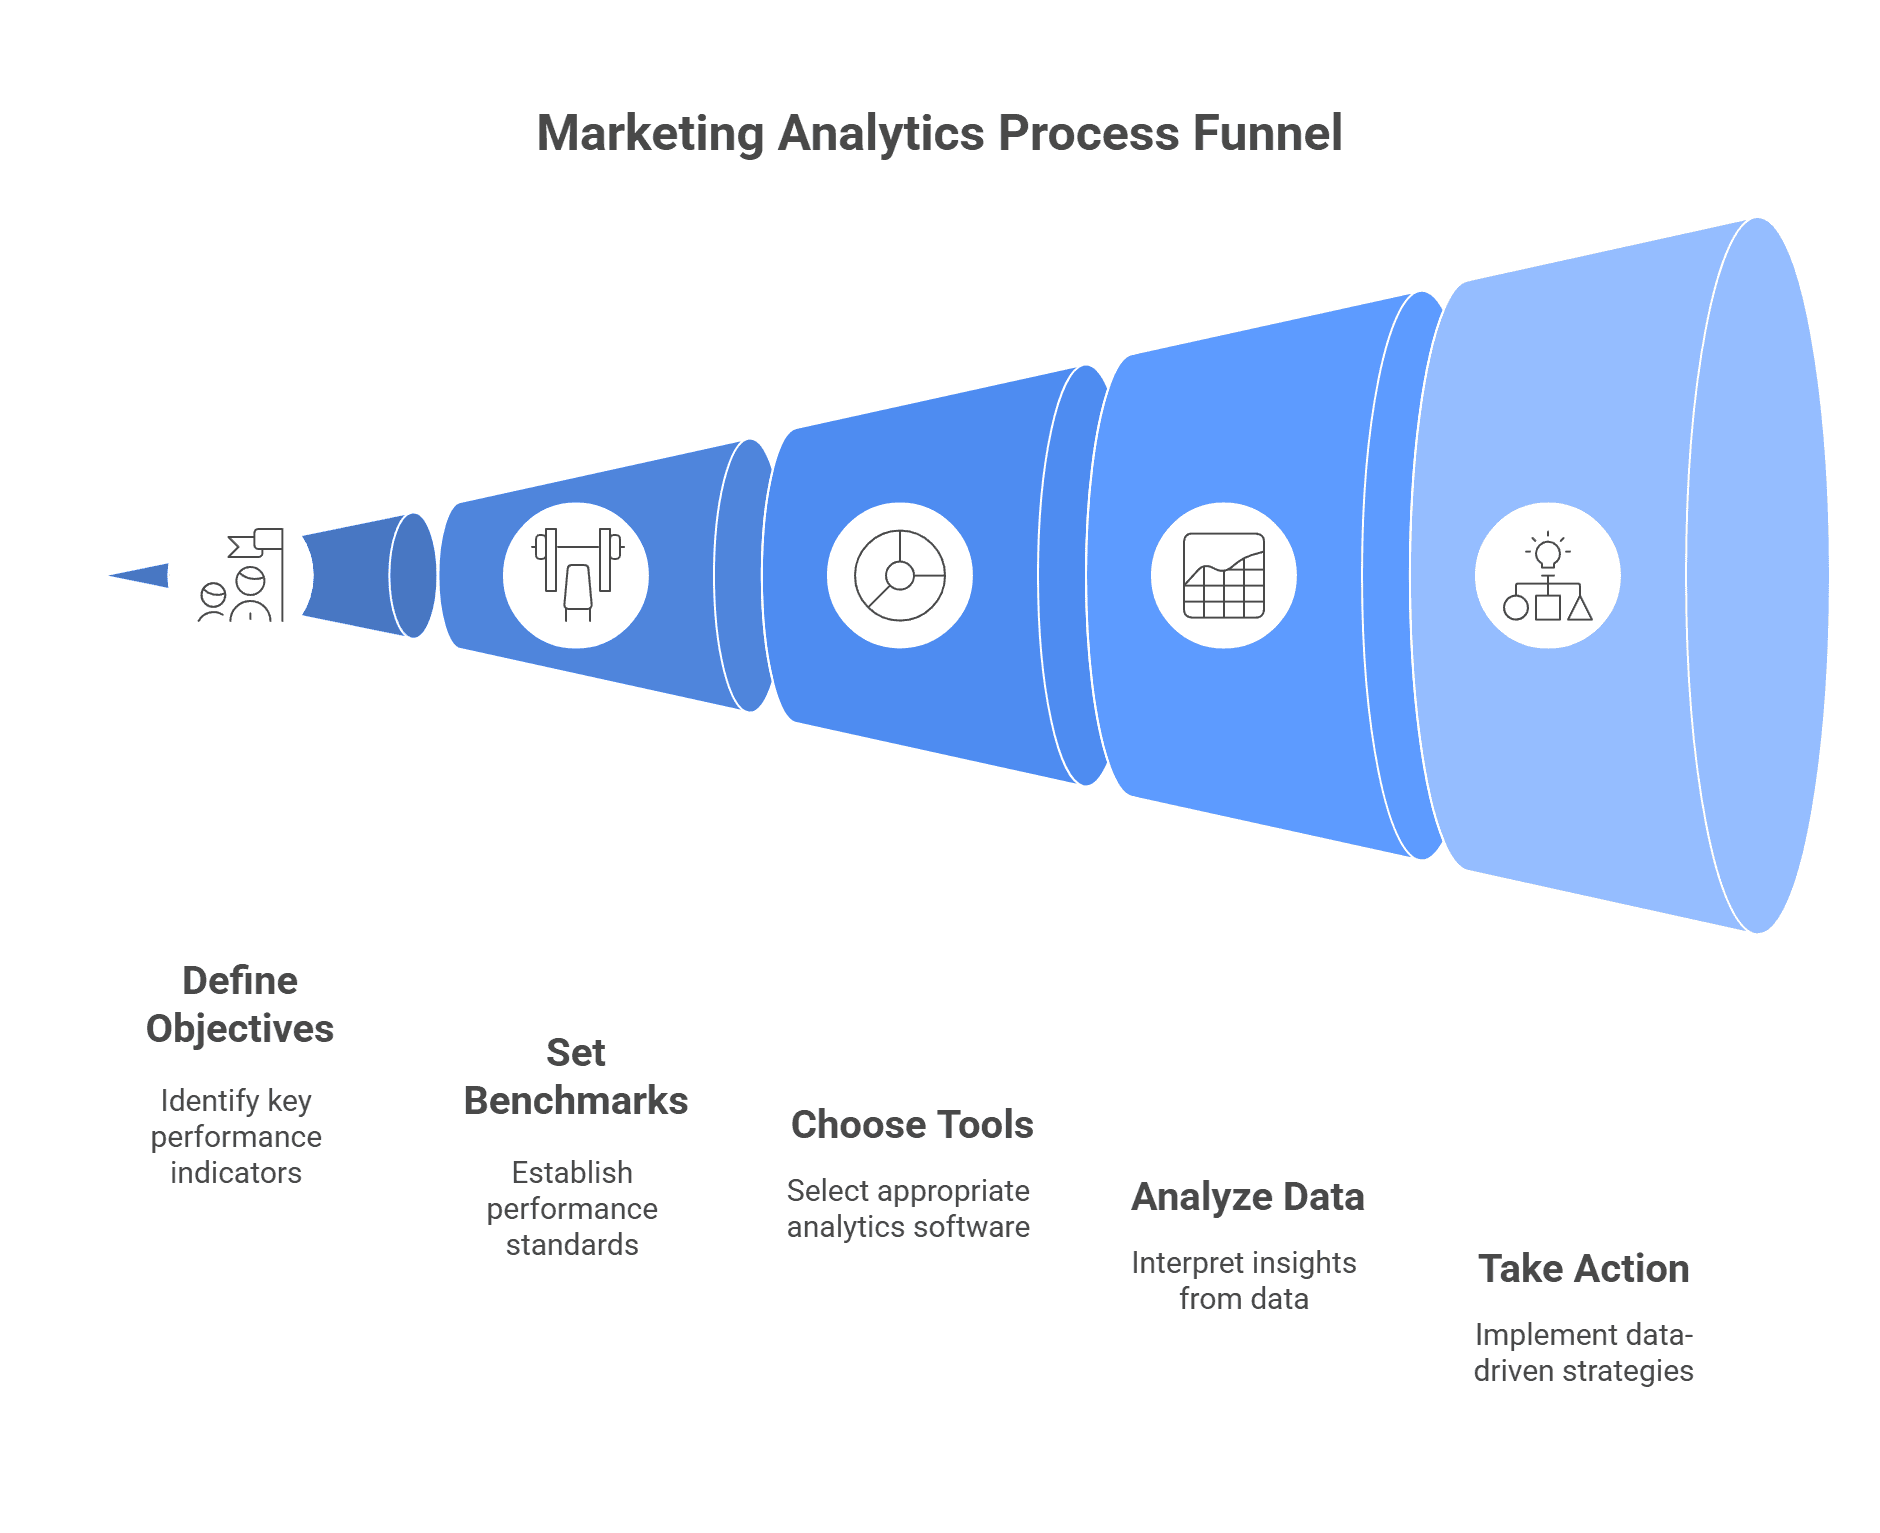
Step 1: Figure out what you want to measure
Before you dive into market analytics, first list what you’re trying to achieve.
Do you want to increase ROI? Or find which campaign performed better?
Set objectives for reporting to ensure you stay focused on key insights.
Step 2: Establish benchmarks and capabilities
Set benchmarks you need to follow for success. Also, take stock of your current capabilities.
Perhaps you aim to increase ROI by 50%, but with only 30% possible based on available resources.
Step 3: Employ a marketing analytics tool
Implement your marketing analytics software to start gathering insights.
A good Woo analytics tool, like Putler, will unify data from multiple sources.
It’ll also set you up for success by helping you use the right team and tactics.
Step 4: Analyze and take action
When insights come in, you can figure out which marketing activities are successful.
You could also find other data such as best-performing location, highest revenue month, top lead-generating mediums, and more.
Accordingly, you can determine the next steps and take action.
While the process looks straightforward, having the right tool makes it much easier to implement.
Putler can be your marketing analytics companion
Unify data from various sources
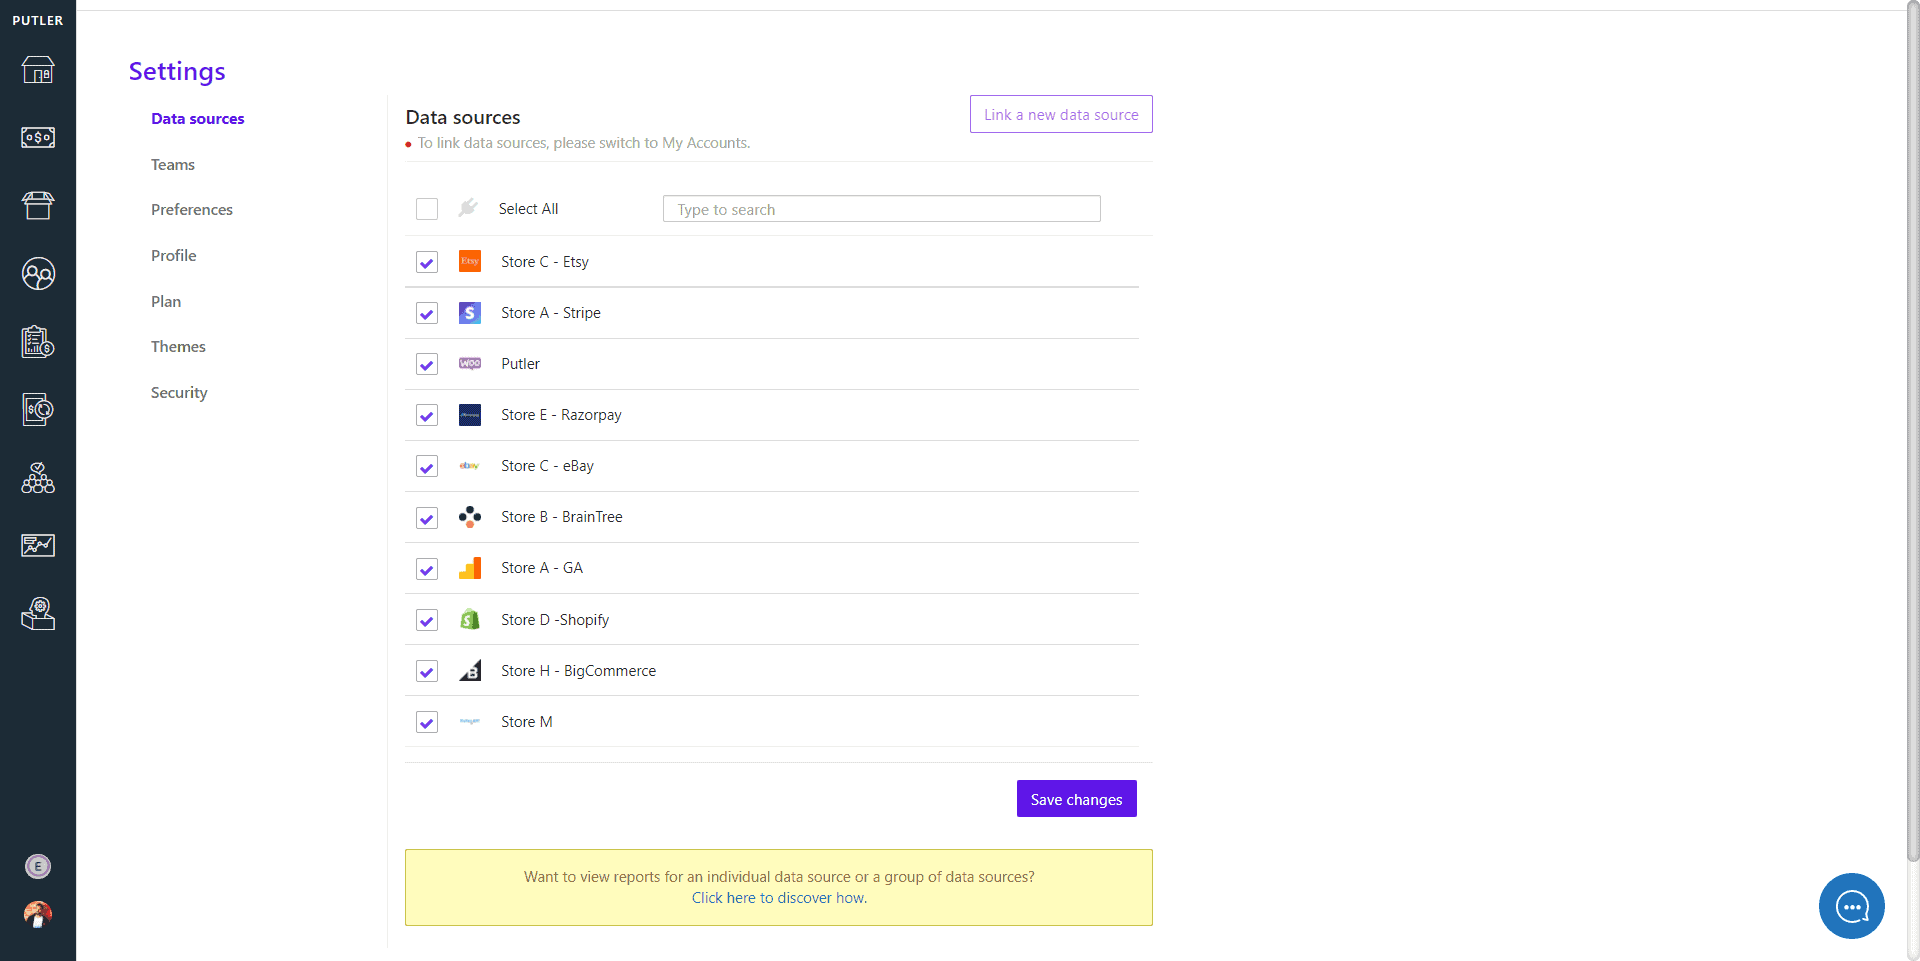
Putler pulls in data from several sources, including your store(s), payments gateway, shopping cart, social media, and GA, on one single interface. It also includes details from different locations and several products. In all, as many as 20 data sources are captured.
Benefit: Unifying all the data in one place helps decision-makers get the whole picture of the business. It helps keep track of finances, profits, and losses. Since all the data is in one place, decision-makers can get a true sense of the business and then make data-driven decisions with utmost confidence.
Set informed goals
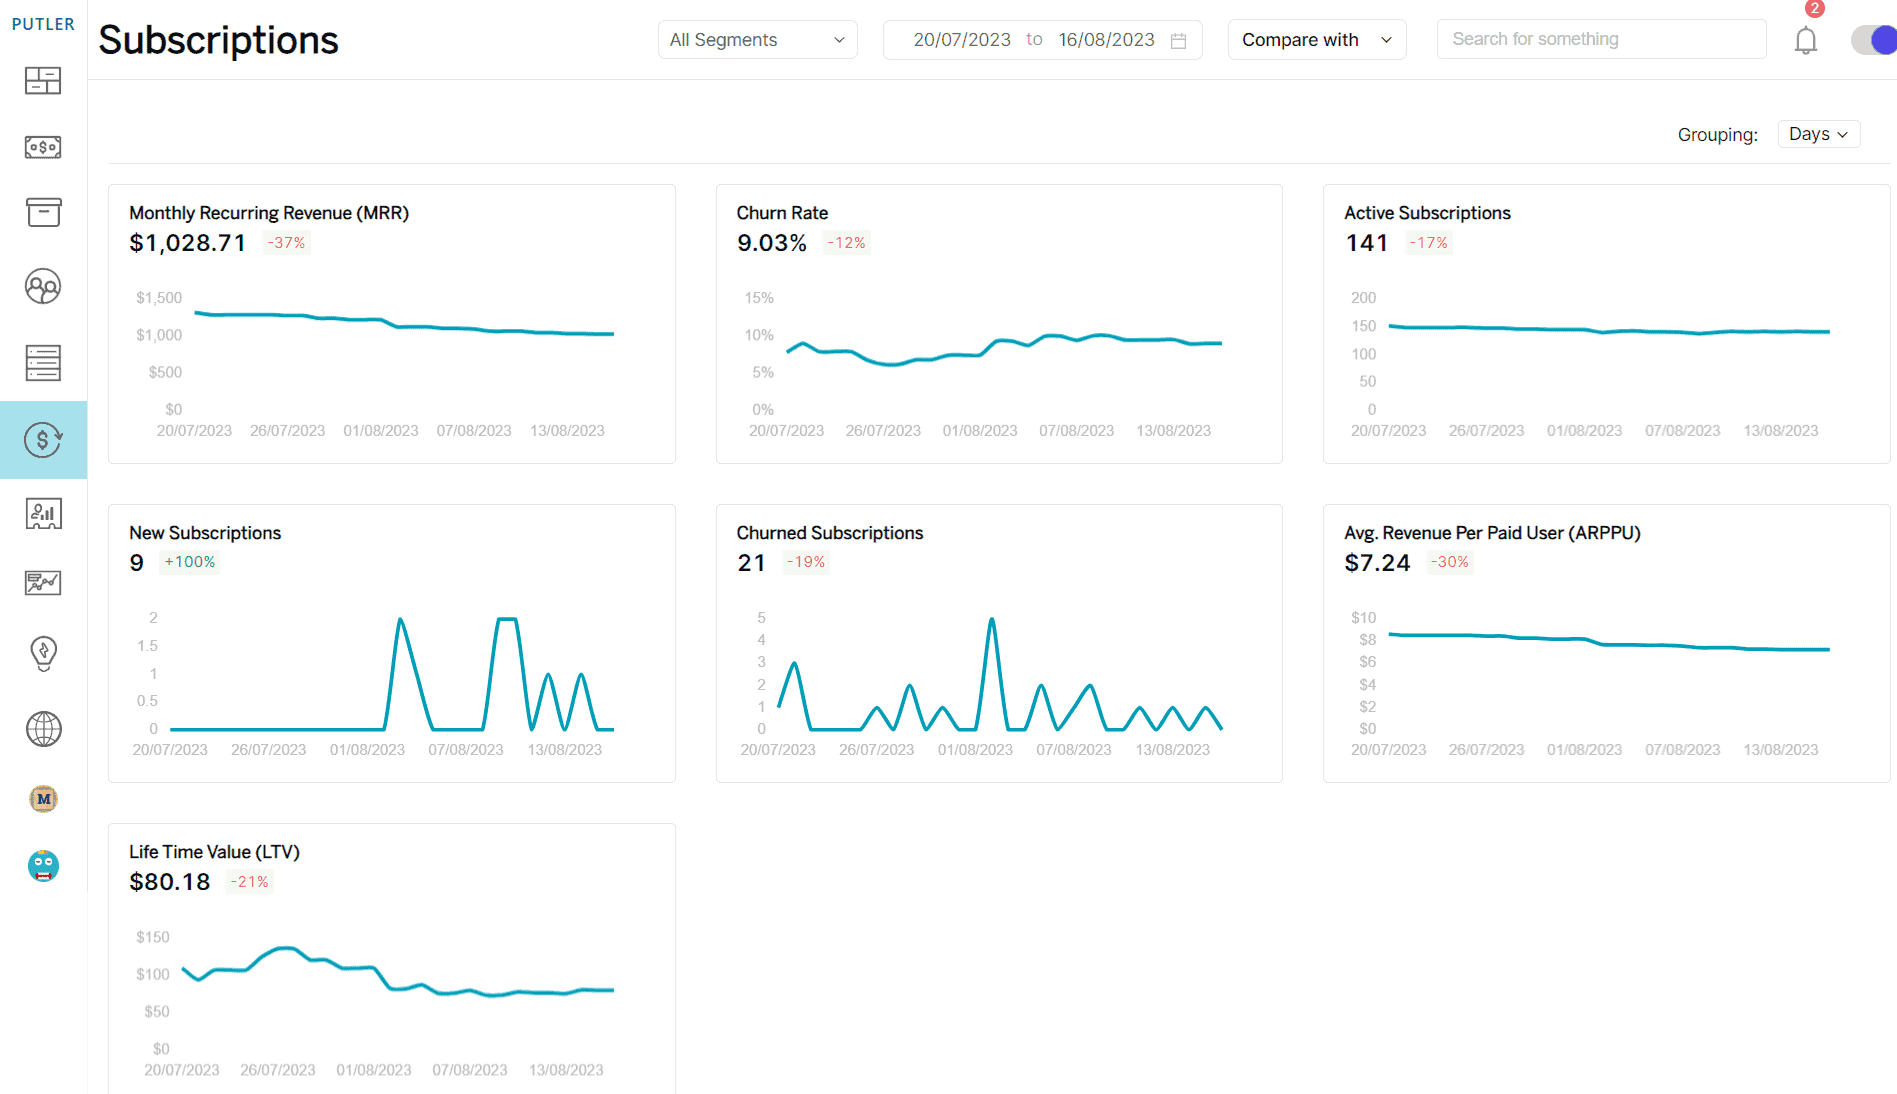
You’ll also have access to Average Revenue Per Customer, Average Lifetime Value (LTV), Monthly Recurring Revenue (MRR), Churn Rate, Click Through Rate (CTR), and more. By tracking these metrics, you can set data-backed and actionable goals.
Check out the complete list of metrics here.
Benefit: Putler provides you the most important KPIs which help you track your business goals. Also, since you can invite your team to Putler, it acts as a good yardstick to keep everyone on the same page.
Segment customer data
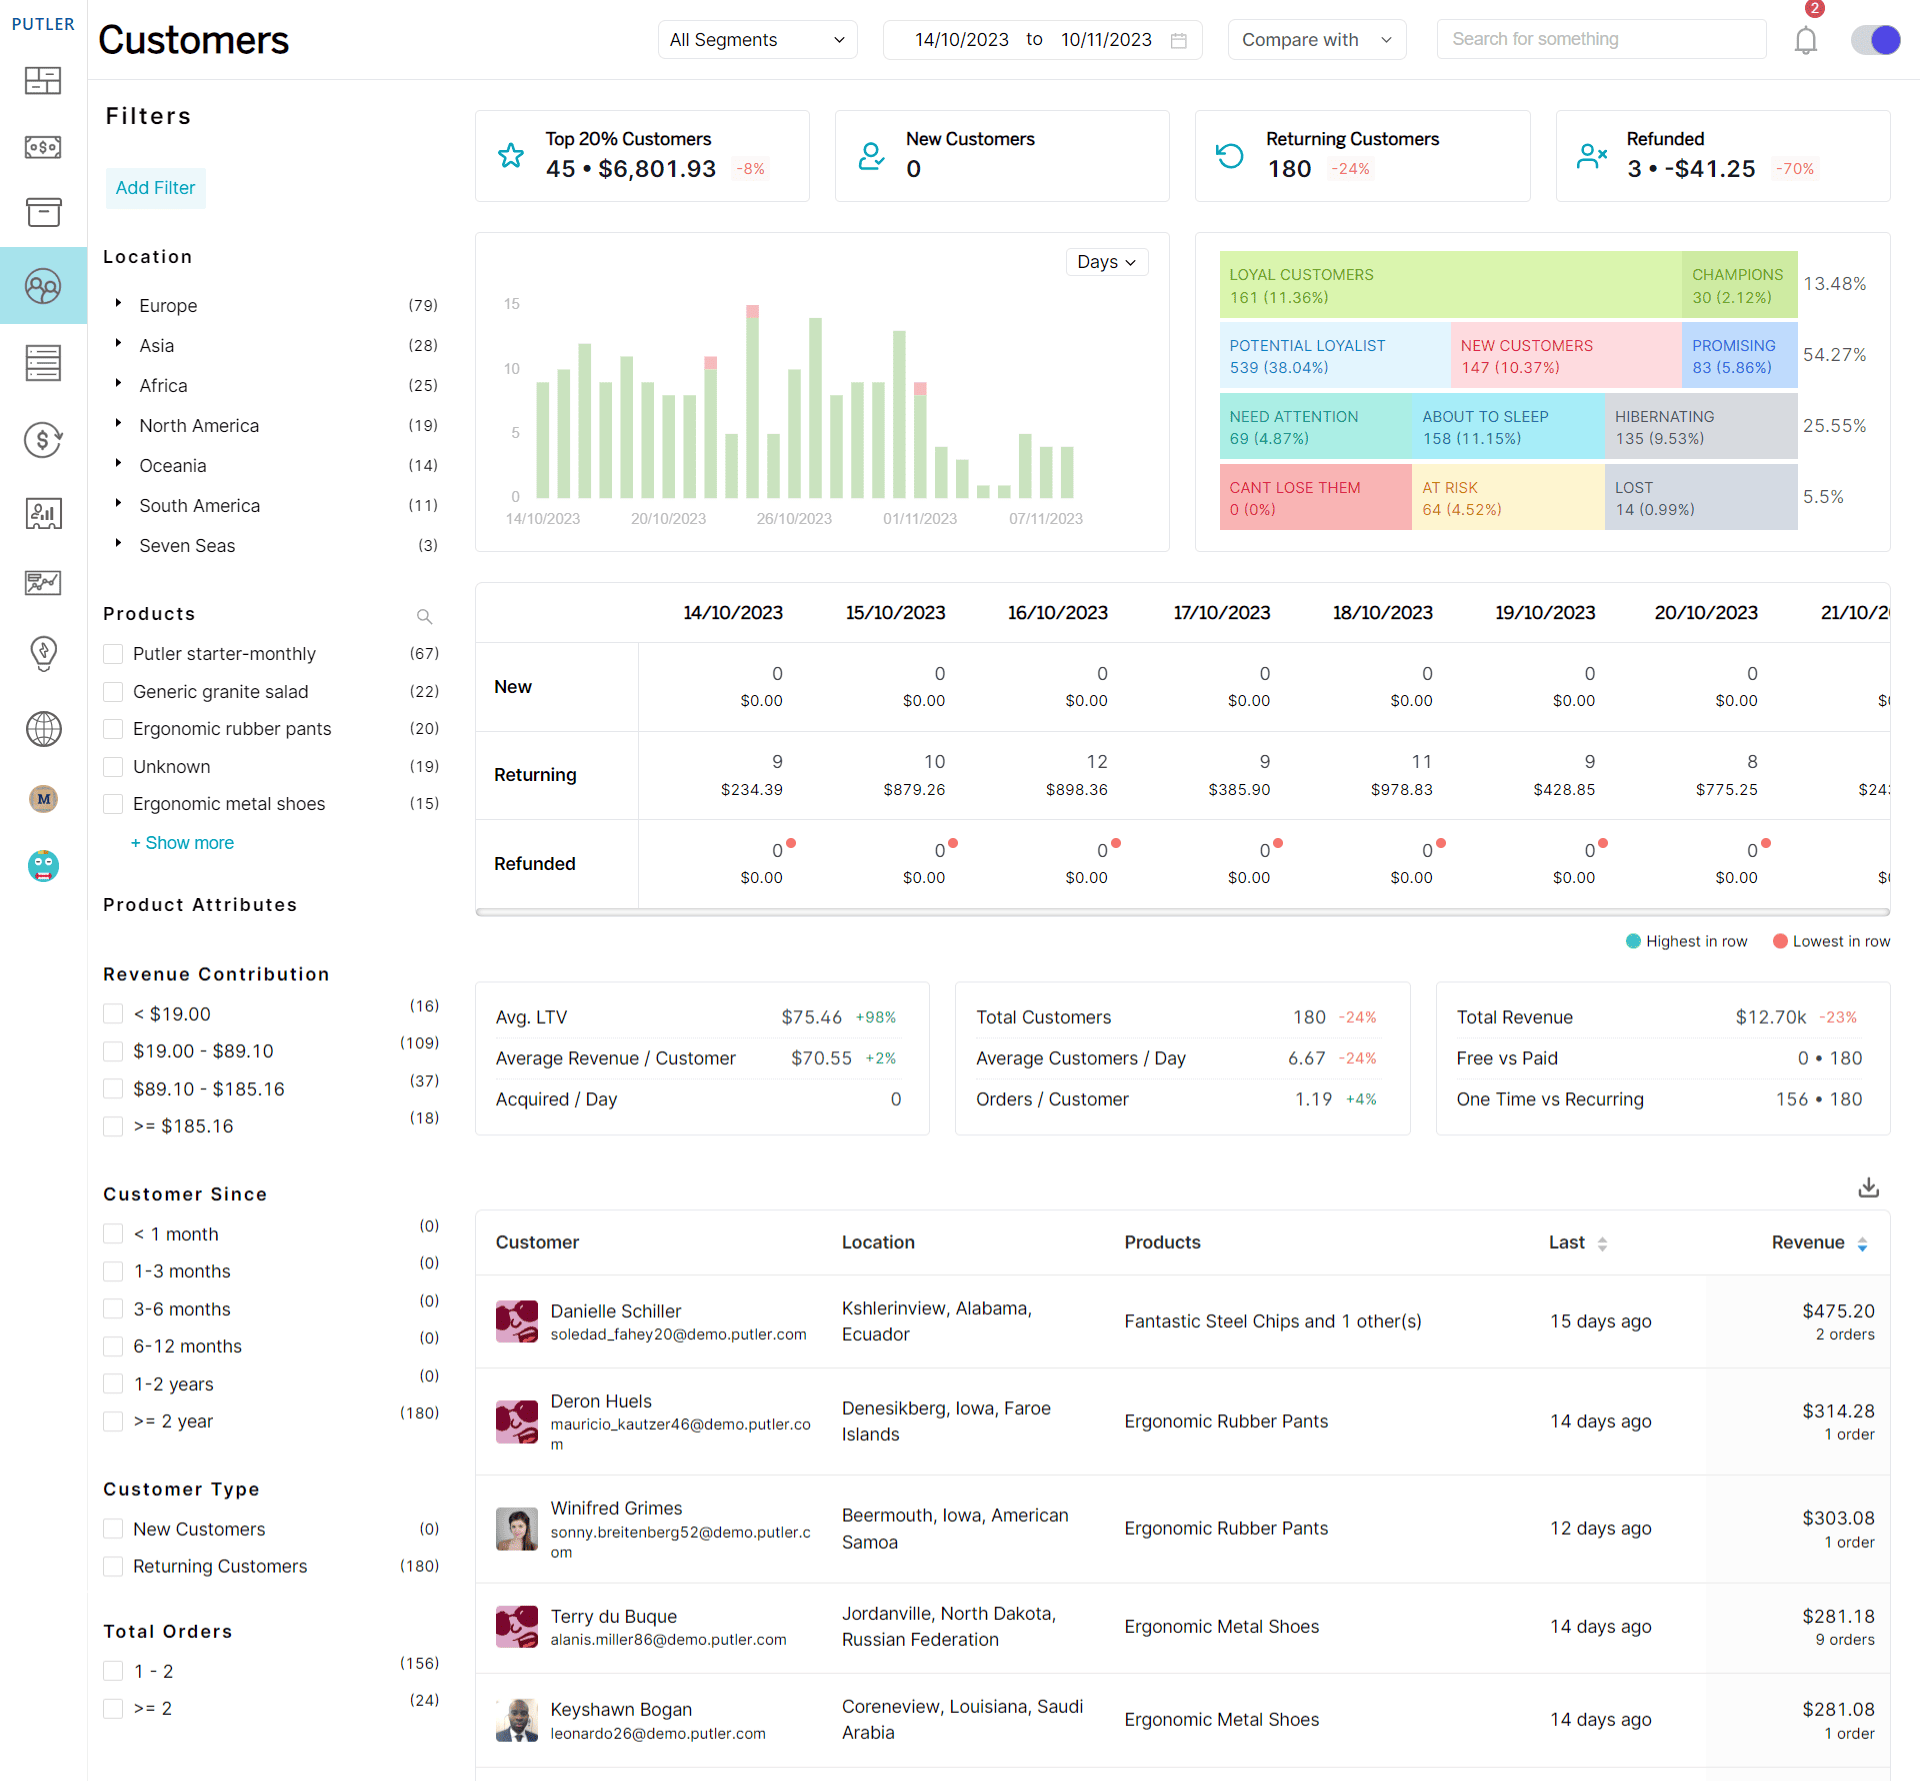
There’s a lot for you to play with. In the ‘Customers’ section, you can filter through location, products, customer type, loyalty, and even revenue contribution. Putler also has a ready-to-use segmentation method called RFM segmentation.
Benefit: You can utilize Putler’s infinite segmentation options to create smart segments, enabling targeted marketing activities such as sending targeted emails and social media advertisements.
Picture the future
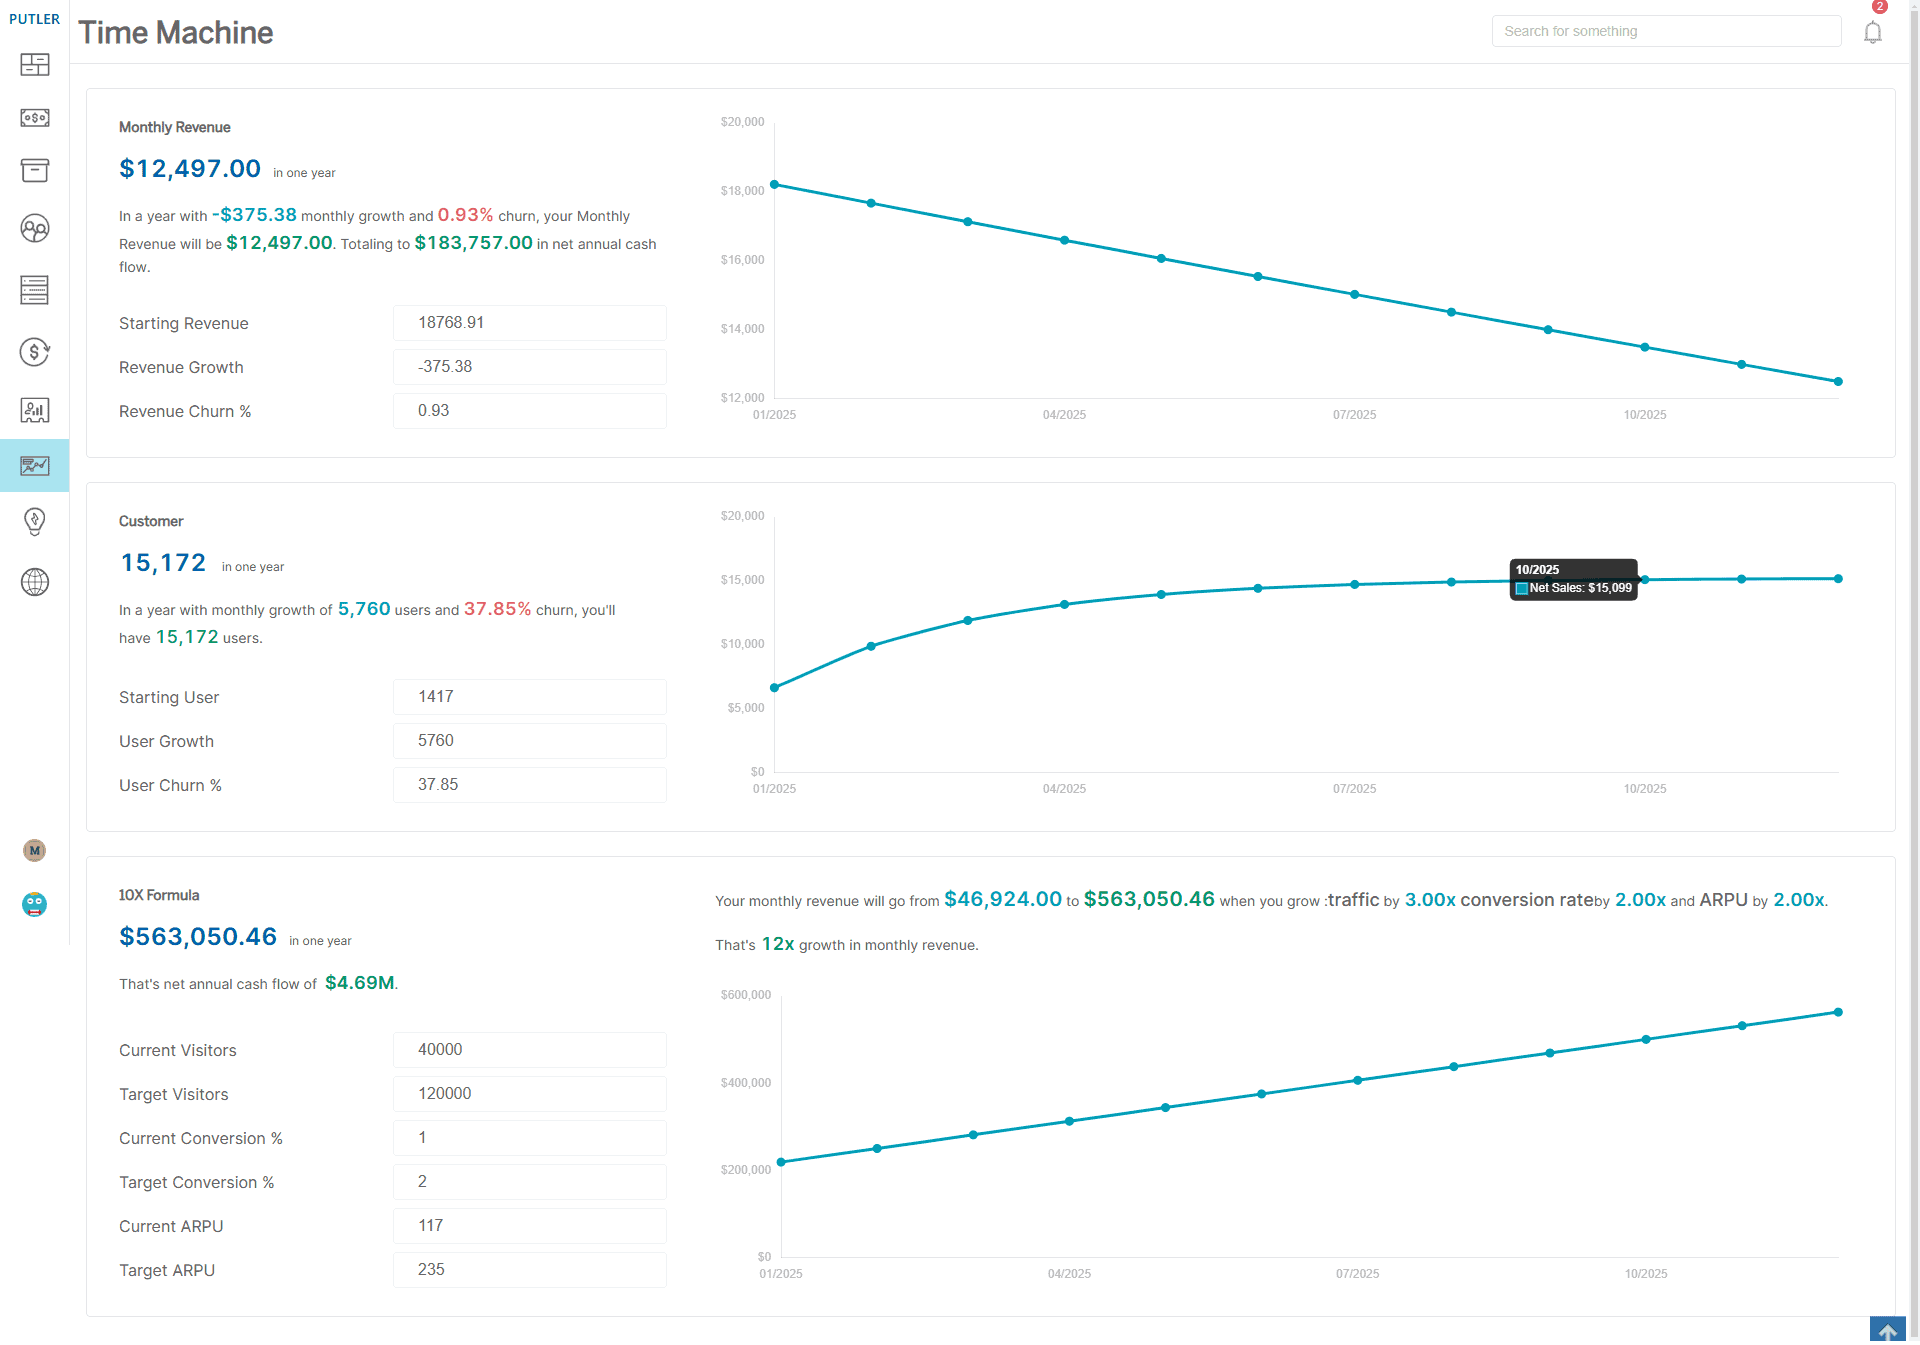
Putler keeps you on track for the future with its Time Machine. With it, you can forecast revenue as well as customer growth in a matter of clicks. The Time Machine helps make informed predictions based on past data curated by the tool.
Benefit: Forecasting revenue and customer growth is crucial when setting up annual/quarterly goals. Putler provides you with an annual forecast, making it easier for the team leaders to create better strategies and achieve targets.
Understand what works (and what doesn’t)
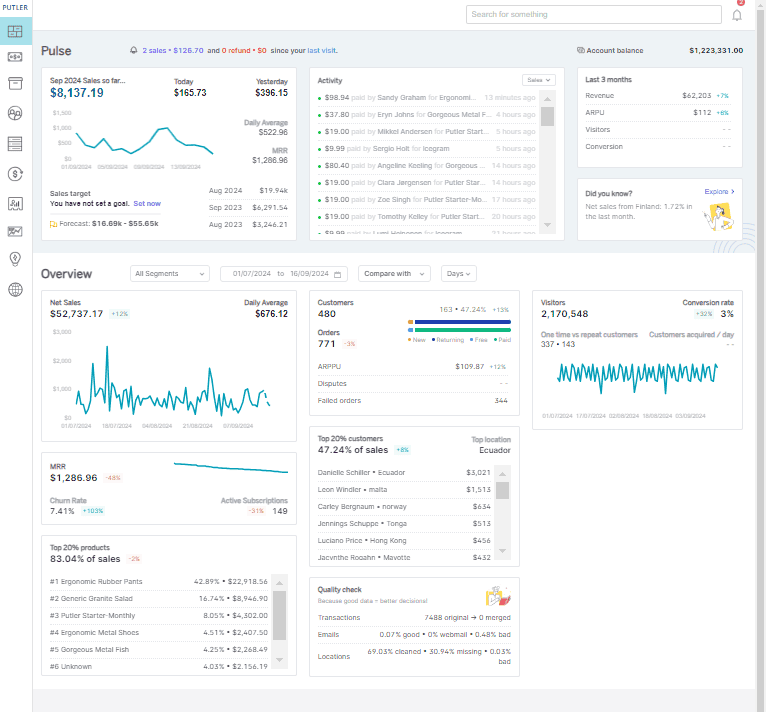
The home dashboard offers a comprehensive overview of your revenue and customers. You’ll find everything you’re looking for – from insights, trends, to daily activities.
You can also check Net Sales, Revenue Per Day, 3-month comparison of Revenue and Visitors, among others. There’s also a section, not seen before in other tools, that gives you one key insight every day.
Benefit: These key metrics and insights give you a heads-up on what’s trending and what’s not. You can take a cues from these metrics and then amplify what’s working and improve what’s not.
Wrapping it up
There’s no escaping data. Even the smallest of businesses use marketing analytics in different forms for decision-making. Analytics helps brands innovate or improve existing strategies, pushing them higher up the ladder of success.
But this isn’t it. You can do a lot more with analytics. If you liked this blog, head over to our guide for presenting store analytics to attract investments.
If you want to know more about our tool, reach out to us or drop a comment below!
FAQs
1. How is AI changing marketing analytics?
AI enhances marketing analytics by:
- Predicting customer behavior and purchase intent
- Automating data collection and reporting
- Personalizing campaigns based on real-time insights
- Identifying patterns humans might miss
2. How can marketing analytics improve personalization?
Marketing analytics helps businesses create hyper-personalized campaigns by:
- Segmenting audiences based on behavior, purchase history, and demographics
- Delivering targeted offers and content
- Improving customer retention through tailored messaging
3. Can marketing analytics track cross-channel performance?
Yes! Modern analytics tools track performance across all marketing channels, including:
- eCommerce and subscription revenue
- Paid ads
- Email campaigns
- Social media
- Organic search
4. How does marketing analytics help predict future trends?
Predictive analytics uses historical data to:
- Forecast revenue and customer growth
- Identify seasonal patterns and demand surges
- Spot upcoming market trends
5. What are some common mistakes businesses make with marketing analytics?
Some frequent mistakes include:
- Tracking too many KPIs instead of focusing on the right ones
- Using disconnected tools that create data silos
- Ignoring customer segmentation insights
- Failing to act on the data collected