How does your store compare to the competition? What is your competitive edge and how do you leverage it in order to grow? These are common questions when presenting store analytics to potential investors. Here, we will explore a few tips and tricks for creating an engaging presentation that highlights key metrics.
Introduce yourself and your business
The key to starting a pitch is confidence.
Introduce yourself and your business, be positive so that you can kick-start the meeting! No need to sugarcoat just be energized and professional. A possible template to start the meeting can be as easy as follows;
“Hi, I’m
Provide an overview of the store’s history, including the founders’ vision
The next best way to make a good impression is by providing an overview of the store’s history. This includes telling them about how you and your partners came up with this idea, why it matters in today’s world, who are some people like that have helped pave our path so far? You can even share stories from time to time! Storytelling is the key to build empathy.
Explain where you are in terms of growth
Now let’s talk about business! Explain where you are in terms of growth. Investors would like to see the opportunity but also they’d be able to get some idea of what it is that makes your company tick so we can work out if it’s a good match for them too. This gives an insight into how important communication with investors really is when talking finances, especially at first glance.
Metrics that can get investors interested in your business
Investor are interested in numbers so the best way to convince them is to provide them stats. Now there are multiple tools that can help you get metrics like sales trends, customer LTV, product performances etc. But here is one tool which can help you fetch all these stats within seconds in one place.
Putler is an all-in-one reporting tool which provides in-depth information about your business. You can pull in the below stats and a lot more using it. Let’s a take quick look at what stats can impress your investors and how you can get them within Putler.
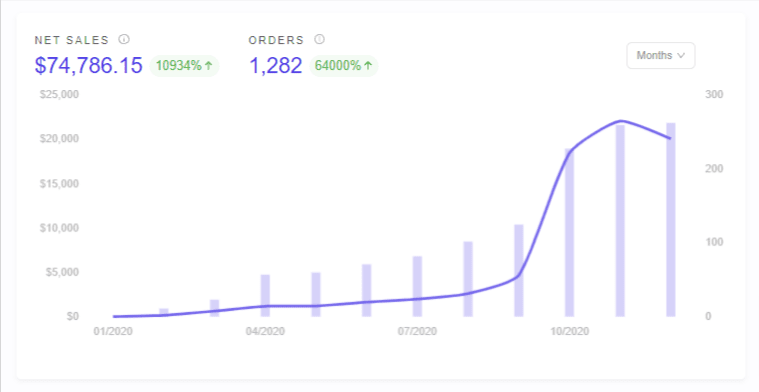
Sales trends
A great way to show your store’s growth is pulling in sales stats and showing it in a graphical format. You could use multiple tools to achieve this but the simplest way to do is is using Putler.
Here’s how-
Using Putler you can easily change the date range for which you want to see the Sales Chart for and within seconds Putler will present it before you.
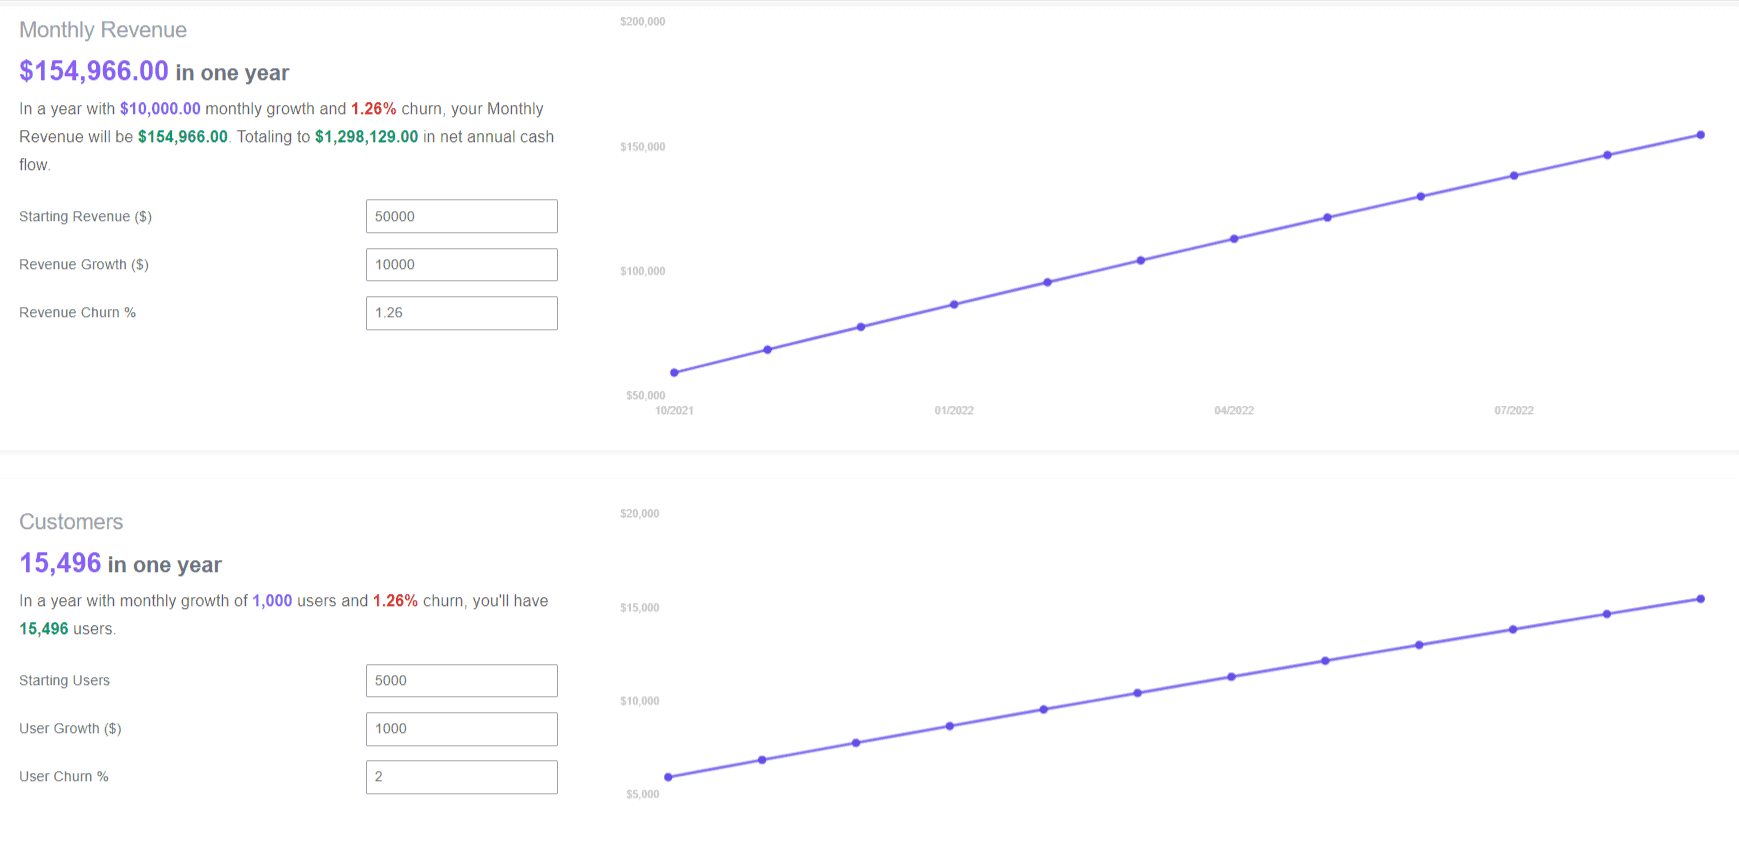
Forecasts
Showing investors a clear view of the future is important. It not only excites them but also helps increasing their confidence in your product. Using Putler, you can add your current numbers and predict the revenue growth as well as customer growth for a year.
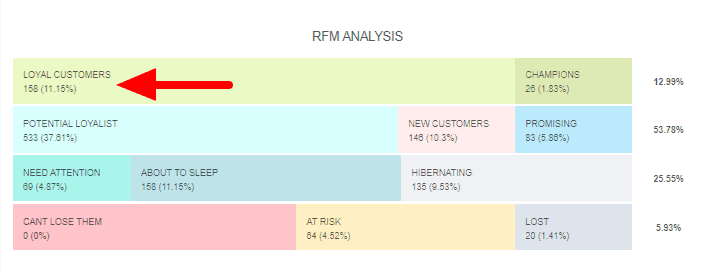
Total number of loyal customers
Apart from sales, you can also attract investors by providing them information about your loyal customers. Loyal customers are those that keep patronizing your business frequently and contribute to your revenue. Giving a stat of how many loyal customers your business has will again reinforce their confidence into investing in your business.
Putler can give you the total number of your loyal customers using the RFM chart. Also, once you click on the chart you can find out who exactly are these loyal customers.
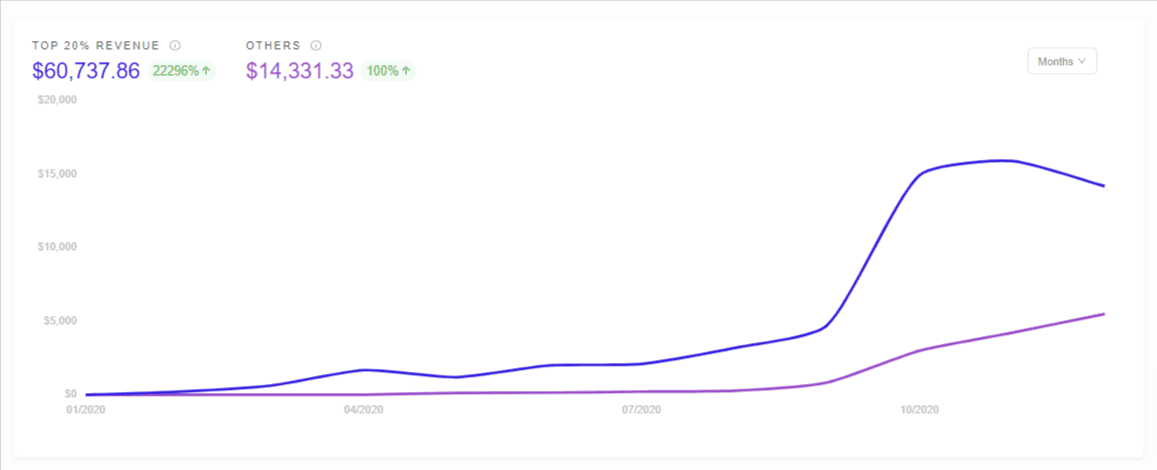
Top 20% product performance
If you have a multistore product, you can also portray the performance of the Top 20% products that contribute to 80% of your total revenue.
Putler already has a metric which does this for you. Not just that, it also shows you which exactly are your top 20% products. You can again use this information while presenting to your investors.
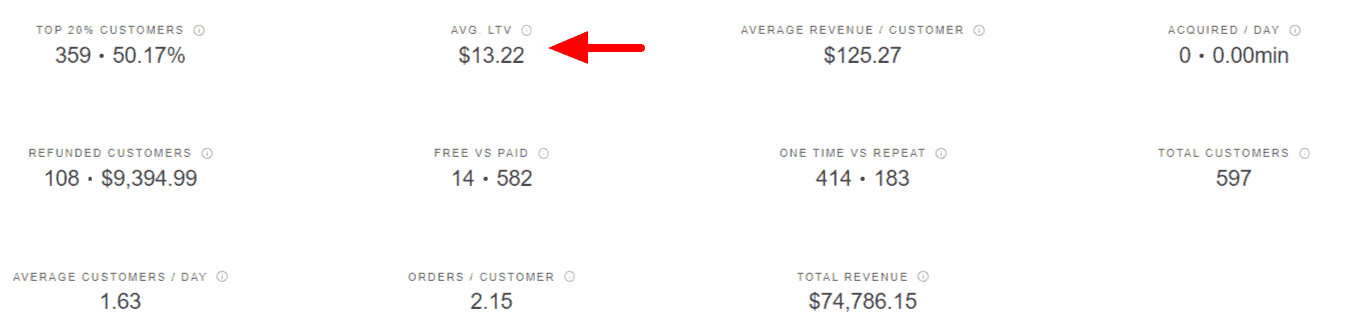
Customer LTV
Having long term customers is a sign of a stable business. So presenting the Customer LTV is again a good measure that allows investors to evaluate the stability of your business.
You can find this metric within Putler’s customer dashboard.
Investors are always looking for new ideas but, they also want to invest in businesses that have some traction and growth. For many, investing is a numbers game. If you don’t have the right metrics to show for your company’s success or if investors want more data points than what can be provided in an initial pitch presentation then it may not be worth pursuing them as potential partners – even though their interest might seem exciting! It doesn’t matter how far along are on one project because they’ll always ask about future opportunities first before considering funding any other ideas at all (even ones we think would yield higher returns).
Present your store analytics in a way that is interesting and easy to understand
Despite the fact that store analytics can be tricky for people who haven’t been in e-commerce too much. For that reason, our advice is to present your store data with an interesting and easy-to-understand visual representation like an infographic or chart instead of text-heavy slides which could confuse some audience members on how the numbers have changed over time.
Explain the significance of your results, including any trends or patterns
When it comes to presenting data, infographics are a great way of visualizing information. But sometimes they can be tricky if you’re trying to read the text and understand what each statistic means at first glance—so explain your results in detail! You may also want to mention any trends or patterns that stand out more than others; this will give readers context while making comparisons between different brands/analytics sets as well gives some insight into how successful previous campaigns were (or weren’t). You could compare results with successful brands or analyze analytics from past projects for insights into how they perform against competitors’ work.
Outline what has worked for you so far, both financially and strategically
Now that you showed some past results, now it’s best to outline what has worked for you so far. Your financial and strategic growth should be outlined in this section as well!
For example, an insight into how much money can help your company grow by outlining its benefits with strategies on how they’ll work together.
Offer a forecast on how much more money is needed to grow over the next few years (if desired)
Now, this is your chance to show that you have what it takes by making an investment ask, in numbers. Make sure to present it with a forecast on how much money will be needed in order for the company’s growth plan to succeed over time!
Over to you!
Presenting store analytics is a lot like pitching your idea to a client. You need to show how you are doing, what you are aiming for, and what they can do to help make it happen. To avoid any misunderstandings or miscommunications with investors, we recommend using these free business templates from Decktopus when presenting your store analytics data. This way, everyone will be on the same page about where things stand and what needs to be done next!
- Subscription Analytics Tools: The Details You Need to Know
- Top 10 Stripe Analytics Software 2023
- Top Web Analytics Tools Of 2023
- PayPal Analytics: Top 11 Tools Of 2023
- 10 Best Etsy Analytics Tools That Give Accurate Etsy Reports
- 11 Best Shopify Analytics Tools